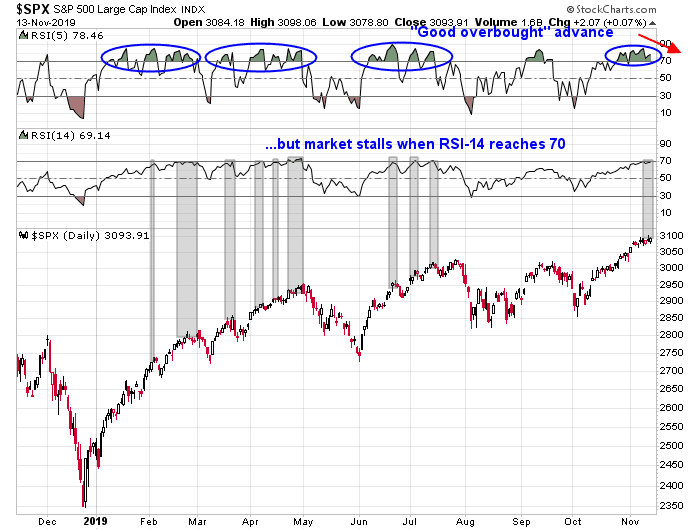
Mid-week market update: What to make of today’s market? It is obviously overbought. The 14-day RSI is skirting the 70 level, which defines an overbought condition and that has been the reading at which past advances have temporarily stalled. Arguably, the 5-day RSI is flashing a series of “good overbought” conditions indicating strong price momentum, though it did signal a minor bearish divergence.
Neither Trump’s speech yesterday nor Powell’s testimony today revealed much new information to move the stock market. However, the market did hit a minor air pocket today over a WSJ report that the trade talks hit a snag over agricultural purchases, but the weakness has been only a blip and can hardly be described as catastrophic.
Trade talks between the U.S. and China have hit a snag over farm purchases, according to people familiar with the matter, creating another obstacle as Beijing and Washington try to lock down the limited trade deal President Trump outlined last month.
Mr. Trump has said China has agreed to buy up to $50 billion in U.S. soybeans, pork and other agricultural products annually. But China is leery of putting a numerical commitment in the text of a potential agreement, according to the people.
Beijing wants to avoid cutting a deal that looks one-sided in Washington’s favor, some of the people said, and also wants to have a way out should trade tensions escalate again.
“We can always stop the purchases if things get worse again,” said one Chinese official.
Traders will have to rely on technical analysis to read the tea leaves. Overbought conditions can generally be resolved in two ways, either a correction in price, or time. What’s the most likely outcome?
Watching for a top
It is said that while market bottoms are events, which are defined by panics, tops are processes that evolve over time. That is why it is much more difficult for a technical analyst to spot a top than a bottom.
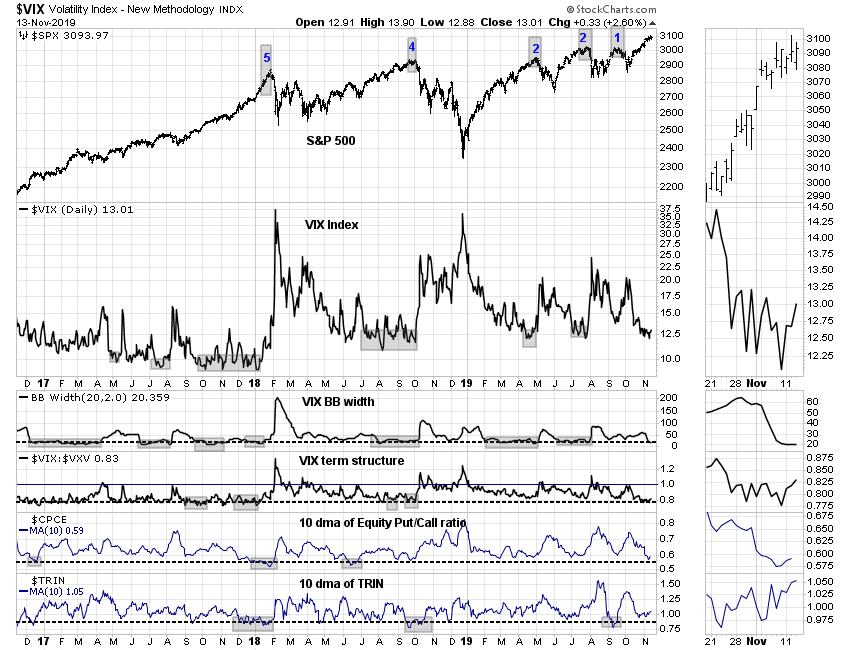
Here are some indicators that I am watching. Here is a set of technical and sentiment indicators that are indicating complacency.
- The absolute level of the VIX Index (historically low = complacency)
- The Bollinger Band width of the VIX Index (low band width = low historical volatility = complacency)
- VIX term structure, defined as the ratio of the 3-month VIX to 1-month VIX (low = complacency)
- 10-day moving average of the equity-only put/call ratio (low = complacency)
- 10-day moving average of TRIN (low = excessive buying pressure, or excessive bullishness)
Here is the chart. Current conditions 3-4 of the five boxes. But these indicators have had a spotty top calling record. A glance at past tops in the last three years show that between 1 and 5 indicators have flashed warnings. Simply put, there are too many false positives to make these indicators to be actionable sell signals.
There are, however, two excellent indicators that have flashed tactical sell signals.
- When the VIX Index closes below its lower Bollinger Band
- When the 10-day correlation between SPX and VIX spikes to above
10
Here is the chart. The sell signals worked like charms, The market advance has either temporarily stalled or pulled back whenever one of these signals were triggered in the last three years. However, neither of these indicators flashed a warning sign at the major top that occurred in late September 2018.

Neither of these indicators are in the sell danger zone today.
A correction in time
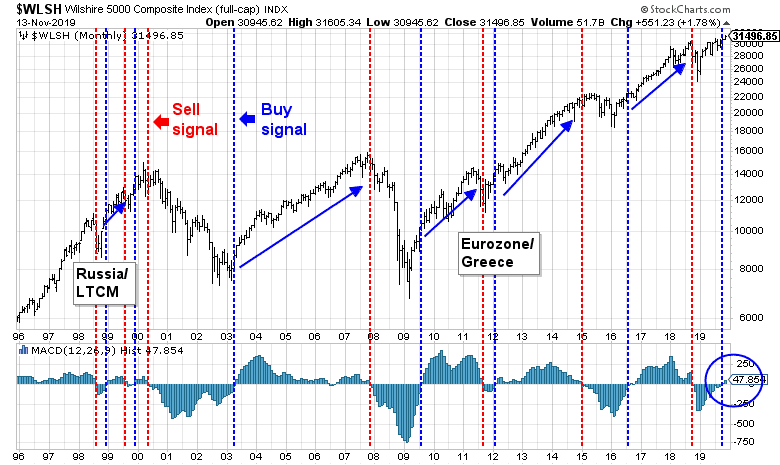
How can we interpret these conditions? The market is displaying strong price momentum. I have pointed out before that the broad based Wilshire 5000 flashed a long term buy signal on the monthly chart. In the past, these buy signals have lasted at least a couple of years, and resolved with higher prices 100% of the time.
In the short run, the relative strength of the top 5 sectors in the index reveals bullish underpinnings. These sectors represent just under 70% of index weight, and the market cannot move up or down without significant participation by these heavyweight sectors. Right now, three of the sectors are exhibiting relative strength, and only the smallest of the top 5, consumer discretionary stocks, are in a relative downtrend. This argues for an intermediate term bullish outlook.

In conclusion, the combination of strong intermediate term price momentum, indications of an extended market in the short run, and the lack of actionable sell signals point to a period of either consolidation or shallow pullback. Downside risk is likely to be no more than 1-2%.
My inner investor is bullishly positioned. My inner trader is long, and he is prepared to buy any dips.
Disclosure: Long SPXL
Thanks, Cam.
Does “not QE $60B/month” beat out overbought RSI?
It worked for Obama. The “Not QE” money has to be finding its way into stocks just as QE did.
Thank you, Cam. One question on the point
“When the 10-day correlation between SPX and VIX spikes to above 1” – I’m guessing this is a typo as correlations are bounded above at 1. Thanks again, Matt
You are right. That should read correlation spikes above 0.
Thanks, Cam.
Underperformance of cons disc is probably due to mainly weak AMZN price