Preface: Explaining our market timing models
We maintain several market timing models, each with differing time horizons. The “Ultimate Market Timing Model” is a long-term market timing model based on the research outlined in our post, Building the ultimate market timing model. This model tends to generate only a handful of signals each decade.
The Trend Asset Allocation Model is an asset allocation model which applies trend following principles based on the inputs of global stock and commodity price. This model has a shorter time horizon and tends to turn over about 4-6 times a year. In essence, it seeks to answer the question, “Is the trend in the global economy expansion (bullish) or contraction (bearish)?”
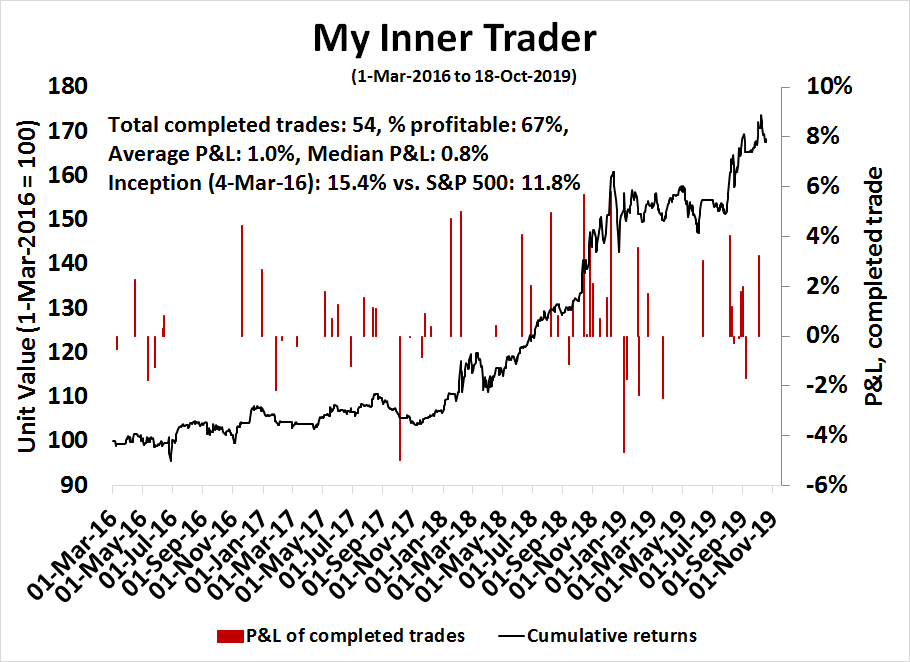
My inner trader uses a trading model, which is a blend of price momentum (is the Trend Model becoming more bullish, or bearish?) and overbought/oversold extremes (don’t buy if the trend is overbought, and vice versa). Subscribers receive real-time alerts of model changes, and a hypothetical trading record of the those email alerts are updated weekly here. The hypothetical trading record of the trading model of the real-time alerts that began in March 2016 is shown below.
The latest signals of each model are as follows:
- Ultimate market timing model: Buy equities
- Trend Model signal: Neutral (upgrade)
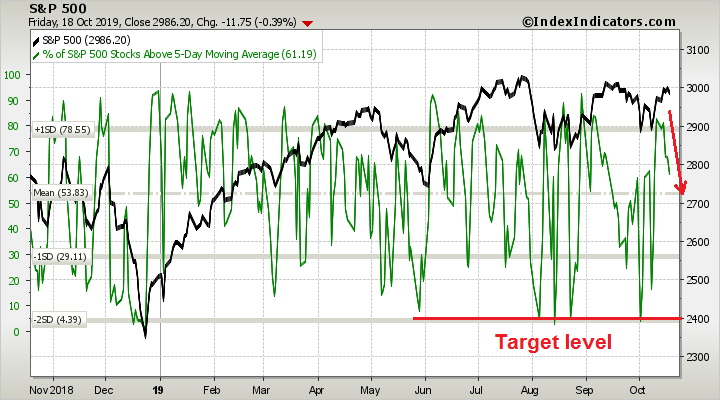
- Trading model: Bearish
Update schedule: I generally update model readings on my site on weekends and tweet mid-week observations at @humblestudent. Subscribers receive real-time alerts of trading model changes, and a hypothetical trading record of the those email alerts is shown here.
A stealth decoupling
As the Sino-American trade war has progressed into Cold War 2.0, a consensus is emerging among analysts that the Chinese economy is starting to decouple from the rest of the world. However, in the short run, there is a stealth and surprising decoupling in performance occurring in global equity markets. It’s the US market from the rest of the world.
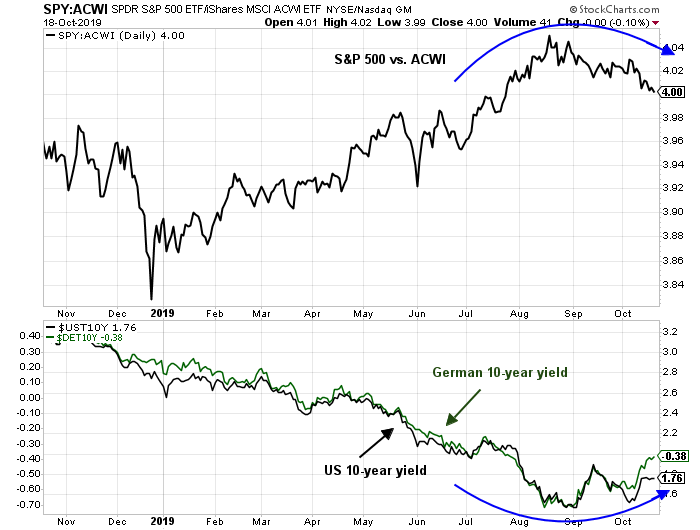
This development is important because US equities amount to roughly half of global equity market capitalization. The chart below of major markets relative to MSCI All-Country World Index (ACWI) tells the story. US relative strength peaked out in late August and began to roll over in September. At the same time, Japan has been climbing steadily, Europe has broken out of a bottoming process, and EM equities appear to be making a relative strength bottom.

We consider the implications of this emerging trend, and what it means for equity investors.
Regular readers know that my Trend Asset Allocation Model analyzes global equity and commodity markets to determine the level of equity risk to take (see A market beating Trend Model, and what it’s saying now). Real-time market signals are indicating that the global reflationary scenario is coming into play. While there are still risks, current conditions warrant the upgrade of the Trend Model signal from bearish to neutral.
Should the global economy undergo a cyclical rebound, it will be equity bullish, and a rising tide does lift all boats. However, US equities are likely to lag, and an underweight position is the best course of action under these circumstance. We are now seeing early signs of price momentum recovery in Europe, which is where investors should overweight. It may be still a little early for an overly bullish commitment to EM, or inflation hedges like gold. I would remain at a neutral weight in these assets while waiting for more confirmation signs of more firmness in global growth.
From a trading perspective, an upgrade in the Trend Model would normally result in a bullish signal in the trading model. However, the growing divergence and decoupling of US equities from global markets makes this an uncertain bet, and I remain tactically bearish.
The trade setup
The latest BAML Global Fund Manager Survey gave us some clues to this trade setup. Global managers were at a roughly market weight in equities, their most overweight region was the US.
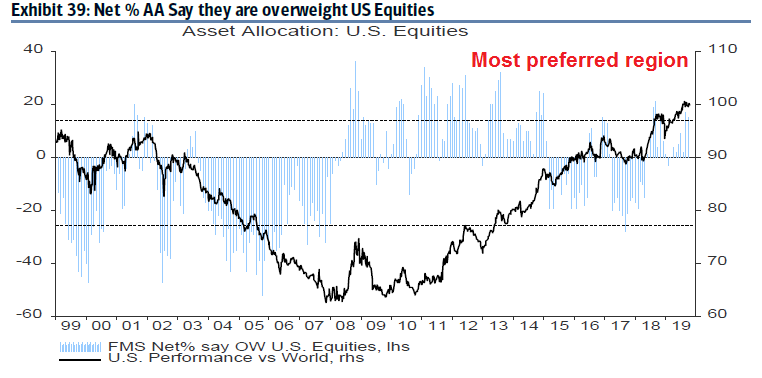
In an environment where growth expectations are low, the US was the only source of growth in a growth starved world. Consequently, managers who had hold equities stampeded into US equities, in the manner where some investors bought low volatility and defensive stocks.
In short, the allocation to US equities had become a little crowded. What could go wrong?
What’s the pain trade?
Under these conditions, the pain trade for investors is a cyclical recovery and a reflationary economy. Just as the relative performance of US equities peaked in late August, bond yields bottomed, and began to rise. This is a bond market signal of higher growth and inflationary expectations.
Indeed, Jeroen Blockland observed that the amount of negative yielding debt has fallen by 20% from USD 17 trillion to just over USD 13 trillion.

Inflation surprise is edging up in selected regions around the world.

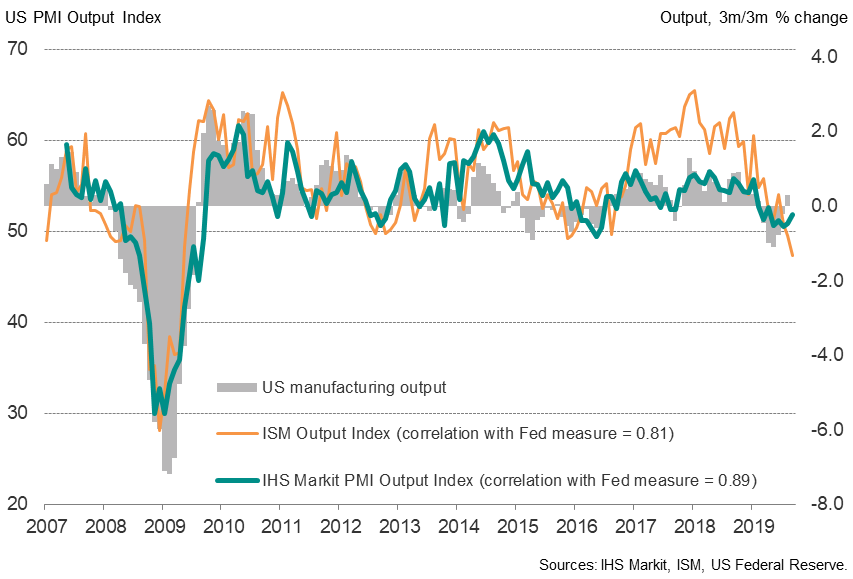
Even the disappointing ISM M-PMI print that recently rattled markets is deceiving. The reading was not confirmed by IHS Markit PMI, which came in strongly and ahead of expectations.
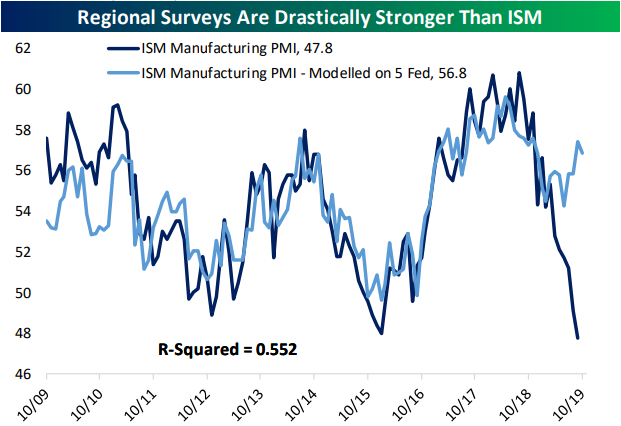
As well, Bespoke observed that it showed a significant divergence compared to an average of regional Fed manufacturing composites.
In Europe, growth expectations are being spurred by the combination of rising German willingness to engage in fiscal stimulus, the likely alleviation of a disorderly no-deal Brexit, and growing eurozone unity.
The news of a Brexit deal, which still has to be ratified by the British and European parliaments, was a relief for the markets, and reduced the Brexit risk premium embedded in UK and European equities. The deal outlined in the EU press release can be summarized this way:
- Northern Ireland will remain the UK customs area, not as part of the EU customs area as per the Theresa May proposal. However, goods “at risk of entering the single market” will have EU tariffs applies.
- Northern Ireland stays in the EU VAT regime.
- Level playing field protections on environment stay.
- Stormont will have a veto, but it will be limited. The Northern Ireland assembly will be able to vote on whether to continue with this arrangement four years after the transition period ends in December 2020.
A Brexit Withdrawal Agreement was not a total surprise to the financial markets. Even as the large cap FTSE 100 with greater exposure to multi-nationals struggled, the smaller cap FTSE 250, which is more exposed to the domestic economy, had been rallying since August, The ratio of the FTSE 250 to FTSE 100 (bottom panel) broke out of a relative downtrend in mid-August and has been rising strongly ever since. And even though MPs voted to postpone approval of the deal on Saturday, which necessitates a British government for an extension of the October 31 Brexit deadline, this nevertheless greatly diminishes the risk of a disorderly no-deal Brexit.

Less noticed was the Reuters report that Italian euroskeptics League leader Matteo Salvini’s assertion that the euro is irreversible.
League leader Matteo Salvini said on Monday the euro was here to stay and he hoped that nobody in his far-right, eurosceptic party would ever again raise doubts over Italy’s membership of the single currency.
The League ran at the European elections in 2014 under the slogan “No Euro” and it presented prominent anti-euro campaigners among its candidates for May’s EU ballot, when it won 34% of the vote to become Italy’s largest party.
However Salvini, who had already distanced himself from calls to quit the currency during his recent time in government, made clear his party would never again stand on an “Italexit” ticket as he bids to portray a more moderate image.
In short, the growth and risk outlook for Europe are all turning positively.
How US stocks could lag
While a global reflationary scenario is undoubtedly bullish for equities, it also presents a dilemma for US equity investors because US stocks are likely to lag under such circumstances. Underperformance can be attributable to three reasons, namely excess valuation, rising political risk, and trade war uncertainty.
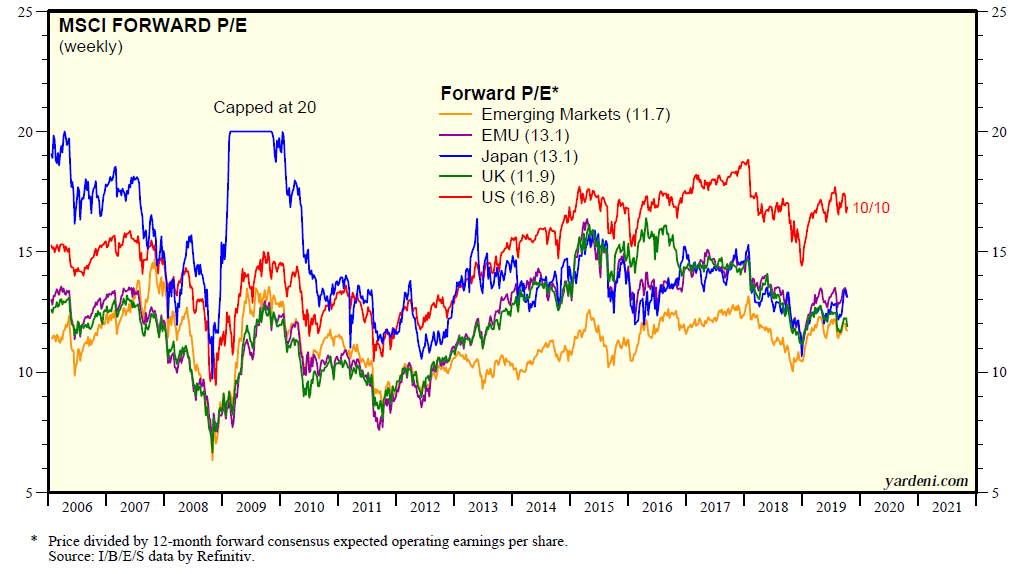
Investors in US equities face a similar dilemma as the investors who stampeded into low volatility and defensive stocks that sparked the recent price moment trade and subsequent reversal. It has been a crowded trade, and valuations are now elevated. The forward P/E ratio on US stocks stand out compared to other major regional equities. While the US market trades at roughly 17 times forward earnings, the forward P/E for the rest of the world are clustered at low double digit levels.
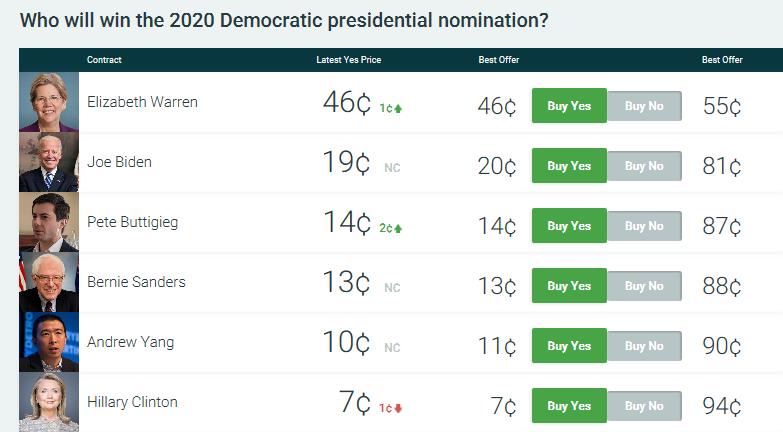
Another factor investors may not have considered is political risk. It is becoming evident that Elizabeth Warren is becoming the front runner for the Democratic presidential nomination. However, the markets have not fully discounted the possibility of Warren’s candidacy. The issue will likely hit the headlines between now and Super Tuesday in March, when the nomination picture becomes more clear. The general market consensus is a Warren White House will be bearish for the markets. My own analysis (see What would an Elizabeth Warren presidency look like?) suggests that while the issues raised by Wall Street will be mildly negative, her trade policies are likely to exacerbate tensions with China, which raises the prospect of an extended trade war with China.
In addition, the handshake trade deal with China seems to be unraveling. When the agreement was announced, there was an expectation that the details would be ironed out so that Trump and Xi could ink a deal at the APEC summit in Chile in November. Now the Chinese have wavered on the commitment to buy $40 to $50 billion in agricultural products, which is understandable as that figure amounts to roughly double the peak of Chinese purchases, and they want an elimination of all existing tariffs in return. In other words, there is no deal, but both sides are still talking.
Key risks
There are two major risks to the global reflationary scenario. The first is slowing Chinese growth. Statistics coming out of China have been disappointing, and its Economic Surprise Index, which measures whether economic releases are beating or missing expectations, have been falling.

Xinhua reported an unusual speech by Premier Liqiang calling for the fulfillment of economic targets. China’s economic statistics, and especially GDP growth statistics, are highly massaged and virtually never miss their targets. This speech is a signal that official GDP growth will come in at the lower end of targets, and actual growth could be substantially lower.
Chinese Premier Li Keqiang on Monday called for more efforts to ensure the fulfillment of major targets and tasks for economic and social development.
Amid more complicated international situations and slowing global economic growth, the Chinese economy has maintained its overall stability so far this year, with steady progress in structural adjustment and continuous improvement in people’s livelihood, Li said in Xi’an while chairing a symposium attended by heads of some provincial governments to analyze the current economic situation.
To achieve the annual goals, China needs to place more emphasis on stabilizing economic growth and maintaining economic performance within a reasonable range, unleash more potential of domestic market demand, and foster effective investment and consumption demand, Li said.
The country should step up efforts to enhance the economy’s resilience, address downward pressure, increase employment, keep prices stable, and safeguard people’s livelihood, according to the premier.
After Li’s speech, China’s Q3 GDP printed a growth rate of 6.0%, which was below the expected rate of 6.1%, and below the Q2 growth rate of 6.2%. How does a slowing Chinese economy square with a scenario that postulates a global cyclical growth revival? In particular, how will commodity prices, EM and Asian economies exposed to China, and commodity exporting countries cope with continued deceleration in Chinese growth?
For a contrary view, China watcher Michael Pettis thinks that a GDP growth of 6.0% is actually good news as a signal of the resiliency of the Chinese economy:
The Q3 GDP growth of 6.0% probably has little to do with trade war and everything to do with declining domestic investment. On a comparable basis China’s GDP is growing by much less than 6 percent, and its is only by allowing rising debt to fund non-productive activity — and not writing down the resulting losses — that it can show growth rates even at these levels. For that reason a GDP growth rate of 6 percent, or even lower, is relatively good news. It means Beijing is serious about getting debt under control and is politically secure enough to tolerate slower [economic] activity.
Another risk is the prospect of trade war enlargement. Trump is on the verge of open a second front in the trade war, this time with the EU. The WSJ reported that Bundesbank president Jens Weidman stated a US-EU trade war would be far more devastating that a trade war with China, and it could cut GDP growth by over 0.5%.
Deutsche Bundesbank leader Jens Weidmann said Wednesday that rising trade tensions around the world have the potential to slow growth markedly, in comments that also expressed continuing concern with the European Central Bank’s stimulus efforts.
“A full-blown trade war between the United States and the European Union could cost both sides dearly,” Mr. Weidmann said in a speech in New York at the Council on Foreign Relations.
“The potential adverse effects might be considerably larger than in the case of the current trade spat with China,” and even there, things are looking worrisome. Mr. Weidmann said in the current China-U.S. squabble, “the measures that have been adopted or brought up could cut the output of both countries by more than a half percent over the medium term. World trade would be reduced by 1.5%.”

Investment implications
Regular readers know that my Trend Asset Allocation Model analyzes global equity and commodity markets to determine the level of equity risk to take (see A market beating Trend Model, and what it’s saying now). Real-time market signals are indicating that the global reflationary scenario is coming into play. While there are still risks, current conditions warrant the upgrade of the Trend Model signal from bearish to neutral.
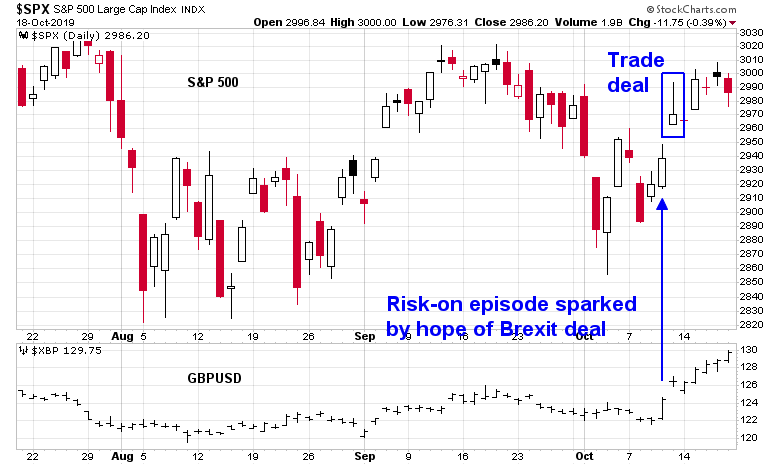
In fact, a US-centric analysis could easily have been confused by the better tone to the markets. The latest risk-on tone was sparked by optimism over a possible Brexit deal on October 10, as evidenced by the jump in the GBP exchange rate. Market enthusiasm continued when American and Chinese negotiators ended their meeting in Washington the next day, and the US announced a preliminary trade deal. Simply put, the driver of the latest bull move is non-US, and an analyst focusing on mainly US events would have missed the subtle difference amidst the noise of the trade deal.
Should the global economy undergo a cyclical rebound, it will be equity bullish, and a rising tide does lift all boats. However, US equities are likely to lag, and an underweight position is the best course of action under these circumstance. We are now seeing early signs of price momentum recovery in Europe, which is where investors should overweight. It may be still a little early for an overly bullish commitment to EM, or inflation hedges like gold. I would remain at a neutral weight in these assets while waiting for more confirmation signs of more firmness in global growth.
The week ahead
The tactical picture for the week ahead is problematical for my trading model. By design, an upgrade in the Trend Model should result in a bullish signal in the trading model. However, the growing divergence and decoupling of US equities from global markets makes this an uncertain bet.
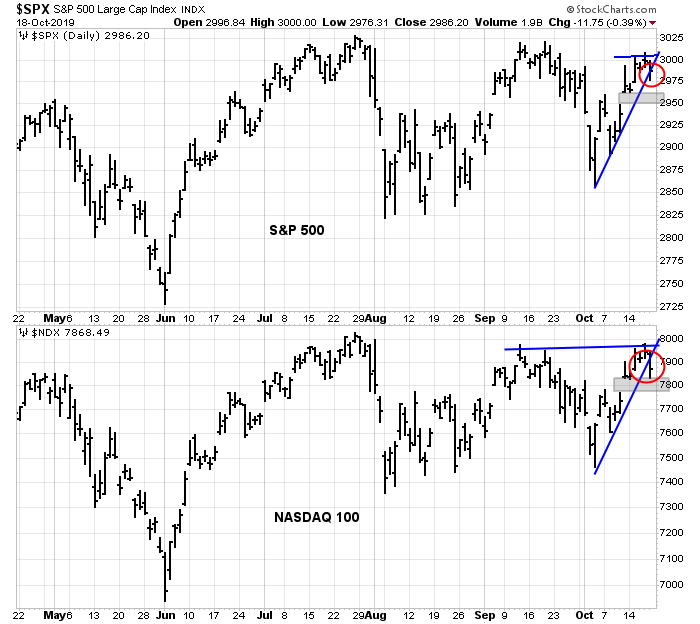
I had identified rising triangles in the SPX and NDX earlier in the week (see Why small caps are lagging (and what it means)), and I wrote that I was waiting for the triangles to resolve themselves. I was ready to pull the trigger on turning bullish from bearish later in the week, but both indices failed to stage upside breakouts. Instead, the two indices broke down through the rising trend line, leaving unfilled gaps below as the first downside targets. The market was exhibiting strong internals, and it had every chance to stage an upside breakout.
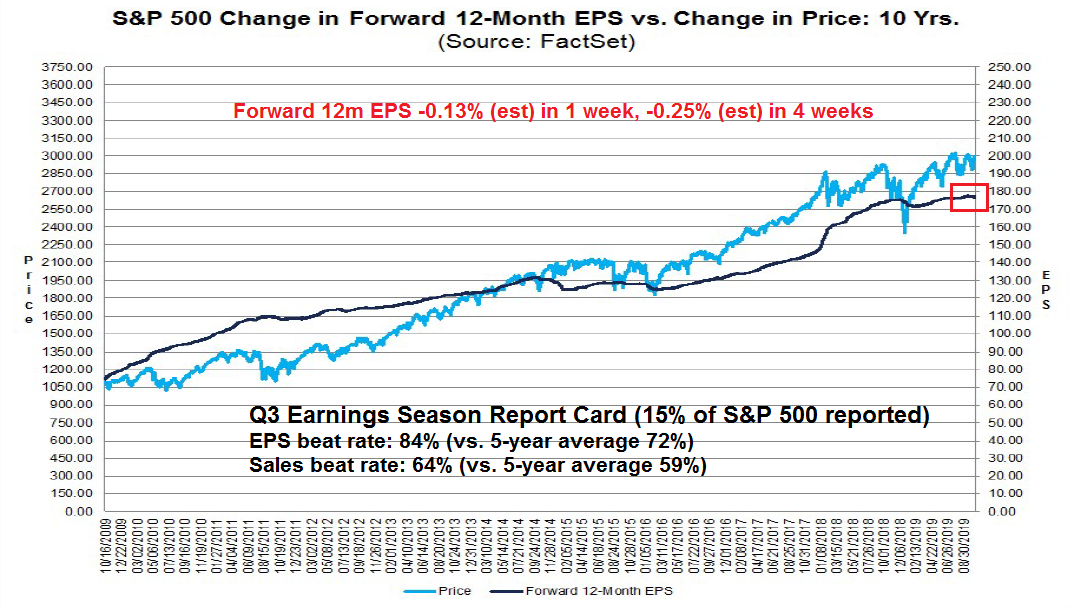
After all, the preliminary results from Q3 earnings season were ahead of expectations. Earnings beats were strong, why didn’t stock prices rally? Further analysis from FactSet revealed that while EPS and sales beat rates were ahead of historical averages, forward EPS estimates were falling, indicating a lack of fundamental momentum.
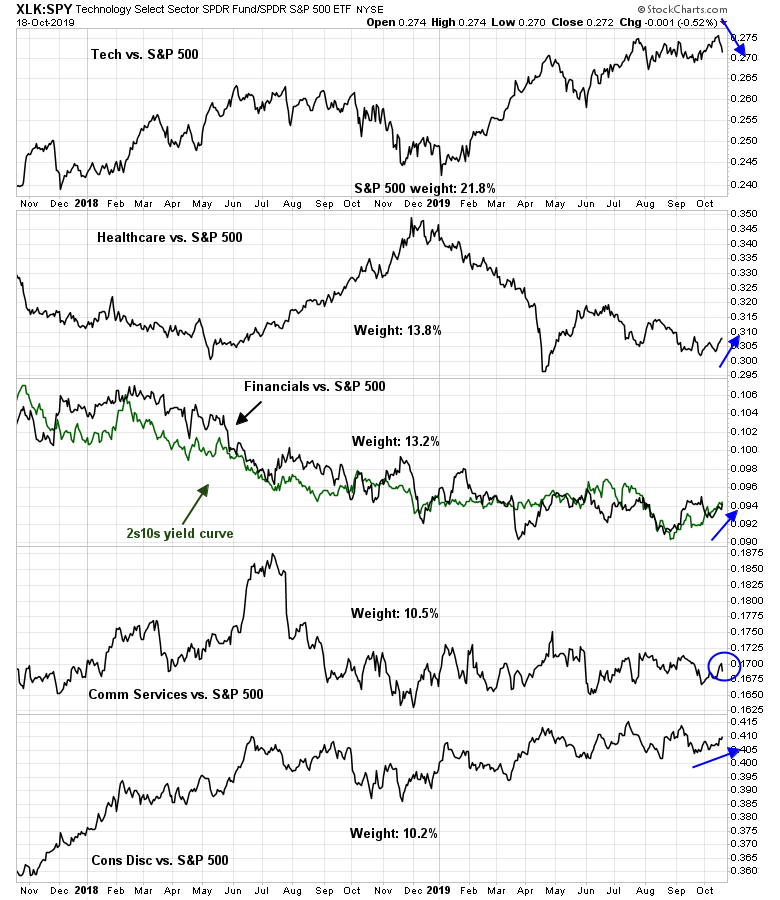
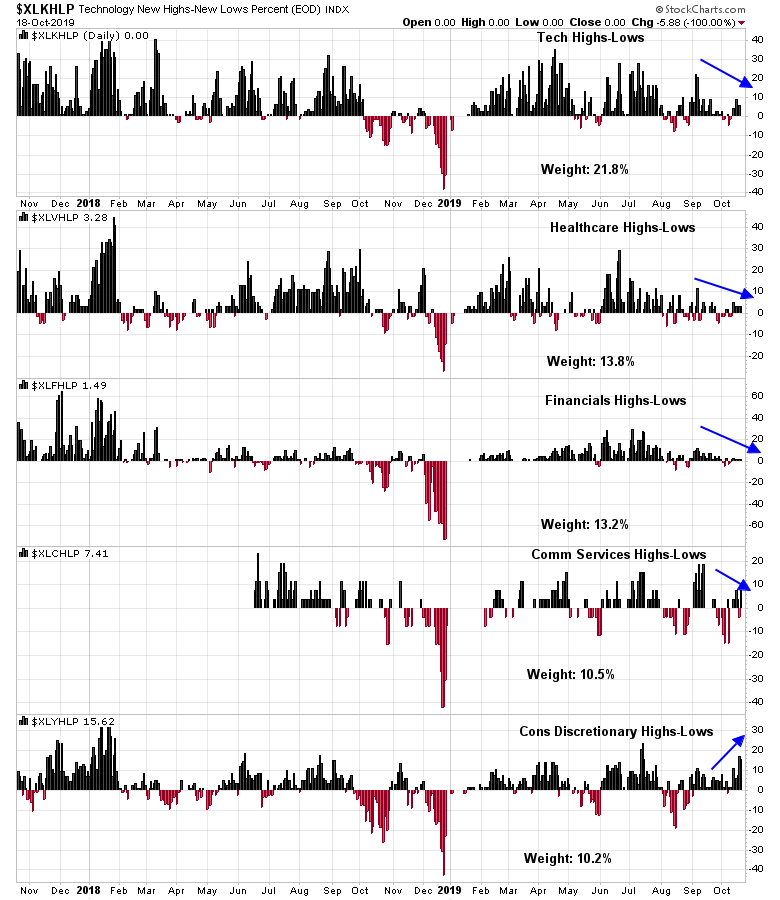
Internals were strong earlier last week, as most of the top five sectors were exhibiting positive relative strength, which was a signal that the market was ready to stage an upside breakout. But Technology and Communication Services faltered later in the week. That made the score 37.2% of index weight in strong sectors and 32.0% in weak sectors. It is difficult to see how the major market could rally to new highs without a majority of the sectors showing positive relative strength, as the top five sectors make up close to 70% of index weight.
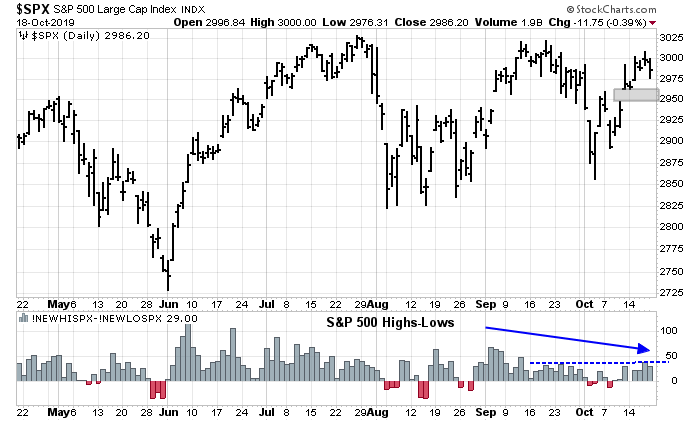
Breadth was also disappointing. Net new highs-lows failed to rise, and had been in decline even as the market tested resistance.
A similar pattern of fading new highs-lows can also be seen in virtually every one of the top five sectors, except for Consumer Discretionary stocks.
Market positioning may also serve to put a lid on any market rally. Bloomberg reported that SPY shorts are near historical lows. With the market so close to an all-time high, traders were avoiding shorting the ETF. In the past, such readings have resolved with market pullbacks.

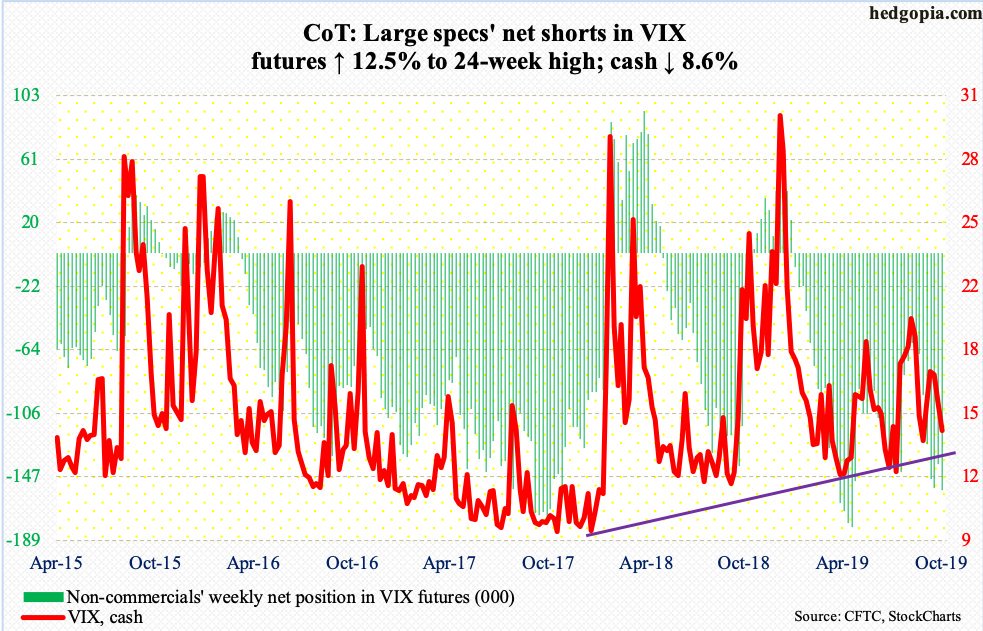
Hedgopia also observed that large speculators’ short positions in VIX futures are highest since April, “Cash itching to rally near term; medium term, tends to peak when these traders get net long, or substantially curtail net shorts.” As this is contrarian bullish for the VIX Index, and VIX is inversely correlated with stock prices, this is a bearish setup for equities.
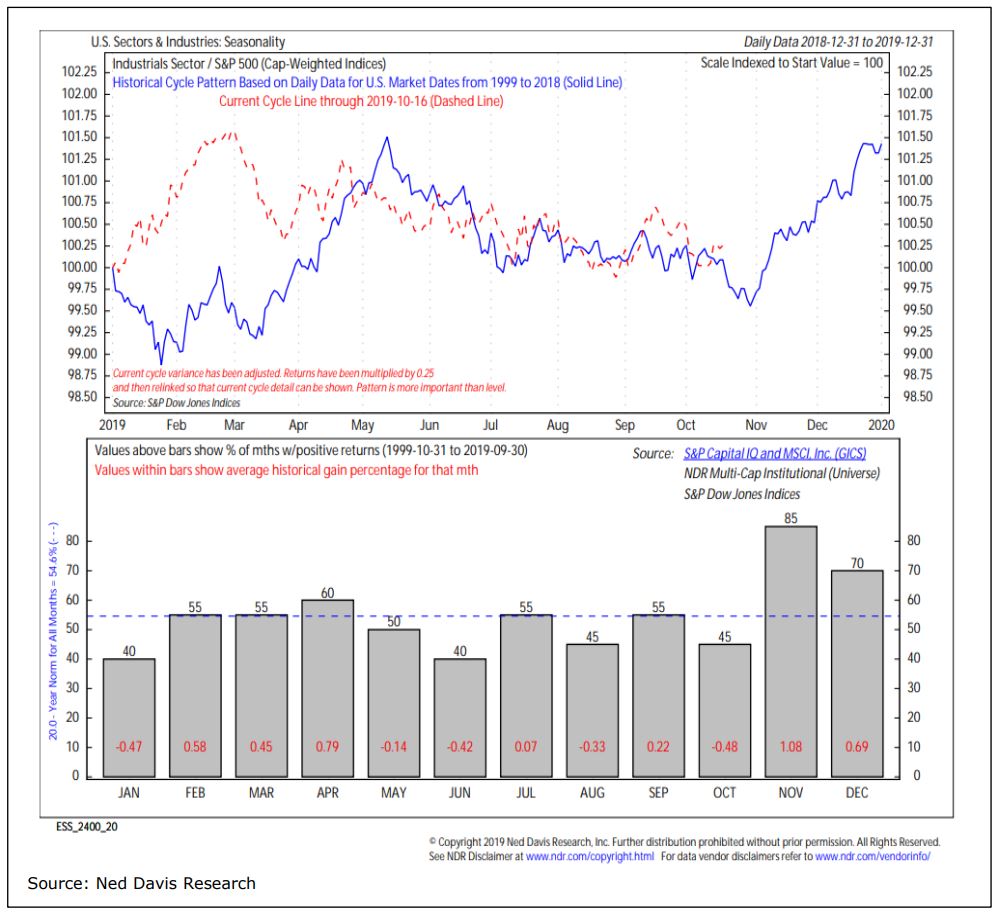
The market may just be entering a period of negative seasonality until month-end, when it has typically begun a year-end rally.
Tactically, the decline appears to be just getting started. Momentum indicators are just recycling from an overbought condition, and they are not oversold yet.
My inner investor is re-positioning his portfolio from an underweight position in equities to market weight, but additional exposure will come from non-US markets. My inner trader is slightly changing his view from just a bearish position to buy the dip, but he is staying short and not buying just yet.
Disclosure: Long SPXU
Thanks, Cam. Nice short-term/longer-term road map. I agree with looking outside the US for additional exposure (in addition, I’m avoiding bonds for now). The benchmark I’ve always used is Vanguard’s Total World Market. VT/VTWSX is basically a 50/50 mix of VTI (total US)/ VXUS (total international) – so one way to underweight the US is to use a different mix->30/70, maybe. Personally, I’m front-running a rally in Emerging Markets as well – using position size to manage the higher volatility.
Maybe buy a SPY put spread since IV’s are terrible and… when this SPX downside will manifest is uncertain. And limited loss .vs. a short position.
Sorry…. since IV’s are NOT terrible…
Thanks Cam:
Will do some more work to evaluate European exposure. General question, would you suggest a hedged etf like HEDJ, or something unhedged like VGK, EZU, IEUR, etc.?
Thanks!
I don’t have a strong position on currency, but now that the USD appears to be weakening, my inclination is to stay unhedged for a USD based investor.
Thanks Cam – will you keep up updated if you chose to ramp up equities or change the mix between US and INTL? I love the idea of INTL beating the S&P since that will add value to diversified portfolios. I have been OW US for over a year now and would like to reverse.