Preface: Explaining our market timing models
We maintain several market timing models, each with differing time horizons. The “Ultimate Market Timing Model” is a long-term market timing model based on the research outlined in our post, Building the ultimate market timing model. This model tends to generate only a handful of signals each decade.
The Trend Model is an asset allocation model which applies trend following principles based on the inputs of global stock and commodity price. This model has a shorter time horizon and tends to turn over about 4-6 times a year. In essence, it seeks to answer the question, “Is the trend in the global economy expansion (bullish) or contraction (bearish)?”
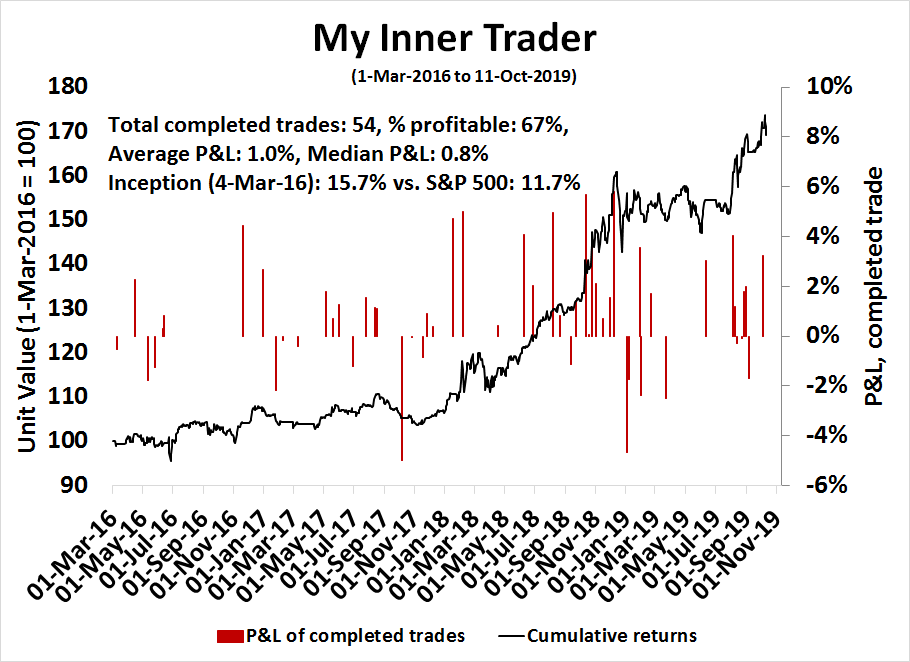
My inner trader uses a trading model, which is a blend of price momentum (is the Trend Model becoming more bullish, or bearish?) and overbought/oversold extremes (don’t buy if the trend is overbought, and vice versa). Subscribers receive real-time alerts of model changes, and a hypothetical trading record of the those email alerts are updated weekly here. The hypothetical trading record of the trading model of the real-time alerts that began in March 2016 is shown below.
The latest signals of each model are as follows:
- Ultimate market timing model: Buy equities
- Trend Model signal: Bearish
- Trading model: Bearish
Update schedule: I generally update model readings on my site on weekends and tweet mid-week observations at @humblestudent. Subscribers receive real-time alerts of trading model changes, and a hypothetical trading record of the those email alerts is shown here.
A Trend Model update
Let me start by wishing all of my Canadian friends a Happy Thanksgiving weekend.
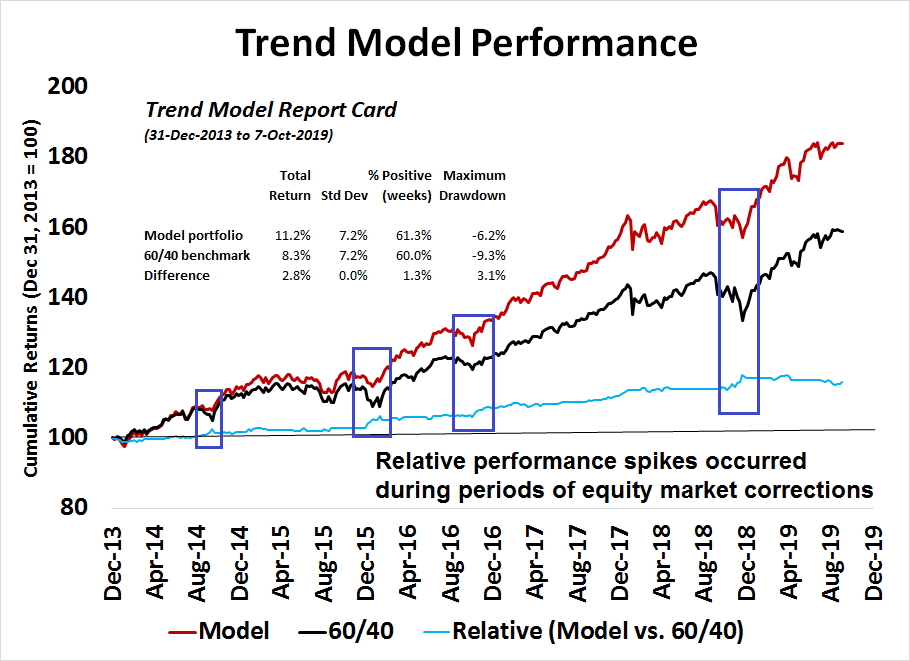
A post last week (see A 5+ year report card of our asset allocation Trend Model) brought forth a number of questions, and some new subscribers. To briefly recap that post, I have been publishing the signals of my Trend Model since 2013. A simulated portfolio which varied the equity allocation based on those out-of-sample signals significantly beat a passive 60/40 benchmark, and on a consistent basis. In particular, the simulated portfolio was able to cushion some of the drawdowns during bearish equity episodes. The study was a proof of concept that the Trend Model can add value to an asset allocation process.
This week, we answer the following questions:
- What is the basis for the Trend Model
- What is it saying now?
- How does it react to news like the US-China preliminary agreement?
I conclude that, within the framework of a disciplined investment process, the Trend Asset Allocation Model is still signaling caution, despite the short-term noise presented by the trade deal. While I am not inclined to act in anticipation of model readings, forward looking indicators are showing some signs of a possible growth turnaround. This should put a floor on stock prices because of limited macro downside risk.
Model Genesis
I came upon the idea of a Trend Model for asset allocation during my tenure as a hedge fund manager. At the time, I was running a US market-neutral equity portfolio using multi-factor techniques at a Commodity Trading Advisor (CTA).
I knew little or nothing about the CTA models, other than they used moving average techniques to trade commodities. The Director of Research explained that they use a long dated moving average to establish the direction of the trend, and a short moving average for risk control. I was curious as to why trend following models worked, but the usual answer around the firm was a shrug, “I don’t know. They just work.”
On occasion, the futures traders in the next room went home with white knuckle looks on their faces. That was because the exposure of the portfolio was all aligned together. Even though the futures portfolio was diversified across many different commodities and contracts, they wound up making one big macro bet in interest rates, currencies, gold, copper, and so on. If some important economic release the next day, such as the Jobs Report or an FOMC decision, went the wrong way, the portfolio would either soar or crater.
Here was the revelation. If we were to map the exposures of a CTA portfolio into a macro-economic factor space, what these trend following models are doing is spotting macro trends, which tend to be persistent. As an example, if an economy starts to grow, the next quarterly GDP report will tend to be related to the last quarter’s growth rate, and not some random number centered around zero. That’s trend persistence.
The investment application of CTA and trend following models is to spot the trend, take advantage of the bandwagon effect. Add in an appropriate level of risk control, an investor could add alpha.
My own Trend Model uses the same principles to derive asset allocation signals. It analyzes trends from stock prices around the world, as well as commodity prices, to determine whether the global economy is reflating or deflating. A reflationary signal is equity bullish, while a deflationary signal is bearish.
So what is the Trend Model saying now? Let’s take a trip around the world by focusing on the three main trade blocs, the US, Europe, and Asia.
The US outlook: Weak but recession unlikely
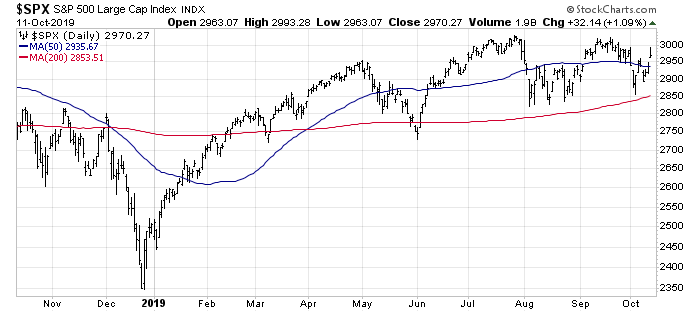
A review of the US stock market shows that it has really gone nowhere for the past six months. The index is above the 200 day moving average (dma), the long-term trend, and just regained the 50 dma, the short-term trend, late last week.
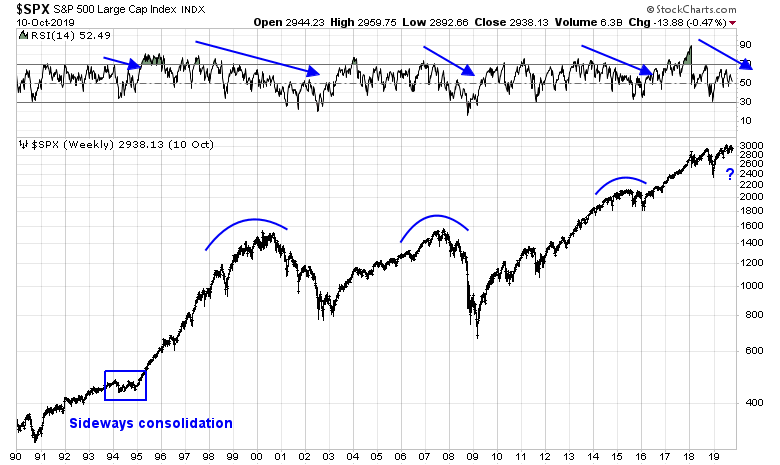
An analysis the weekly chart shows a loss of momentum, as measured by the 14-week RSI. While most episodes of falling RSI did resolve with bear markets, stock prices did consolidate sideways in 1994 and resume an upswing without a major bear market.
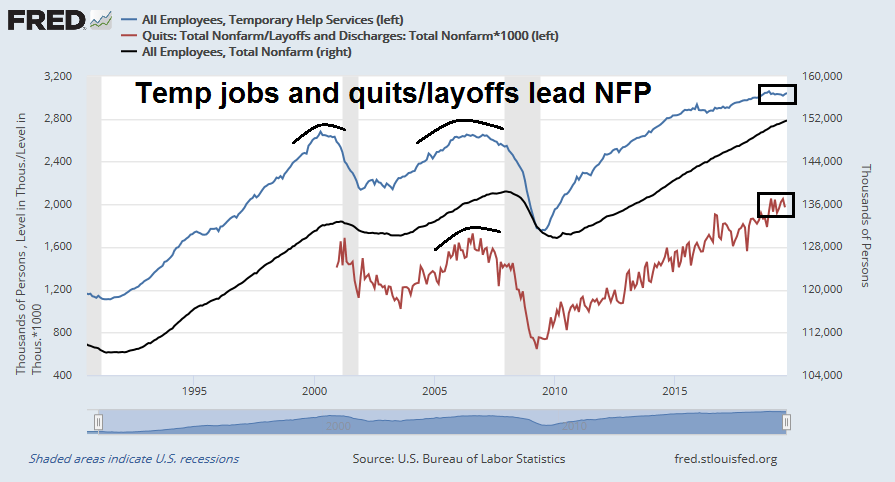
From a non-Trend Model viewpoint, sentiment has been rattled by disappointing ISM reports indicating a manufacturing slowdown. In addition, leading indicators of the labor market, such as temporary jobs and the quits to layoffs ratio, are signaling a plateauing job market.
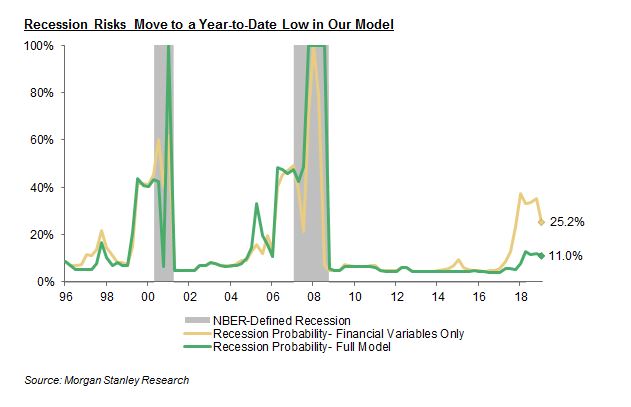
Despite the fears, a recession is unlikely, and recessions are equity bull market killers. Indeed, the latest update of the Morgan Stanley recession model shows recession odds fading.
As well, last week’s release of FOMC minutes made it clear that Fed policy makers are leaning toward another rate cut in October. The Fed stands ready to accommodate growth in the face of downside risks. Moreover, global monetary policy has been shifting to easing, and it is difficult to believe that a recession is in the near future when central bankers are in a coordinated easing mode.
Europe: So bad it’s good
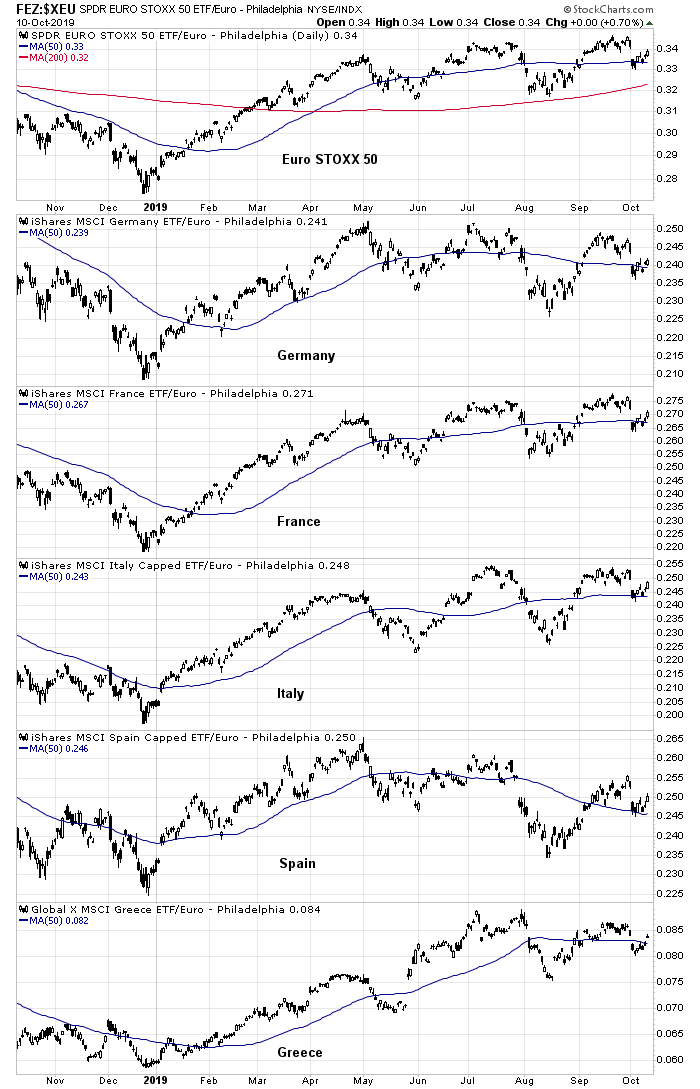
As we turn our sights across the Atlantic, the technical picture for eurozone equities is slightly better than the US. The Euro STOXX 50 is holding above its 50 and 200 dma lines. The markets of most core and peripheral countries are also mostly above their 50 dma.
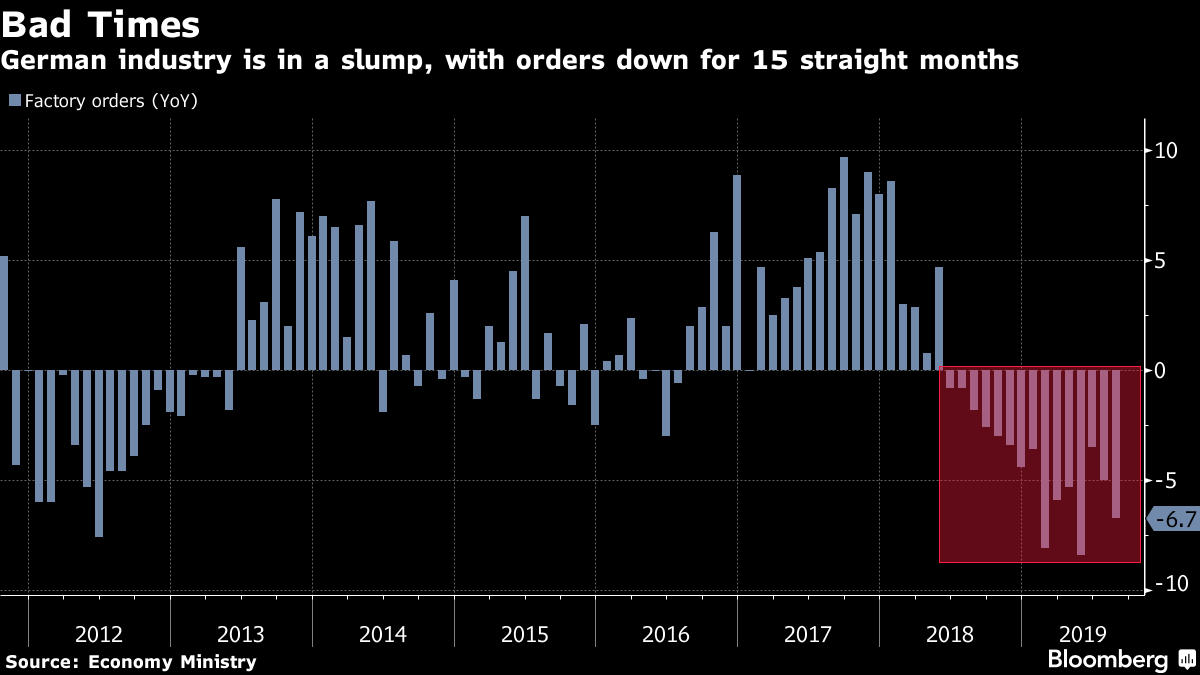
At first glance, the macro perspective appears awful. In particular, German manufacturing, which has been locomotive of growth in the eurozone, looks like an unmitigated disaster.
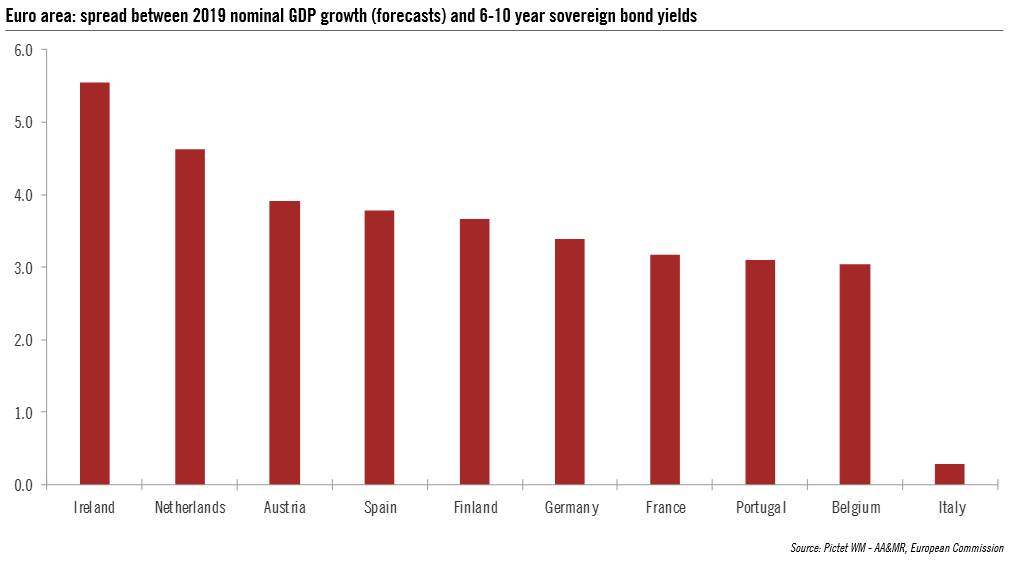
However, policy makers are starting to respond. Not only is the European Central Bank starting another round of monetary stimulus, but the political consensus is also moving towards the implementation of fiscal stimulus to boost growth. With the exception of Italy, there is significant fiscal room for stimulus among member countries.
Even the Germans, who have been the fiscal austerity hawks of the region, are starting to shift their views. In an act of European Theatre, Reuters reported that the Germans are considering a shadow budget to circumvent national debt rules:
Germany is considering setting up independent public agencies that could take on new debt to invest in the country’s flagging economy, without falling foul of strict national spending rules, three people familiar with talks about the plan told Reuters.
The creation of new investment agencies would let Germany take advantage of historically low borrowing costs to spend more on infrastructure and climate protection, over and above debt limits enshrined in the constitution, the sources said.
Germany’s debt brake allows a federal budget deficit of up to 0.35% of gross domestic product (GDP). That’s equivalent to about 12 billion euros ($13.3 billion) a year but once factors such as growth rates have been taken into account, Berlin only has the scope to increase new debt by 5 billion next year.
Europe’s largest economy is teetering on the brink of recession and pent-up demand for public investment from towns and cities across the country is estimated at 138 billion euros by state-owned development bank KfW.
Under the “shadow budget” plan being considered by government officials, new debt taken on by the public investment agencies would not be accounted for under the federal budget, said the sources, who declined to be named.
Limits on how much debt they could take on would instead be governed by the rules of the EU’s Stability and Growth Pact, giving Germany room to boost spending without needing a two-thirds majority in parliament to change its own debt rules.
Where will all the money go? The rise of the Greens in Germany might make this the “Greta Thunberg” moment that could rescue eurozone growth. Bloomberg reported that Europe’s $13 billion climate plan is about to get serious:
Call it the Greta Thunberg effect, democracy against the establishment, or simply an issue whose time has come.
Whatever it is, the pressure is ratcheting up for the European Union to finally get its act together on climate.
The incoming European Commission has made the climate emergency its No.1 priority. Angela Merkel is trying to revive her reputation as the climate chancellor in Germany. And Austria’s Green Party, once scorned as single-issue outsiders, is in pole position to join the next government after a surge in support in Sunday’s election.
“There’s a clear expansion in the political resonance of climate change, led by Europe, but more broadly by younger generations across the developed world,’’ Ian Bremmer, president of the Eurasia Group, said Monday in a note to clients. “More political and corporate leaders don’t want to be seen as failing to address the issue.’’
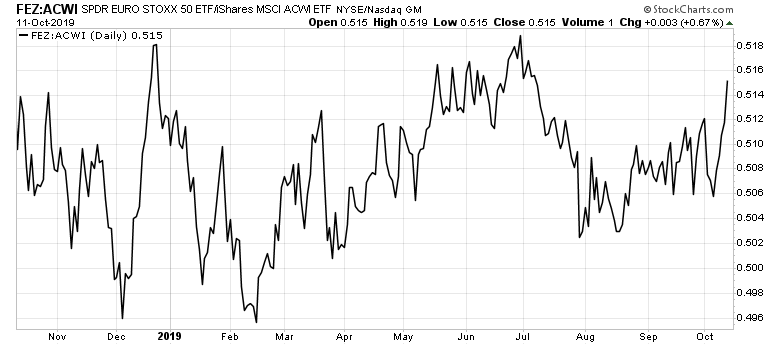
Regardless of your opinion of the spending plan, the combination of a will to spend and a way to fund the spending makes this a form of fiscal stimulus. Already, the relative performance of eurozone equities have stabilized and begun to outperform global stocks.
Asia: The Chinese elephant in the room
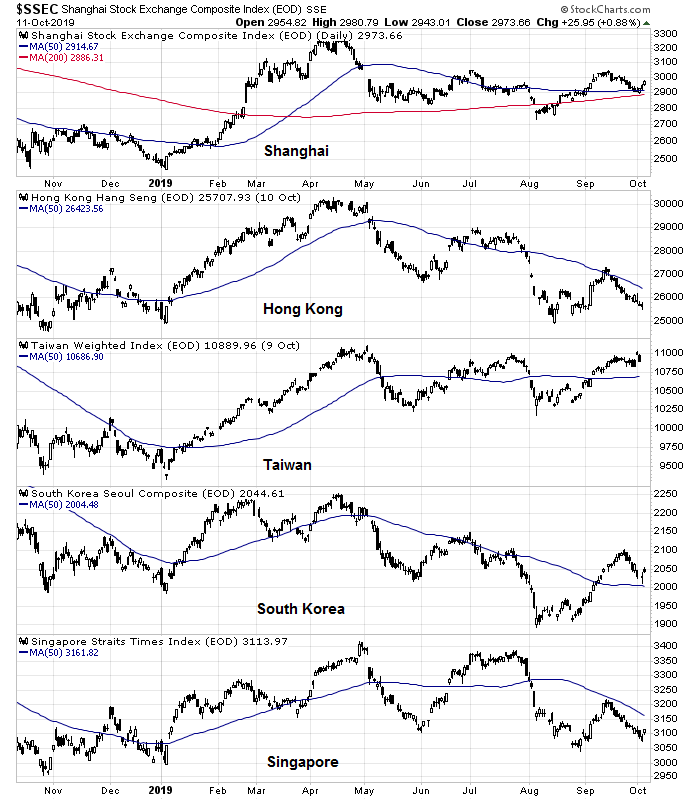
Turning to Asia, the technical picture is mixed. The elephant in the room is the risk of a major slowdown in China, sparked by the ongoing Sino-American trade war and Beijing’s efforts to deleverage its economy.
Economic statistics from China can be unreliable and made up. However, investors can see some hints of the region’s growth outlook by monitoring the stock markets of China and her major Asian trading partners. The charts of these markets present a mixed picture of indices that are flat to down. While the Shanghai Composite stands just above its 50 and 200 dma, roughly half of the other regional indices are above their 50 dma, and the other half above.
China is also the largest global consumer of commodities. Commodity prices, and the stock indices of countries that are major commodity exporters, show mostly a downbeat picture. The CRB Index trading below its 200 dma, and just barely holding above its 50 dma. Moreover, the stock indices of major commodity producing countries appear weak.
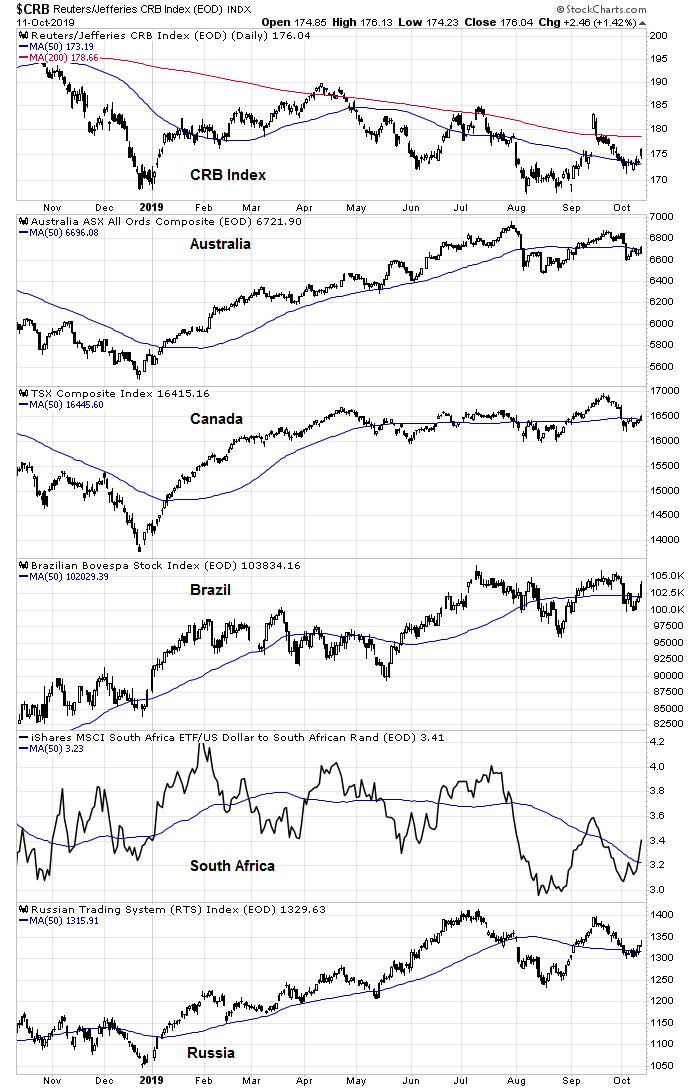
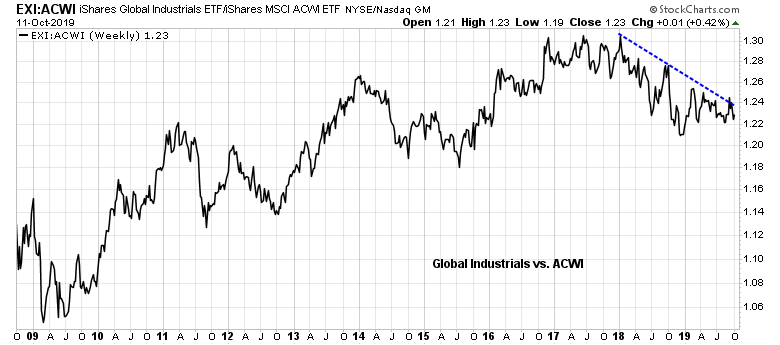
The weakness in commodity prices and the markets of commodity producing countries is confirmed by the relative downtrend exhibited by the cyclically sensitive global industrial stocks.
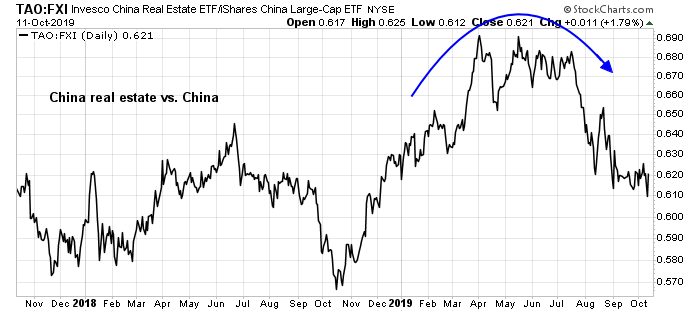
That said, the Chinese economy has been more resilient that my expectations. As real estate has been a major recipient of household savings in China, I have been monitoring the health of Chinese property development companies, which are highly leveraged, compared to the market. In the past, Beijing has resorted to credit driven stimulus to boost the economy, which has benefited the property sector. This time, Chinese authorities have refrained from opening the credit spigots. The shares of property developers have lagged the market, but few systemic risks have appeared in the financial system.
Is the trade agreement a game changer?
Tactically, the markets adopted a risk-on tone late last week on the hopes of either a mini-deal or a trade truce between the US and China. We have seen this movie before. This episode is instructive for investors managing a trend following model. What do you do in the face of breaking news that move the market?
One feature of trend following models price whipsaw that can cause excessive trading. Therefore the first rule is, “Wait for confirmation and don’t chase the news.”
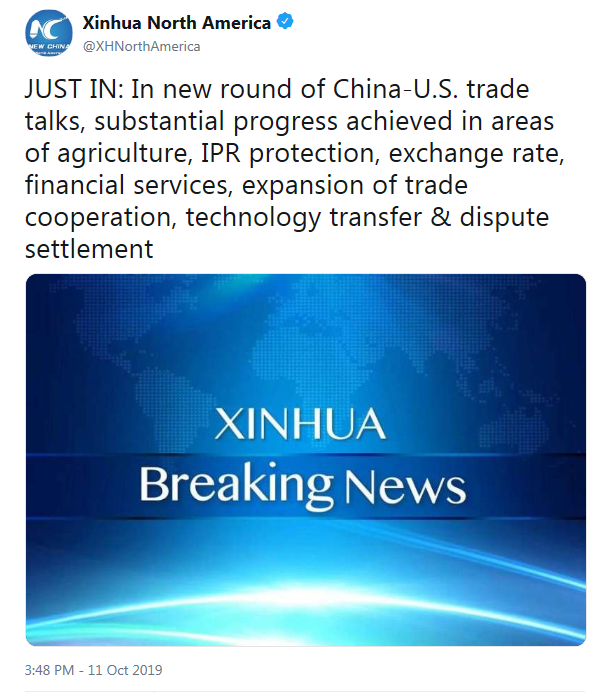
CNBC reported that American and Chinese negotiators had reached what was in essence a preliminary agreement in principle, with details to be laid out in the next three weeks. The agreement amounts to a trade truce, with a Chinese commitment to buy more agricultural products, and a delay of the tariffs scheduled for Tuesday. Most notably, the announcement was silent on the tariffs scheduled for December 15, which is an indication that Trump wants to retain that as a source of leverage.
Trump told reporters at the Oval Office that phase one of the trade deal will be written over the next three weeks. The major indexes hit their session highs on this comment, with the Dow rising more than 500 points. Trump made his comments after meeting with Chinese Vice Premier Liu He in the Oval Office.
As part of this phase, China will purchase between $40 billion and $50 billion in U.S. agricultural products. Trump also said the deal includes agreements on foreign-exchange issues with China. In exchange, the U.S. agreed to hold off on tariff hikes that were set to take effect Tuesday.
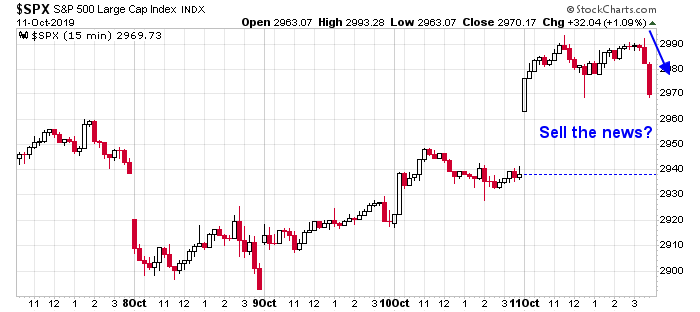
At this point, it is useful to ask a few questions. First, from a technical perspective, the short-term chart shows that the market sold off as the details of the agreement were announced. Is this a case of “buy the rumor, sell the news”?
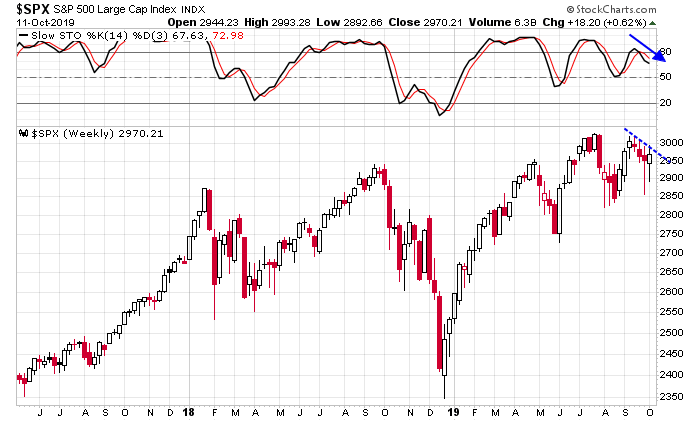
From a longer term trend follower’s perspective, the weekly chart shows the stochastics recycling from an overbought condition, which is normally interpreted as a sell signal. The index rallied but ended the week right at trend line resistance. Is the sell signal still valid, or did the news of the agreement invalidate the signal?
In order to avoid whipsaw and excessive trading, I prefer to wait for further trend confirmation next week before adopting a more bullish view on risky assets. A CNBC interview with Brookings fellow David Dollar called for caution instead of an instant knee-jerk bullish reaction:
David Dollar, a senior fellow at the Brookings Institution, warned that any deal reached by the two countries may not last. He noted there had been instances in the past when the U.S. and China appeared to have come close to reaching an agreement, only to have the tariff fight escalated all over again.
“I worry that investors look at this, they’ll be relieved tomorrow if there’s a deal but then they’re going to start asking themselves: ‘Is this really stable? Do we expect this to last for a long time? Could this perhaps fall apart in a few months?’” Dollar told CNBC’s “Squawk Box Asia” on Friday.
“It’s reasonable to worry that this might all fall apart,” he added.
That’s especially so when issues such as alleged human rights abuses in China and the Hong Kong protests have complicated negotiations between Washington and Beijing, said Dollar.
In fact, Chinese official media has not reported the discussions as a preliminary agreement, but talks with “substantial progress”. It is therefore unclear the degree of agreement today compared to May when everything blew up, and the S&P 500 was at about 2940, compared to Friday’s close of 2970.
In conclusion, a quick tour of global equity and commodity markets reveals markets that are either flat to down. By the numbers, our Trend Model calls for caution. However, forward looking indicators outside the scope of the Trend Model suggest that the global economy is likely to sidestep a recession, which would be a bull market killer.
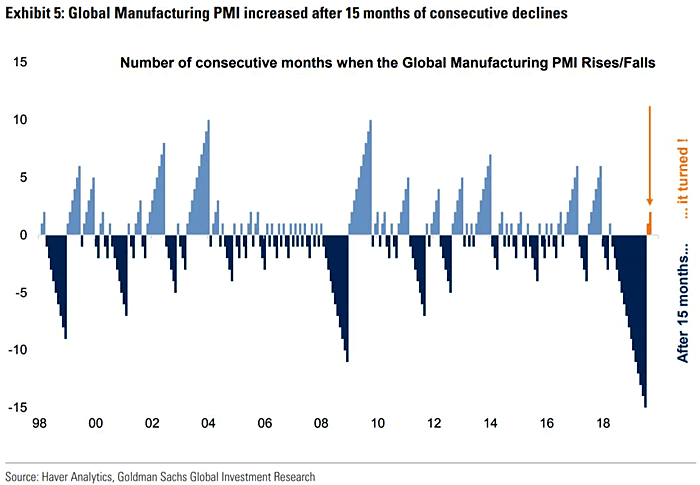
Despite the gloom in manufacturing, some green shoots are starting to appear in PMI readings. In addition, global central banks are embarking on an easing cycle, which should cushion the effects of any slowdown.
Within the framework of a disciplined investment process, the Trend Model is therefore signaling caution, despite the short-term noise presented by the trade deal. While I am not inclined to act in anticipation of model readings, forward looking indicators are showing some signs of a possible growth turnaround. This should put a floor on stock prices because of limited macro downside risk.
The week ahead
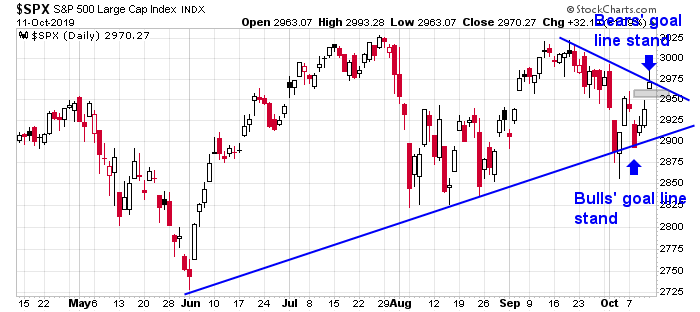
Last week was a tumultuous week for the stock market, and unusually featured goal line stands by both bulls and bears at key support and resistance trend lines.
Perhaps a weekend of sober reflection can give us more answers. In the wake of the preliminary trade agreement, the absolute and relative price of soybeans are at resistance. It is an open question of whether they can stage an upside breakout on the news.

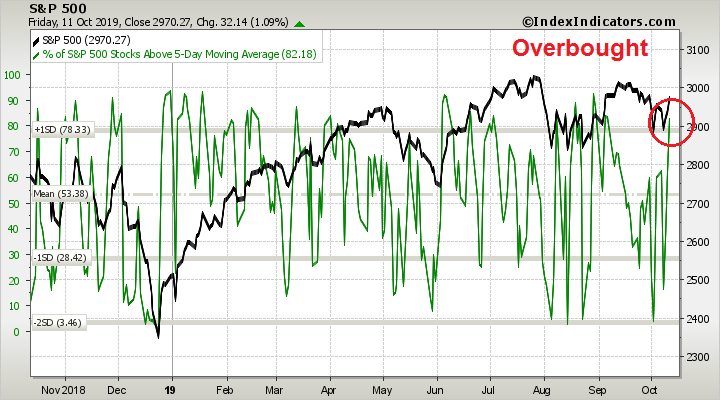
As well, short-term equity momentum is already overbought, but bullish impulses can continue rising by exhibiting a series of “good overbought” conditions. How will the market react next week?
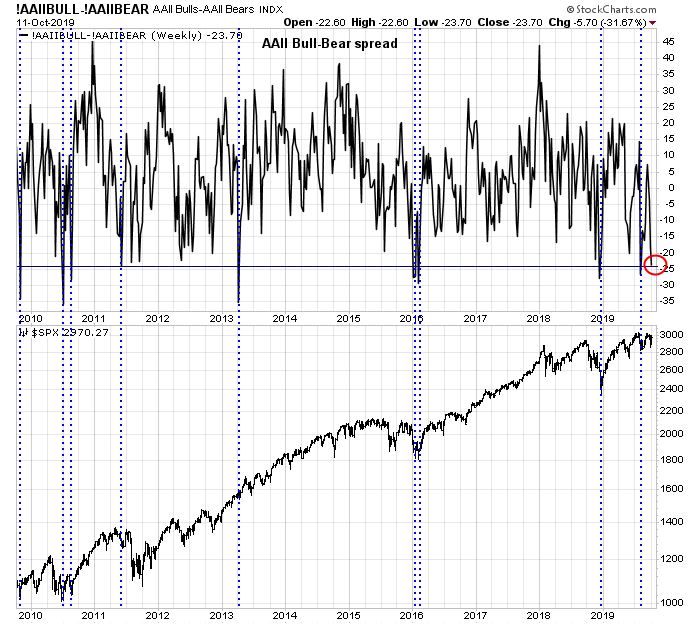
Arguably, stock prices were ready to rise. The latest AAII investor sentiment survey showed sentiment at a bearish extreme, which is contrarian bullish. The news of the agreement was just the spark for the rally.
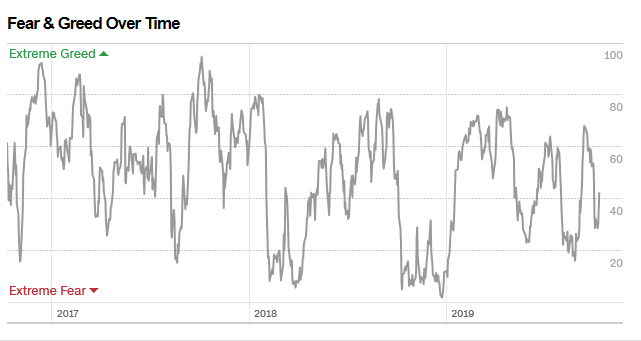
On the other hand, other sentiment indicators do not show such bearish extremes. The Fear and Greed Index recycled upwards without ever reaching panic levels in the last month.
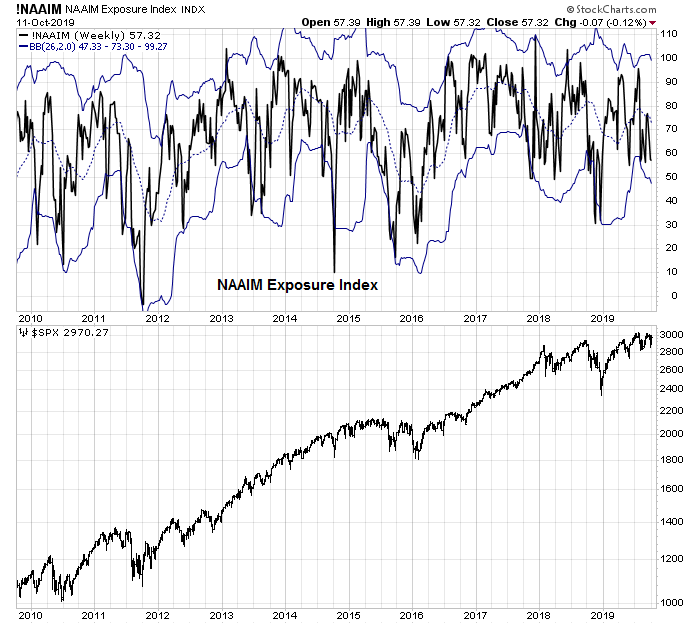
The NAAIM Exposure Index, which is a weekly survey of RIA sentiment, was also not bearish enough to flash a contrarian buy signal by falling to its lower Bollinger Band.
As well, my Trifecta Bottom Spotting Model tells a similar anomalous story. Even though the 20 dma of the put/call ratio (top panel) reached elevated levels consistent with market bottoms, the two sentiment components of the Trifecta Model did not reach levels indicating fear. VIX term structure never inverted, and TRIN never spike to 2, which is a signal of price insensitive capitulation that is the characteristic of margin clerk liquidation.

To be sure, Willie Delwiche observed that sentiment models have not performed well this year as contrarian buy signals. Historically, contrarian buy signals saw stock prices surge at an annualized rate of 29.8%, but they were up at a rate of only 3.8% this year, which is roughly the same performance as neutral sentiment signals.

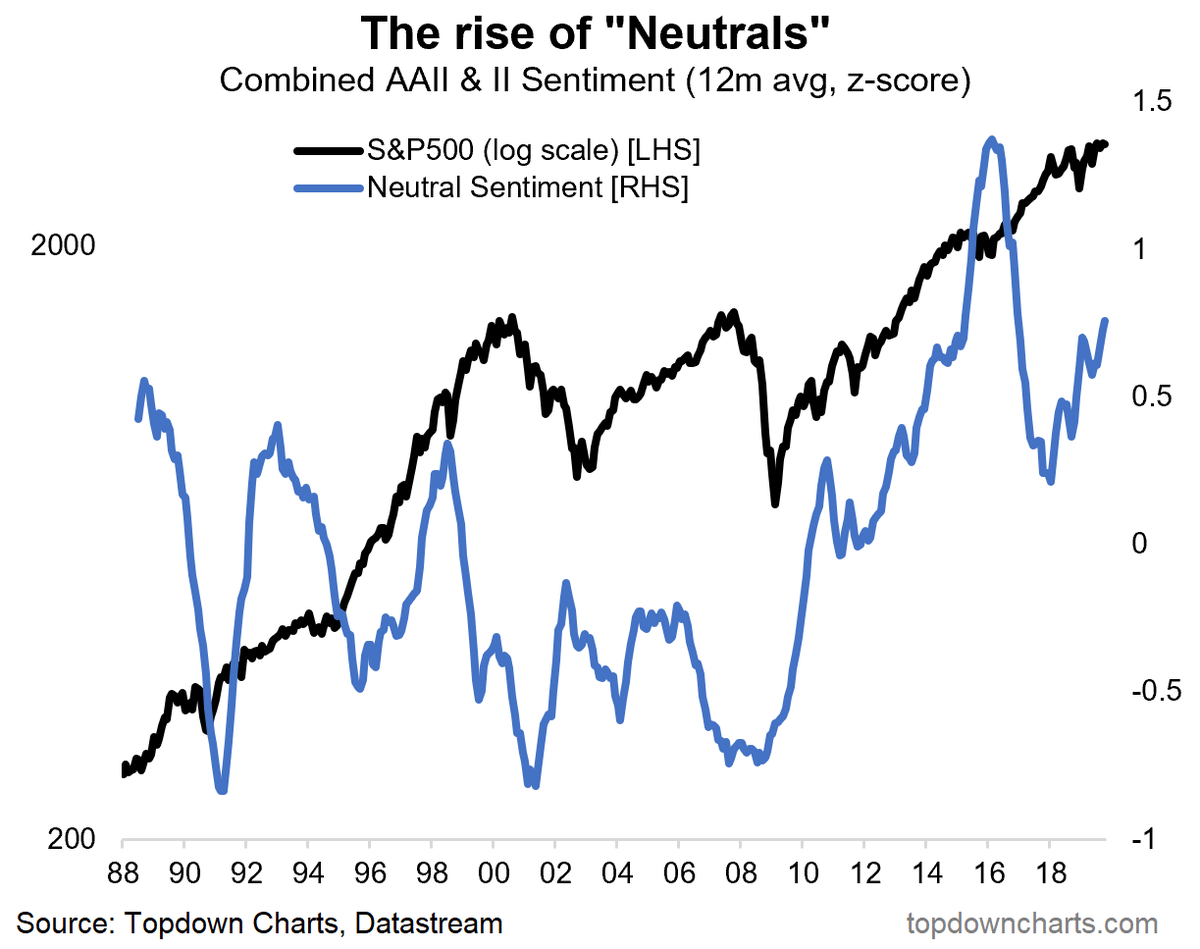
The poor short-term returns of this class of model may be explained by analysis from Callum Thomas, who pointed out that neutral responses in sentiment surveys have been rising steadily. This is attributable to general uncertainty over market direction, which could serve to create noise in sentiment models.
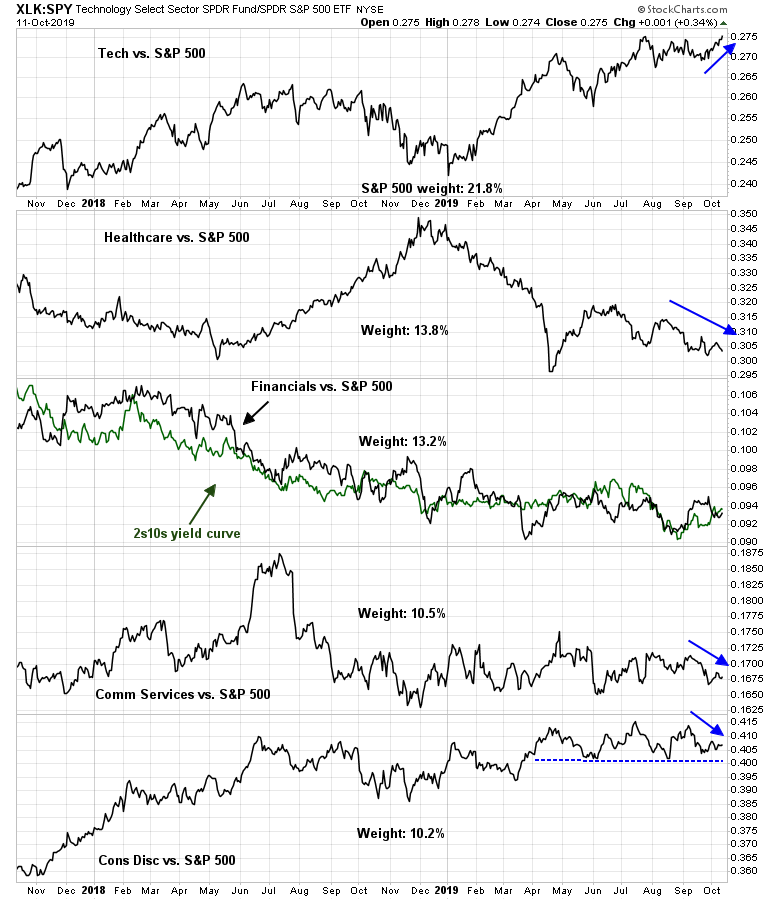
So where does that leave us? I am inclined to let the market tell us what to do next. If this were to be the start of a new bull phase, here are what the bulls will have to do. First, the top five sectors represent nearly 70% of index weight. A majority of the top five sectors will have to exhibit positive relative strength in order for the market to rise on a sustainable basis.
The monthly S&P 500 chart just flashed a MACD buy signal, which has historically been a highly reliable sign of a renewed bull move. The index has to close the month at current levels or higher.

The monthly chart of the broader Wilshire 5000 will have to confirm the MACD will have to confirm the buy signal, which it has not.

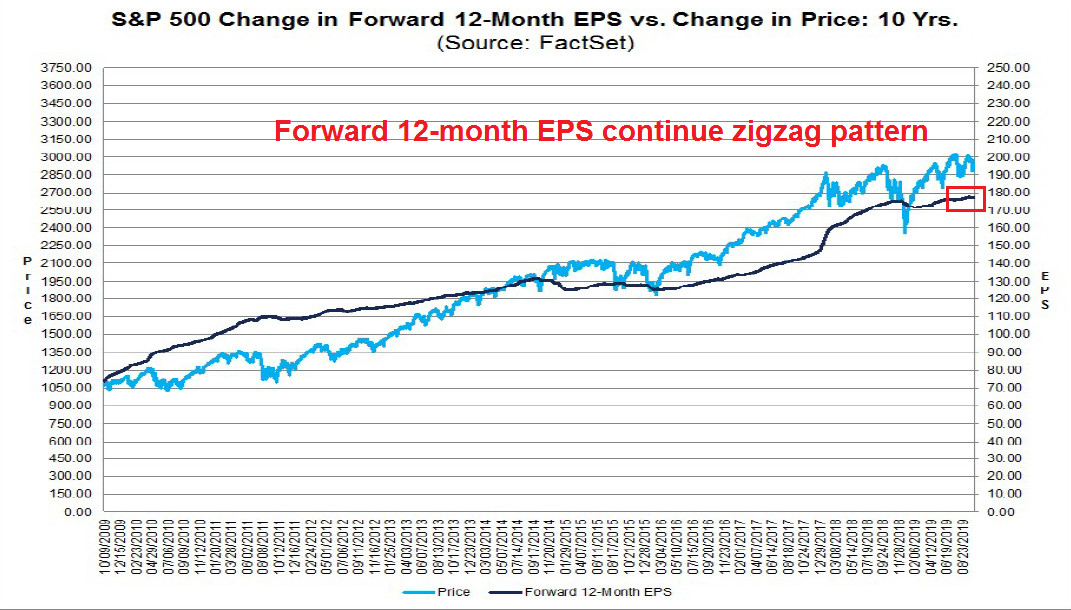
Lastly, we are about to enter Q3 earnings season, but forward 12-month EPS estimates have been mired in a flat zigzag pattern. We need to see better earnings visibility, and to see that the trade agreement will have restored some degree of business confidence.
My inner investor remains in a cautious wait-and-see mode, and he is defensively positioned with an underweight in equities. My inner trader was short going into the weekend. He is waiting for greater clarity from the market next week before making a trading decision.
Disclosure: Long SPXU