For years, I have been publishing the readings of my Trend Model on a weekly basis. As a reminder, the Trend Model is a composite model of trend following models as applied to global stock prices around the world, as well as commodity prices.
The model has three signals:
- Bullish: When there is a clear upwards, or reflationary, global trend
- Bearish: When there is a clear downwards, or deflationary, global trend
- Neutral: When the trend signals are not discernible
The first derivative of the Trend Model, i.e. whether the signal is getting stronger or weaker, and combined with some overbought/oversold indicators, has performed admirably as a high turnover trading model (see My Inner Trader and this ungated version for non-subscribers). However, I have never produced a full report card for the Trend Model. While the actual signal dates were always available on the website, I never got around to compiling the performance record because I was always tied up on other projects, and the task never got to the top of the pile.
After several repeated requests from readers, here is the report card of the Trend Model. I want to make clear that this study represents the real-time track record of actual out-of-sample signals. These are not backtested. The results were solid, and the analysis was also revealing about what an investor should expect when using this model for asset allocation.
The Study
I published model signals on a weekly basis, and the publication date was on weekends. I compiled a record of published model signals back to December 31, 2013. While there was data available before that date, model signals were not always published and therefore the study became unreliable because of the interpretative nature of reading the report.
The chart below maps the history of the signals. Buy signals are marked by vertical green lines, neutral signals by black lines, and sell signals by red lines.
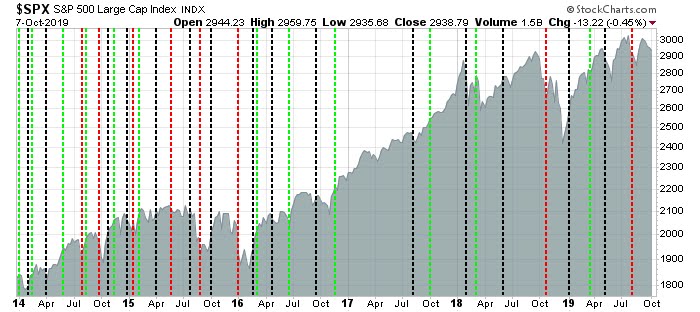
The high turnover experienced in the first couple of years was disconcerting, and it was mainly attributable to the relatively flat and trendless market of those years. But that is a feature, not a bug, of trend following models. They have a tendency to get whipsawed and do not perform well in a flat trendless market. In response, I made some minor tweaks to reduce the turnover, and to add overbought/oversold filters so that it doesn’t chase markets when they are at emotional extremes. The model has largely unchanged since mid-2015.
As the model signals were published weekly, here are some simplifying assumptions I made to measure performance.
- The vehicle used to measure returns was SPY for equities, and IEF for bonds.
- All returns are total returns, which includes dividends and distributions, and assumes reinvestment of all dividends and distributions.
- All trades are done on at the closing price on the following Monday (or Tuesday after a long weekend) after the publication of the signal.
- There are no commission costs.
How not to use the model
With those assumptions in mind, here are some ways to use and not to use the model. First, I would encourage readers not to use it as a trading model. We already have a high frequency trading model that has worked well (see My Inner Trader and this ungated version for non-subscribers).
That said, here is how the Trend Model has performed as a trading model, based on these assumptions:
- Buy SPY on a buy signal;
- Short SPY on a sell signal;
- Hold cash, on a neutral signal, and assume 0% interest on cash holdings.
How would that have performed against a simple 60/40 passive portfolio of 60% SPY and 40% IEF, which was rebalanced weekly? The chart below tells the story. While the long/short portfolio did beat the 60/40 benchmark, it exhibited a higher level of risk, as measured by standard deviation and maximum drawdown. As well, relative performance (light blue line) was highly volatile.
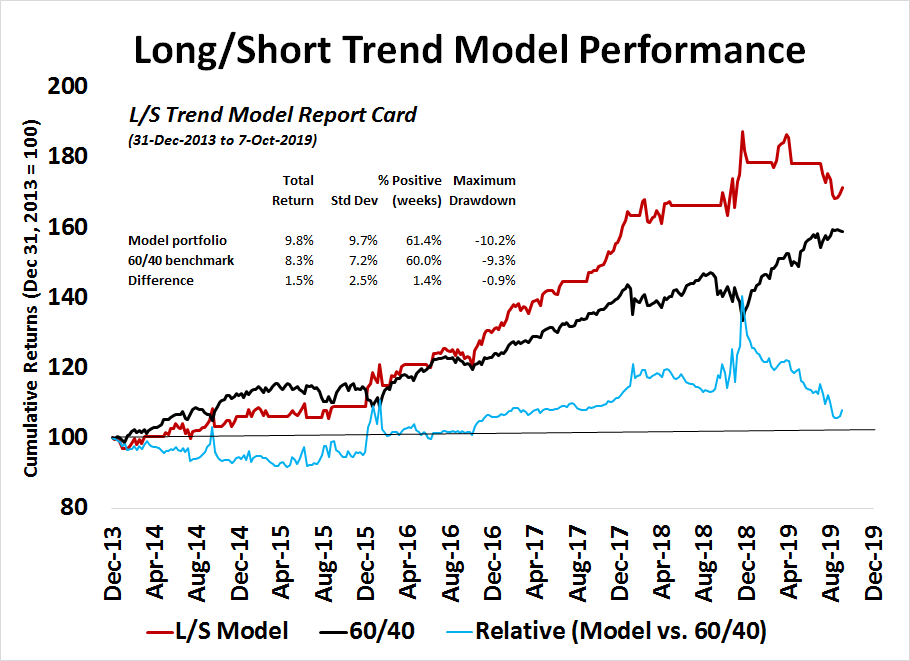
First lesson. This is not a trading model. This is an asset allocation model.
Trend Model performance
As the Trend Model is an asset allocation model, I used these assumptions to measure its performance:
- On a buy signal: Hold 80% SPY, 20% IEF
- On a neutral signal: Hold 60% SPY, 40% IEF
- On a sell signal: Hold 40% SPY, 60% IEF
Both the model portfolio and benchmarks were rebalanced to their targets on a weekly basis, though I recognize that no portfolio manager would actually trade that frequently. The chart below tells the story of performance. The returns of the Trend Model portfolio beat the benchmark over the test period of over five years. Volatility, as defined by standard deviation, of the two portfolios were the same, but the maximum drawdown of the Trend Model portfolio was 3.1% better than the 60/40 benchmark.
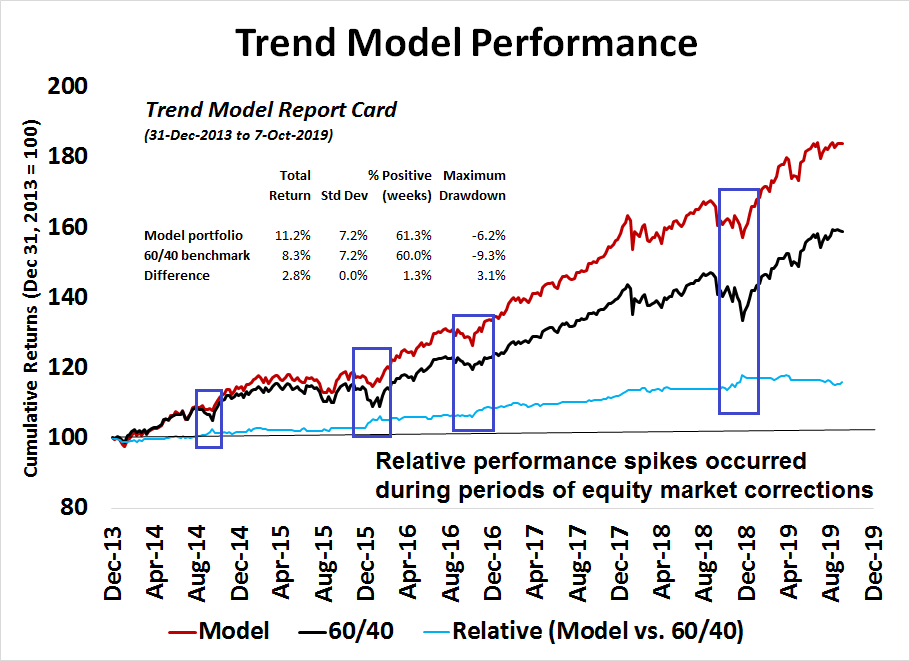
Further analysis of the relative performance line (light blue) reveals the difference. While the trend of outperformance was relatively steady and upward sloping over the test period of over five years, there were several spikes in relative returns. These spikes tended to occur during periods of equity market corrections. Simply put, the Trend Model was able to offer better downside protection during bear phases, and maintain relative performance during bull and neutral phases of the equity market.
This test of the Trend Model was based on a set of reasonable assumptions. In particular, the allocation was based on a +/- 20% band around a classic 60/40 balanced portfolio. that can be easily implemented by investors, and by portfolio managers while adhering to the typical risk tolerance monitoring regimes of their firm’s Compliance Department.
This study was a proof of concept that the Trend Model can form an invaluable way of enhancing returns to a portfolio while reducing realized downside risk. As each investor will have different choices of investment vehicles, and differing benchmarks, your mileage will obviously vary.
I will be updating the track record of this model on a monthly basis at Trend Model report card.
Cam, as you stated in your analysis above, “benchmarks were rebalanced to there targets on a weekly basis.” Of course you are right in assuming no manager could transact that frequently. So , from a more practical stand point, how much different would your numbers be if you just held the allocations until you got a trend model signal change, ie from buy 80/20 to neutral 60/40 or so forth.
Thanks
Thanks
Thanks
In practice, probably not very much.
IMHO, the bigger variation would be the choice of investment vehicles.
Yes, that is the key! Trying to break down the equity allocation into factors, sectors, and the like is challenging now. That’s why its always nice to see your opinion in that regard every now and then. I look forward to it.
Thanks
Cam – How does this breakdown into granular entry points into your model? Can you show the results with 1yr / 6mos / 3mos rolling entry points? … Thanks. Looks like great results.
I don’t understand your question.
You are showing performance from the beginning of 5 years. How does the performance look if you were to use your trend model starting 4 years ago, 3 years ago, 2 years ago or 1 year ago, to date? …. Different entry points into the same methodology.
Last 1 year total returns
Model 10.8%
60/40 8.9%
2 years
Model 10.9%
60/40 8.3%
3 years
Model 12.3%
60/40 9.2%
4 years
Model 14.2%
60/40 10.4%
The persistent upward slope in the thin blue line (as well as the consistent angle at which it rises) tells the same story.
What catches my attention is how badly the L/S model performs when making buy/sell decisions based solely on trend signals.
The performance of the long/short portfolio tells me that these trend following models are better at identifying overall risk levels, but they are not great at specific entry/exit tactical trading.
The trading model does a better job, but it also underperforms a simple long only S&P 500 when stock prices go straight up. Market timing only works when prices pause and go down. Conceptually think of a timing model as long market/long married put. The put option will always have a cost.
Thanks, Cam!