Mid-week market update: There is a trader’s adage, “Sell Rosh Hashanah, Buy Yom Kippur”. As many in the Wall Street community are Jewish, staying out of the stock market during the Jewish high holidays may make some sense. Jewish traders and investors wind down at rosh Hashanah, the Jewish New Year, and return after Yom Kippur, the Day of Atonement, which is today.
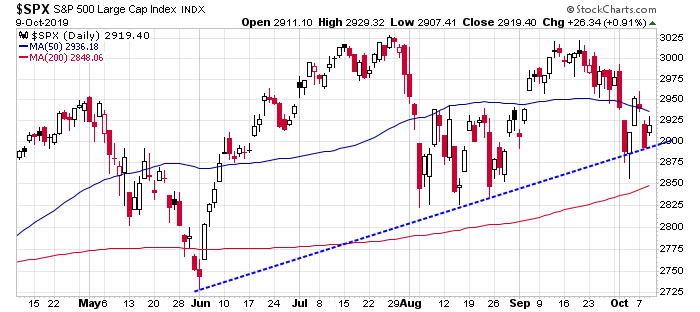
Indeed, this year’s market weakness began just around Rosh Hashanah. Moreover, the market’s decline was halted yesterday right at trend line support, and rallied today.
Is it time to buy Yom Kippur.
An orderly decline
Here is what’s bothering me about the “Sell Rosh, Buy Yom” narrative. The market has been undergoing an orderly decline. As a consequence, neither market internals nor sentiment has reached panic washout levels consistent with durable bottoms.
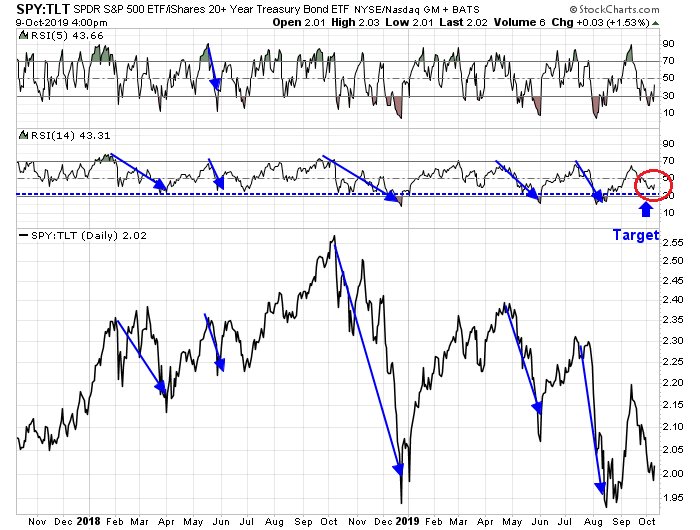
Here are just a few examples. The SPY/TLT ratio, which is a measure of risk appetite, has been falling, but it has not reached levels seen at past bottoms.
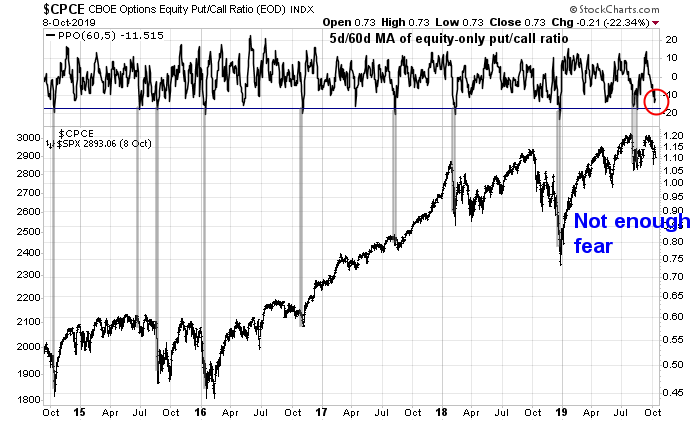
From a sentiment perspective, the ratio of the 5 day moving average (dma) of the equity-only put/call ratio (CPCE) to the 60 dma is also depressed, but it is just short of levels indicative of panic and capitulation.
My own Trifecta Market Bottom Spotting Model is also nowhere near conditions indicating a high level of fear.

What I am watching
Here are some key questions for the market. The SPX is caught between a falling trend line with a high from September 19, and a rising trend line with the low from June 3. Which will break first?
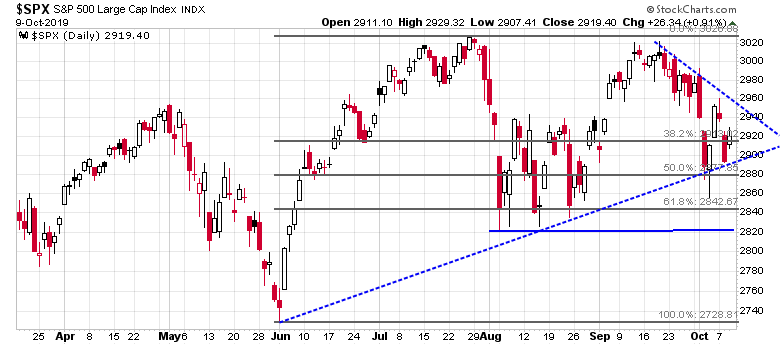
My interpretations of market sentiment and internals lead to a bearish tilt. If I am right, where will the pullback end? Arguably, it could stop at about 2880, or the 50% retracement. If the support from September breaks, the next level of Fibonacci retracement, or roughly in the area of the August lows, or possibly the intra-day August lows at 2820.
Here is what I am watching. The Value Line Geometric Index, which is an equal weighted and broadly based index of stocks, is very weak, and it is weaker than most of the major market indices. Will it break support shown in the chart shown below? As well, will other breadth indicators, such as % above 50 dma and % above 200 dma, break the support lines drawn?

Watch the internals as they test support. If support were to break, it would signal a deeper correction.
My inner investor is defensively positioned. My inner trader initiated a small short position on Monday, with the idea that he would average in over the coming days. But he pulled back from his dollar averaging program with Tuesday’s decline. Your own mileage may vary, and it depends on your risk appetite.
Disclosure: SPXU
‘BREAKING: Futures sharply drop 215 points after Chinese media reports that China and US have made no progress in two days of deputy-level trade talks’
http://CNBC.com/id/106173274
https://www.scmp.com/news/china/diplomacy/article/3032261/us-and-china-make-no-progress-key-trade-issues-two-days-deputy
I had a thought that making a show of going home mad would be a strong possibility.
You may be right. The hit to futures thus far is quite tame. It may come down to a few back room conversations and back to the table/ DJIA +600 in the morning.
Easy come, easy go.
If China leaves Thursday without a deal, I would expect a -5% reaction.
They are scheduled to leave Friday. And there was never going to be a deal emerging from this round. The best we can hope for is a ceasefire where the US delays the implementation of the next round of tariffs and China buys more agricultural goods.
The deadline for China trade deal is next year November. At some point, DJT has to declare victory, well before next years elections. The China trade skirmish by some metrics is already in the rear view, as news on this front is not making any durable dent in the market. Let us start to focus on Brexit and possible impeachment as emerging grey swans. Futures pulled back last night as rxchen2 says and rallied hard as traders bought the dip. This morning, futures are in the green. 6-15 AM EST.
I think that when it comes to indicators signaling a significant bottom that what needs to be kept in mind is that just because they have not done so would mean only that a bottom has not occurred. This does not mean that a bottom is due, only that it is not now…the market could go up to 3100 S&P….the value of the signal is when it happens, not when it is kinda close…kinda close may be it for that move.
Anyways, expect interesting stuff in the next day or so.
What does Trump want more? Lower rates or some soso arrangement with China? If the trade talks stall again, well who will be surprised? But if the market tanks, will this apply more pressure on the Fed?…What would Trump gain from a deal 1 year before elections when Dems have a year to find problems with the deal.
Speculation on my part, but I put my money on no deal, let’s go for lower rates….but they will move the markets how they wish…otherwise how can bad news ever really be good news?
Yeah, I know I’m answering my own post. Just to add…anyone who has had major relationship issues that drag on for a year without getting off the fence, usually stays undecided until some crisis comes along. Where is the crisis? Just another reason to expect no major breakthrough. But will they try to polish the turd and sell it to us as something of value?
We’ll find out this afternoon whether a deal is in place, and whether it’s a meaningful agreement.
The reaction could go either way – disappointment in the details, or a material change in trade relations with real economic benefits. Traders are betting on the latter. One rule I have is never to chase – sure, it occasionally works, but remaining patient and allowing prices to come to you results in a better P/L over time. If global markets embark on a new uptrend – there’s plenty of time to allocate accordingly.
I think traders see a mini-deal increasing the odds of a bigger deal later in the year.
What’s your take, Cam – Is the mini-deal enough of a game-changer to push the trading model from neutral to bullish?
Or maybe from neutral to bearish.
LOL The $64,000 question. Sell the news or buy the news?
Let’s see if “the deal” lasts a week and a weekend, and if there’s any follow through in the market.
Rich Dvorak
@RichDvorakFX
Summary of US-China ‘Phase 1’ Trade Agreement:
-Oct 15 tariff hike delayed
-Dec tariff hike still on the table
-Evaluate FX manipulator label, review blacklist
-Huawei separate process for later talks
-Enforcement being worked out
-Deal yet to be put into writing
Basically, they’re still talking. There’s no deal, and unless I’m missing something there are no meaningful agreement(s) on anything.
So today’s reaction was a relief rally – investors were relieved to see both parties back at the table.
Mark Hulbert/ Oct 9
https://www.marketwatch.com/story/why-oct-9-is-a-day-that-lives-in-infamy-among-stock-investors-2019-10-09
‘Consider the average recommended equity exposure level among a subset of short-term stock market timers I monitor who focus on the Nasdaq market (as measured by the Hulbert NASDAQ Newsletter Sentiment Index, or HNNSI). This average currently stands at minus 55.9%, which means that the average Nasdaq-oriented market timer is allocating more than half his equity trading portfolio to going short.
‘That’s an aggressive bet that the market is headed lower.
‘This bet is extraordinary for a market so close to its all-time high, since the usual pattern is for sentiment exposure levels to rise and fall more or less in lockstep with the overall market. In December, the last time the HNNSI was as low as it is today, the Nasdaq was nearly 1,500 points lower.
‘Contrarians view as positive this disconnect between the market’s level and the market timers’ gloom. To be sure, as I reported last week, some other sentiment measures aren’t indicating as much bearishness as currently seen among Nasdaq timers. But in recent days those other measures have also begun to point toward more gloom among the market gurus.
‘This suggests that a significant “wall of worry” is being built, which from a contrarian is bullish for the near term. At a minimum, therefore, today is unlikely to be the beginning of a major leg down in the stock market.’
Of course, Hulbert posted the article below just five calendar days earlier, on October 4-
https://www.marketwatch.com/story/heres-one-more-reason-why-october-is-looking-muddy-for-us-stocks-2019-10-04
‘Consider the average recommended equity exposure level among these short-term timers (as measured by the Hulbert Stock Newsletter Sentiment Index, or HSNSI). This average currently stands at 23.2%, which is five percentage points above where the index stood at the beginning of September — when the Dow was higher than where it stands now.
‘Since the normal pattern is for bullishness to rise and fall more or less in lockstep with the market, the market timers’ relative bullishness is an ominous contrarian sign.
‘How far must the HSNSI fall before contrarians will conclude that the market is at a low-risk entry point for a short-term trade? Preferably into negative territory, which exists whenever the average short-term timer is highly bearish and recommending that clients short the market. At its low at the end of 2018, for example, the HSNSI fell to minus 21.7%. From that low, the Dow turned in a four-month rally of some 22%.’