Last week, I discussed the professional career risk challenges in this market (see What professional career risk looks like).
During these unusual periods of severe bifurcation between valuation and macro risk and price momentum, the investment professional is forced to make a decision based on what he believes the dominant investment regime will be in order to minimize career and business risk. This amounts to the classic Keynesian investing beauty contest, where investors do not try to determine the winner based on some investment criteria, but based on what he believes other investors think will be the winner.
I highlighted the differences in thinking between the fast-moving hedge fund manager, Stanley Druckenmiller, and the cautious approach of Jeremy Grantham, whose firm, GMO, reduced its target equity weight from 55% to 25%.
This week, it seems that even Grantham has capitulated and called this market a bubble in a CNBC interview.
“My confidence is rising quite rapidly that this is the fourth ‘Real McCoys’ bubble of my investment career,” Grantham, co-founder of GMO, told CNBC’s Wilfred Frost on Wednesday in an interview which aired on “Closing Bell.” “The great bubbles can go on for a long time and inflict a lot of pain.”
The previous three bubbles Grantham referred to were Japan in 1989, the tech bubble in 2000 and the housing crisis of 2008.
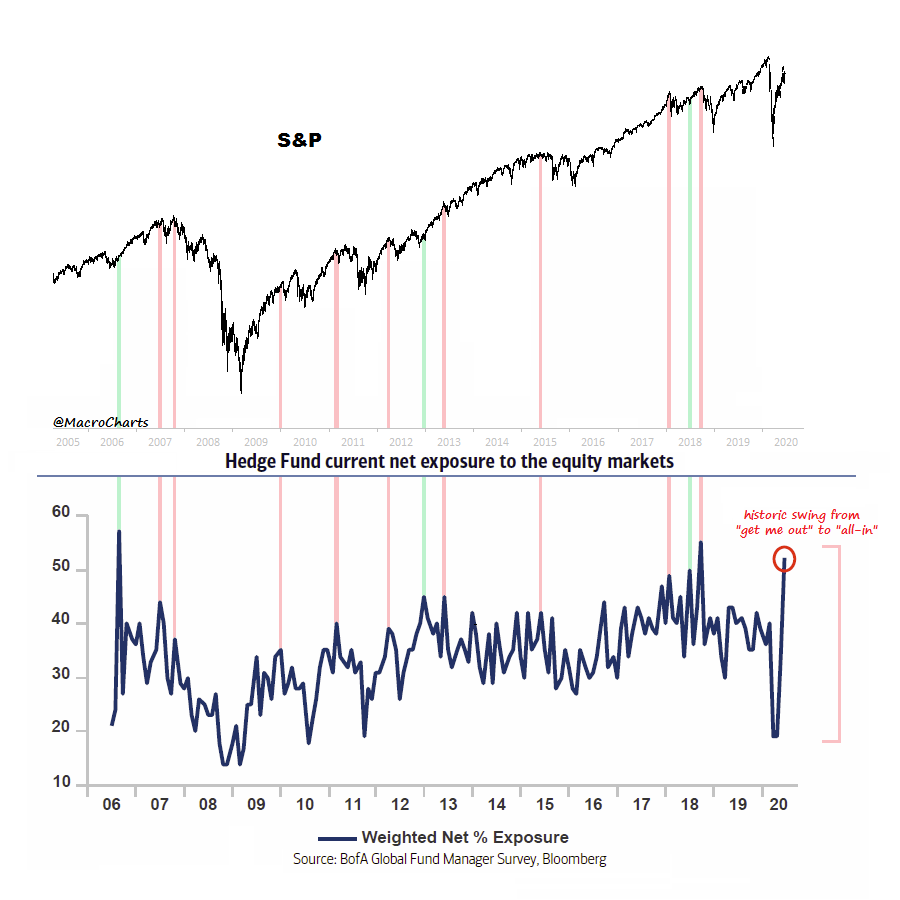
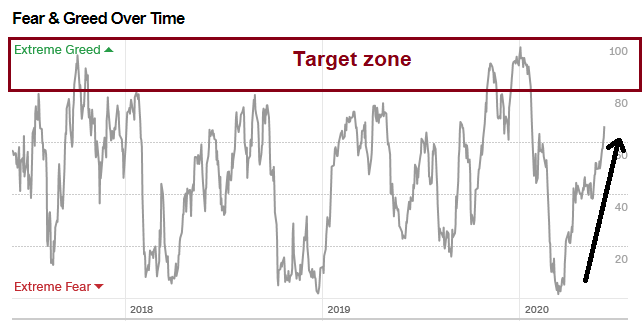
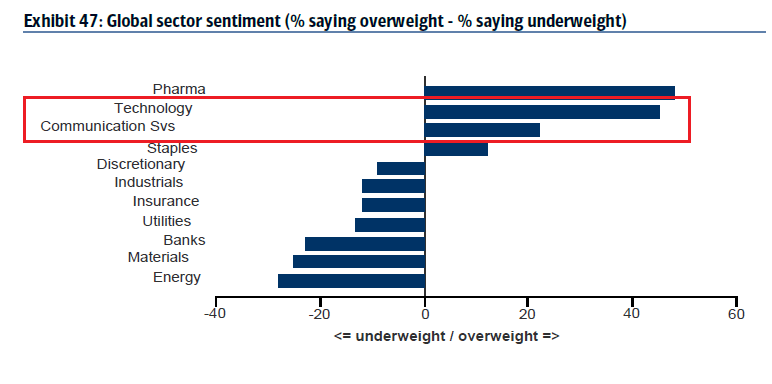
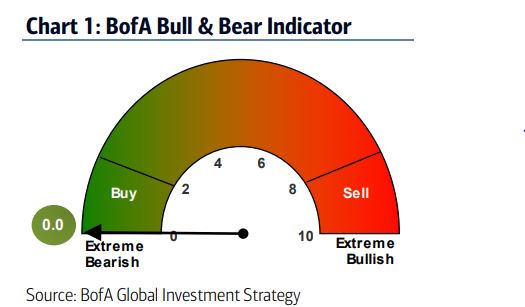
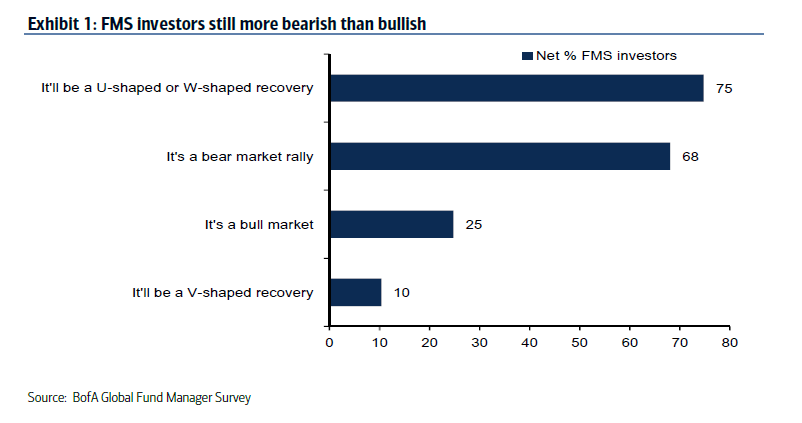
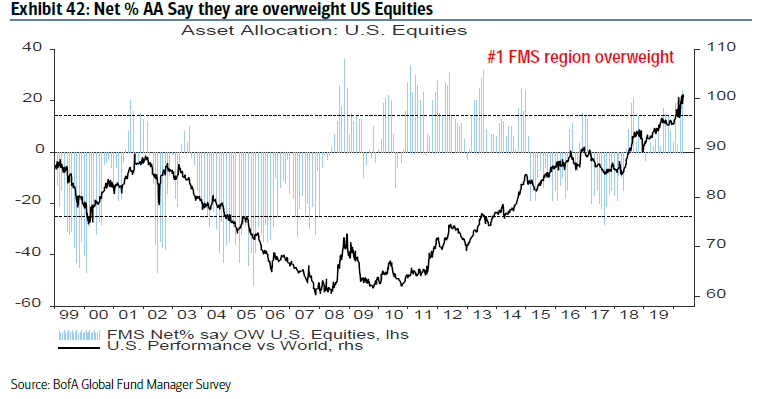
Not only has Jeremy Grantham capitulated and called this market a bubble, but also the latest BoA Global Fund Manager Survey shows signs of capitulation by cautious bears. Even though a record net 78% of survey respondents acknowledged that equities are overvalued, which is the highest reading since the survey began in 1998, their investment outlooks turned less bearish between the May and June survey.

As global stock prices continue to grind upward, managers are giving greater weight to their career risk, and reluctantly turning bullish. The bears are capitulating. How should investors approach this market?
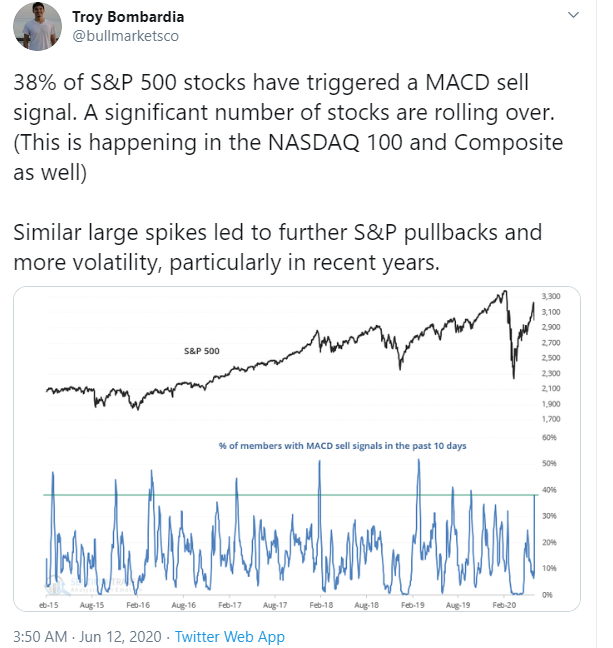
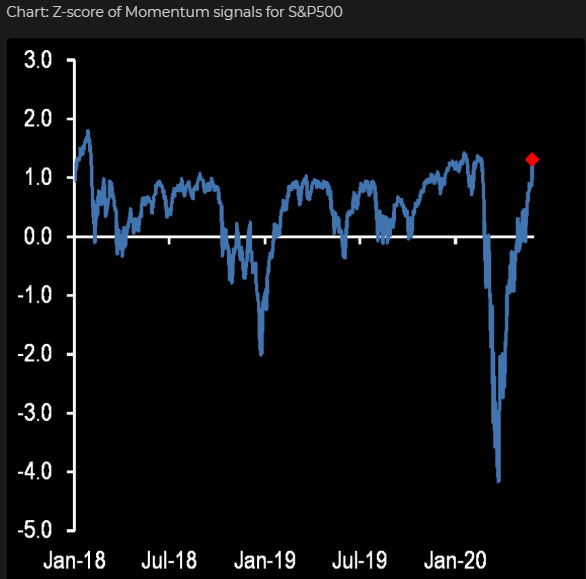
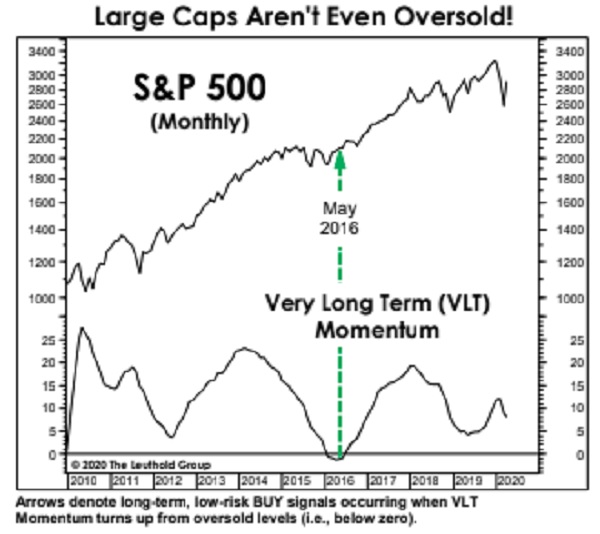
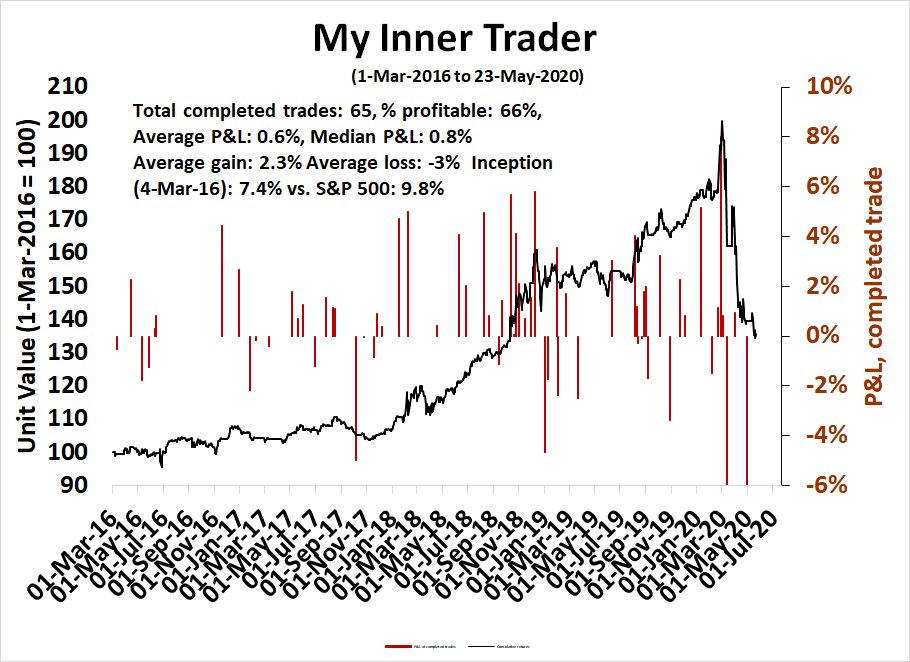
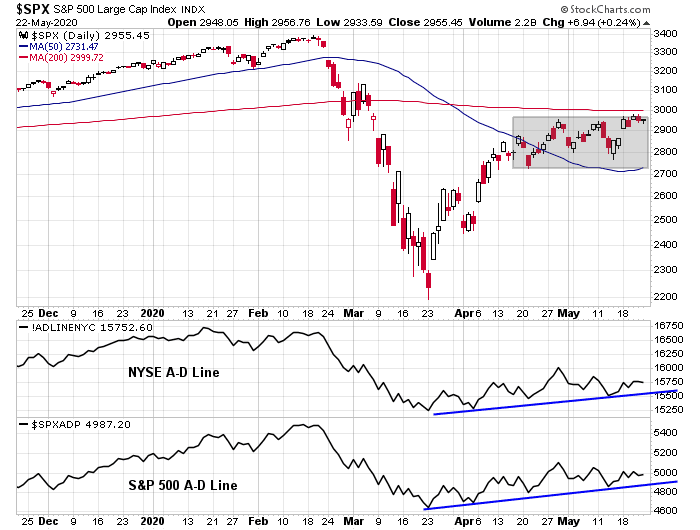
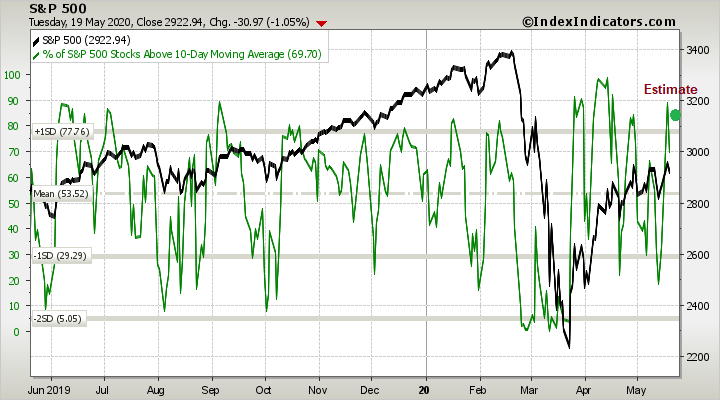
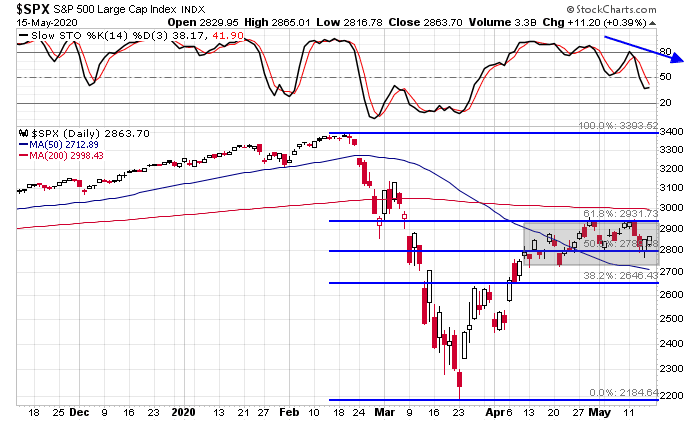
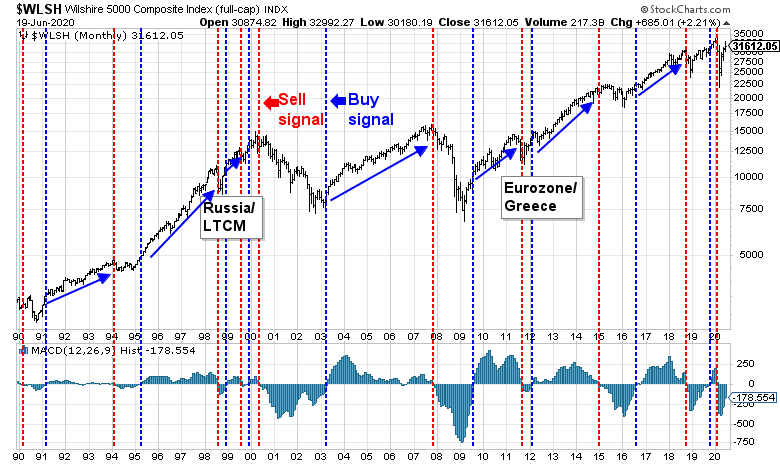
I am not prepared to call the current market environment the start of a bubble just yet. Technical price momentum indicators are insufficiently bullish to declare this a new mania. Our bubble trigger is the monthly MACD indicator. Until the monthly MACD histogram turns positive, our inclination is to still call this a bear market rally.
If I am wrong and this is a new bubble, we may need a second aftershock of rising insolvencies and white-collar layoffs for investor psychology to change.
Fundamental and macro backdrop
Let’s begin with the fundamental and macro backdrop of the market. Federal Reserve Jerome Powell’s Senate testimony last week tells us everything we need to know about the economic outlook.
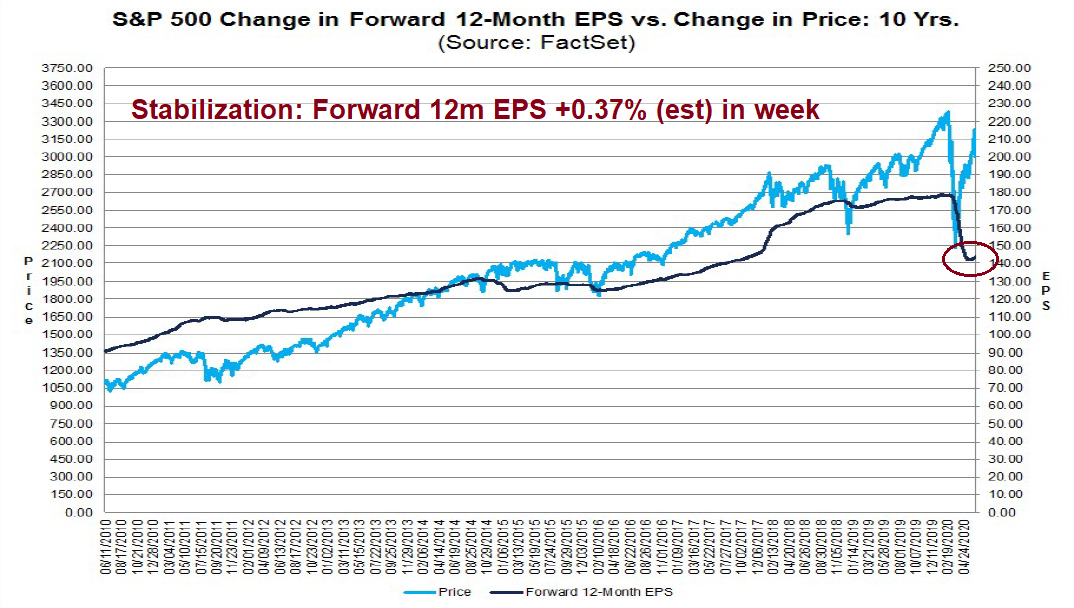
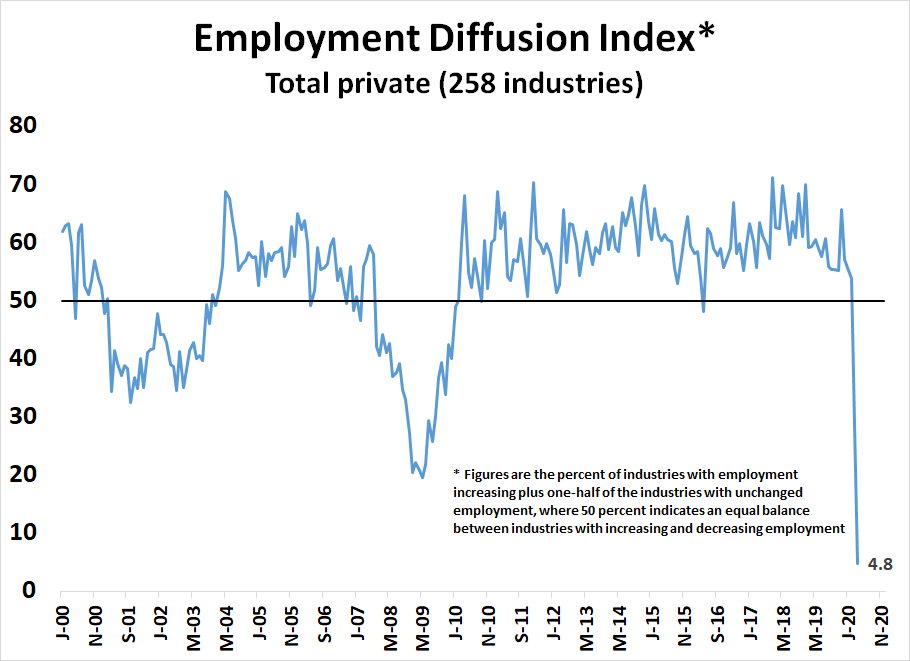
Recently, some indicators have pointed to a stabilization, and in some areas a modest rebound, in economic activity. With an easing of restrictions on mobility and commerce and the extension of federal loans and grants, some businesses are opening up, while stimulus checks and unemployment benefits are supporting household incomes and spending. As a result, employment moved higher in May. That said, the levels of output and employment remain far below their pre-pandemic levels, and significant uncertainty remains about the timing and strength of the recovery. Much of that economic uncertainty comes from uncertainty about the path of the disease and the effects of measures to contain it. Until the public is confident that the disease is contained, a full recovery is unlikely.
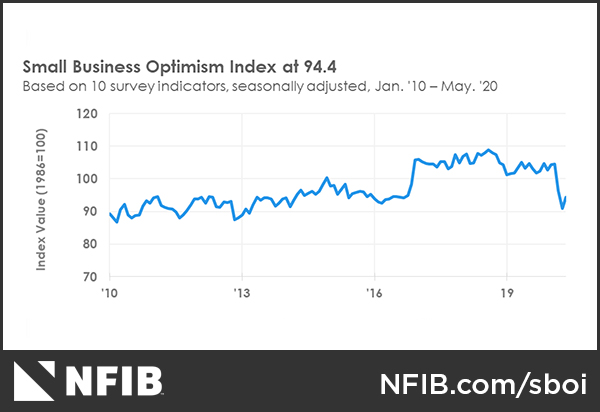
Moreover, the longer the downturn lasts, the greater the potential for longer-term damage from permanent job loss and business closures. Long periods of unemployment can erode workers’ skills and hurt their future job prospects. Persistent unemployment can also negate the gains made by many disadvantaged Americans during the long expansion and described to us at our Fed Listens events. The pandemic is presenting acute risks to small businesses, as discussed in the Monetary Policy Report. If a small or medium-sized business becomes insolvent because the economy recovers too slowly, we lose more than just that business. These businesses are the heart of our economy and often embody the work of generations.
Here are the main takeaways from his testimony:
- There are signs of stabilization, but
- Economic activity levels are far below pre-pandemic levels.
- Much depends on the trajectory of the pandemic, and efforts to control the disease.
- The longer the downturn, the bigger the risk of permanent damage.
- Low-income Americans, and small and medium sized businesses are especially vulnerable in a prolonged slowdown.
To put the current recession into some perspective, a World Bank report pointed out that this is the four global recession as measured by per capita GDP growth since 1876, exceeded only by the Great Depression, and slowdowns sparked by two World Wars, and it is worse than double-dip of 1917-1921, which was exacerbated by the Spanish Flu.
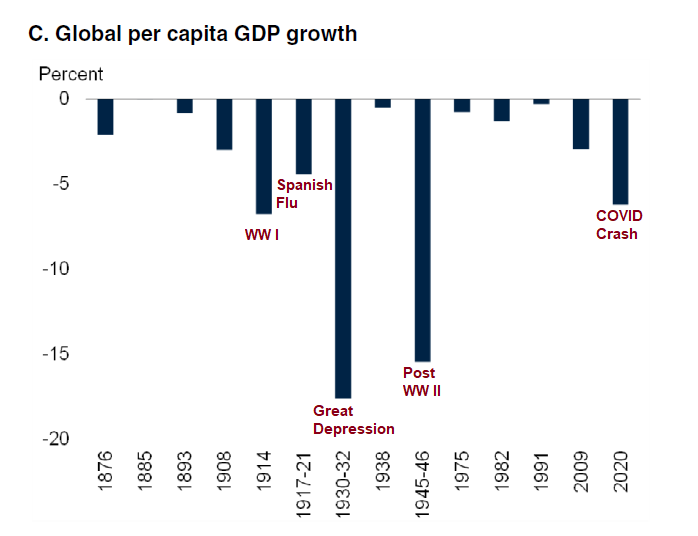
In terms of sheer global breadth, this is the worse recession ever.

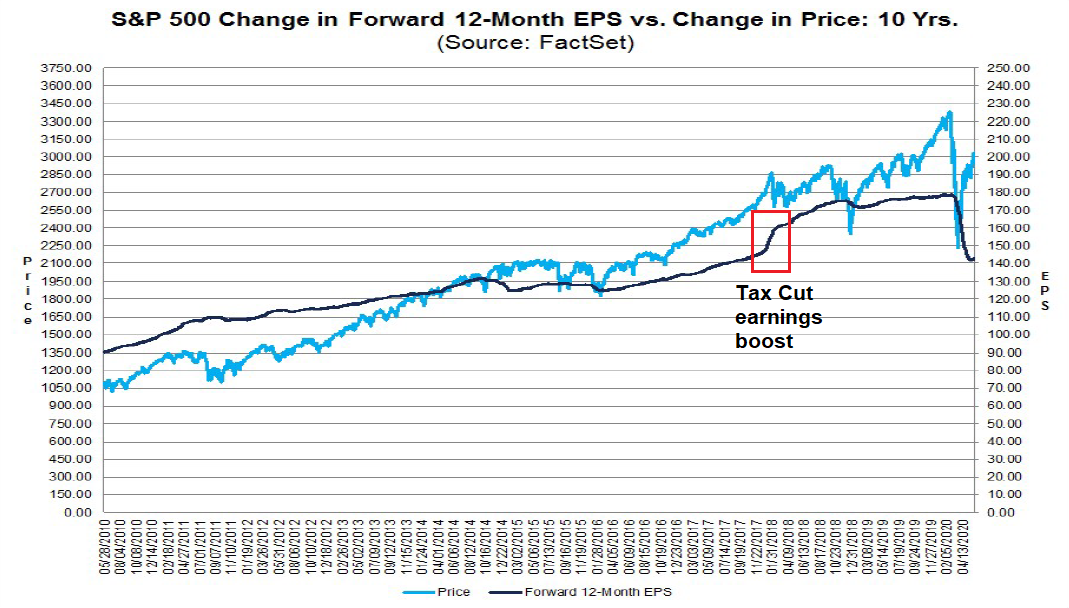
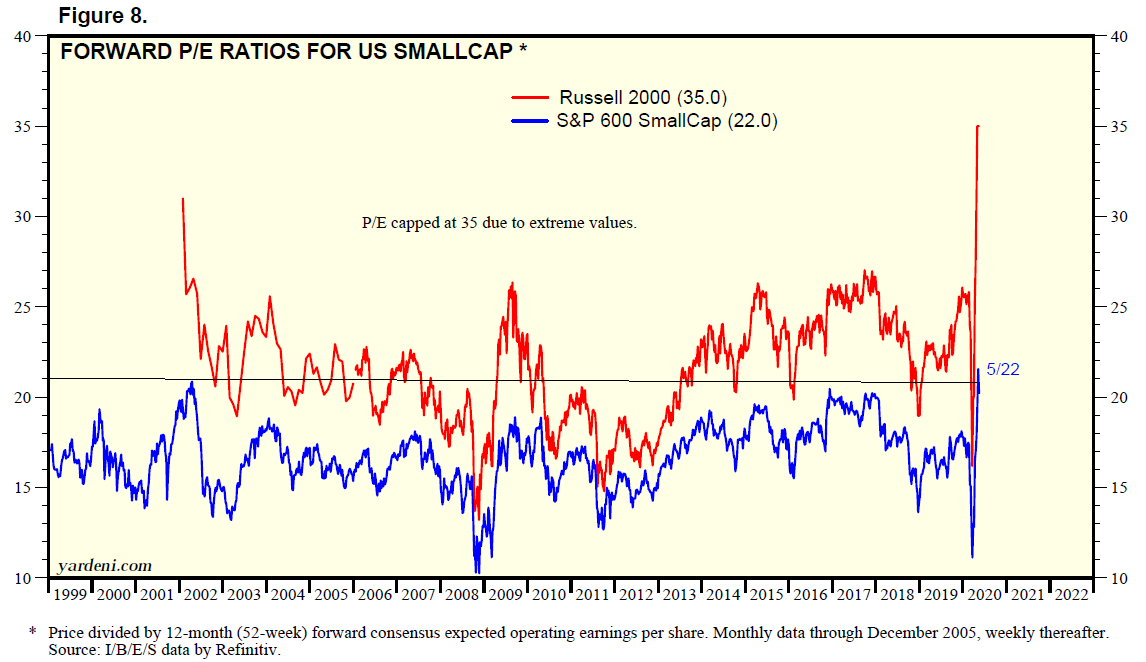
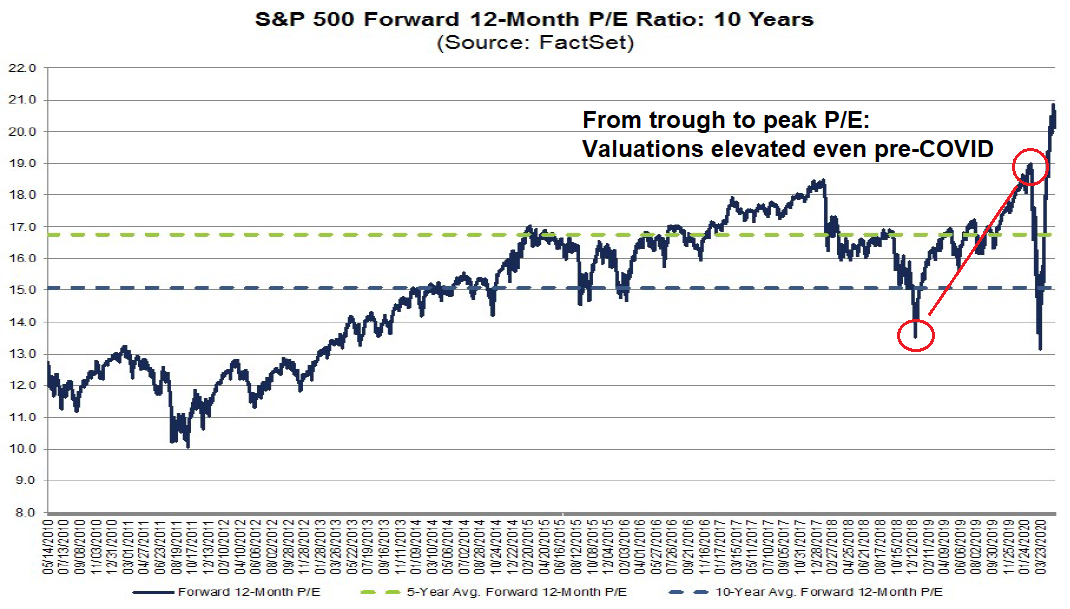
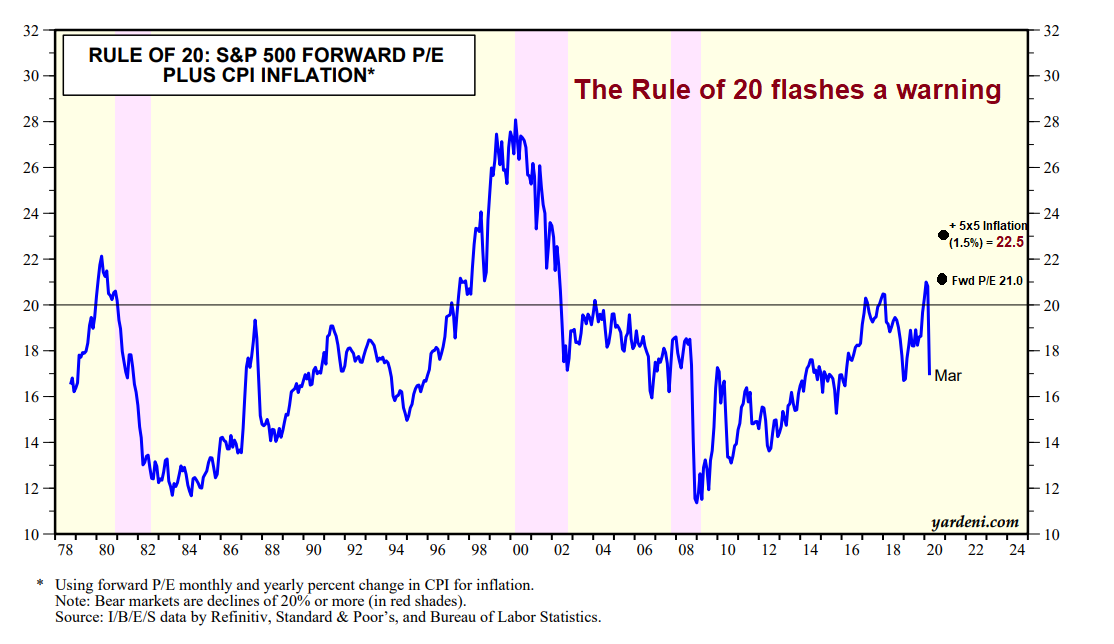
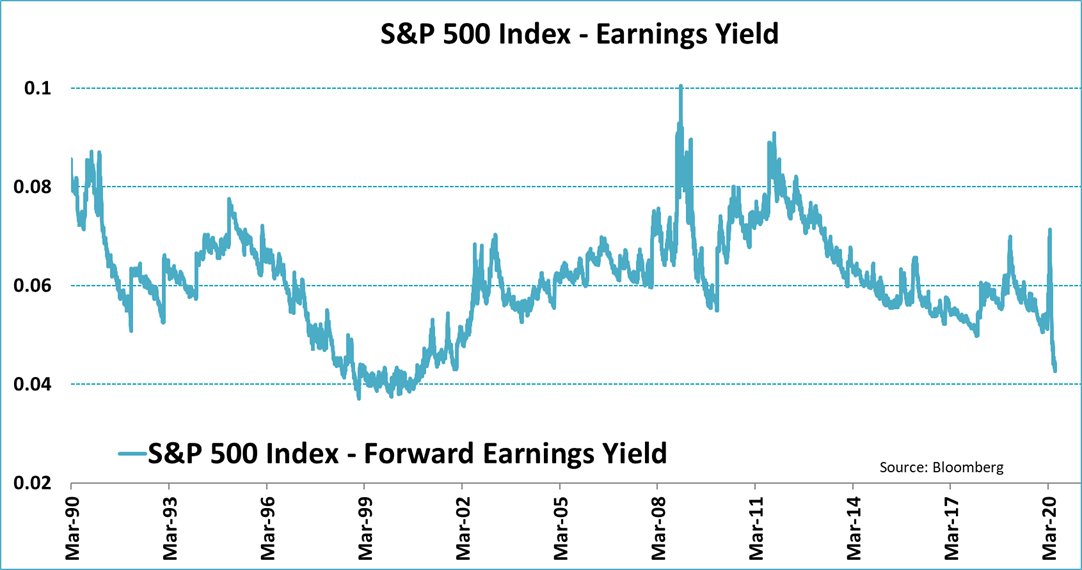
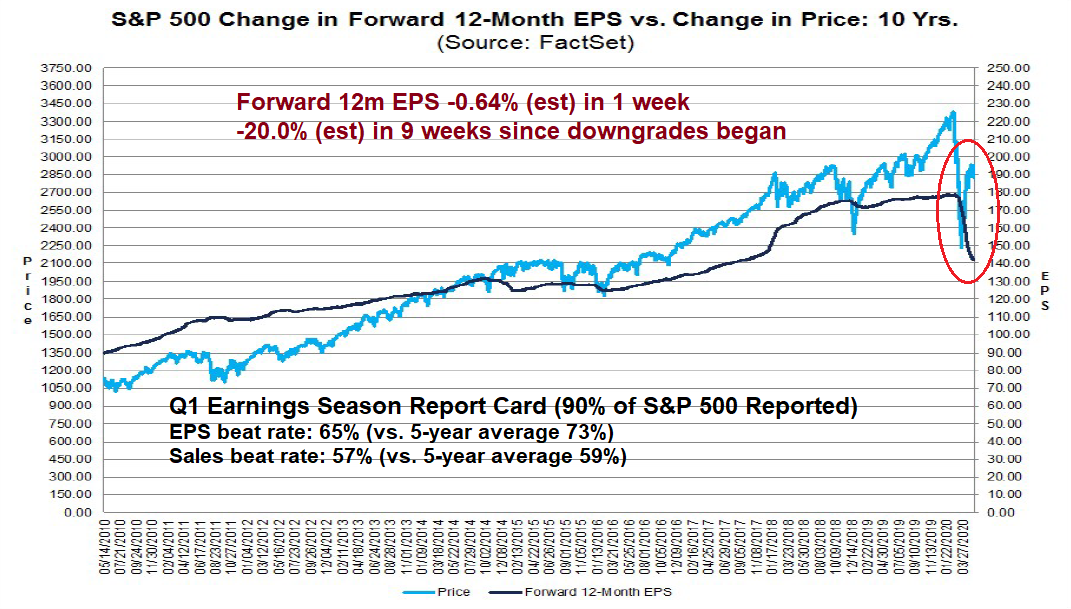
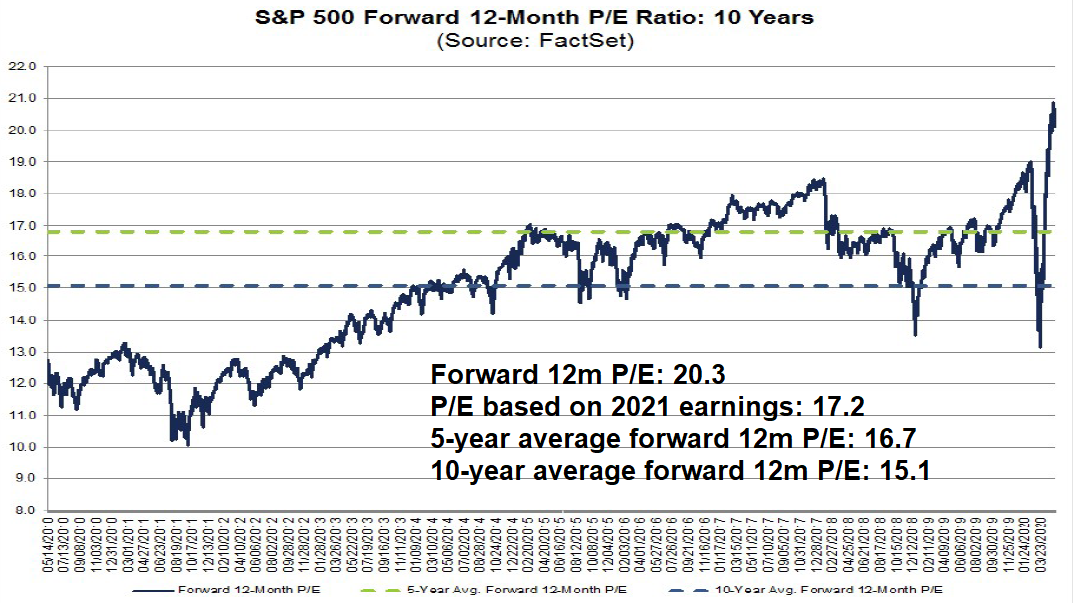
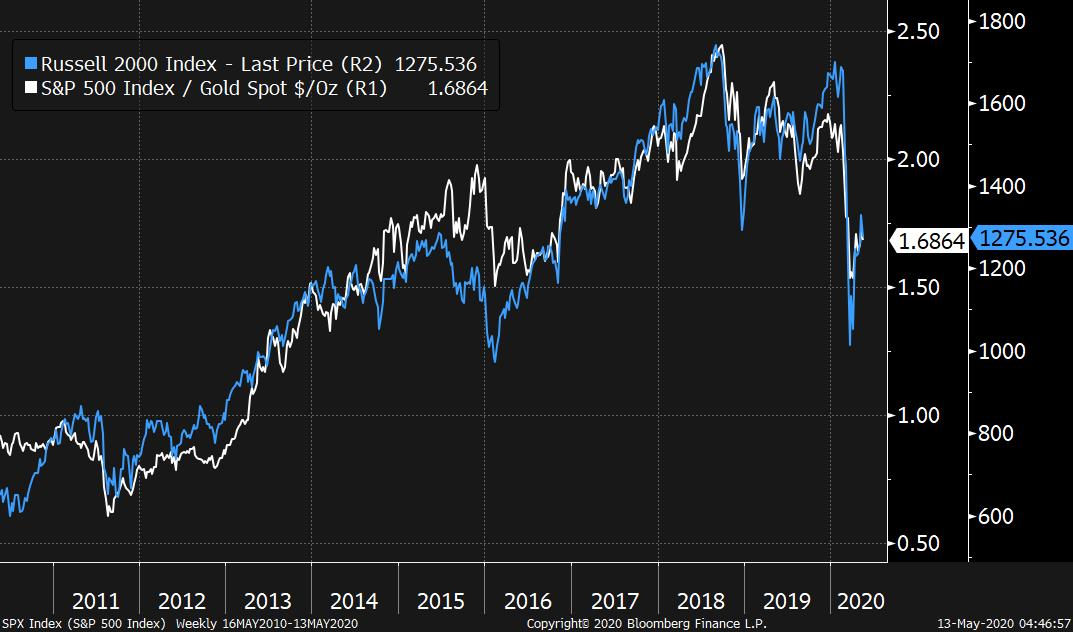
Meanwhile, the market is trading at a forward P/E ratio of 21.9, which is a level last seen in 2002. Past major market bottoms have seen the forward P/E at about 10. Even if we were to look forward to 2021 by acknowledging the utter devastation in 2020, the market is trading at a 2021 P/E of 19.1, which is not cheap.

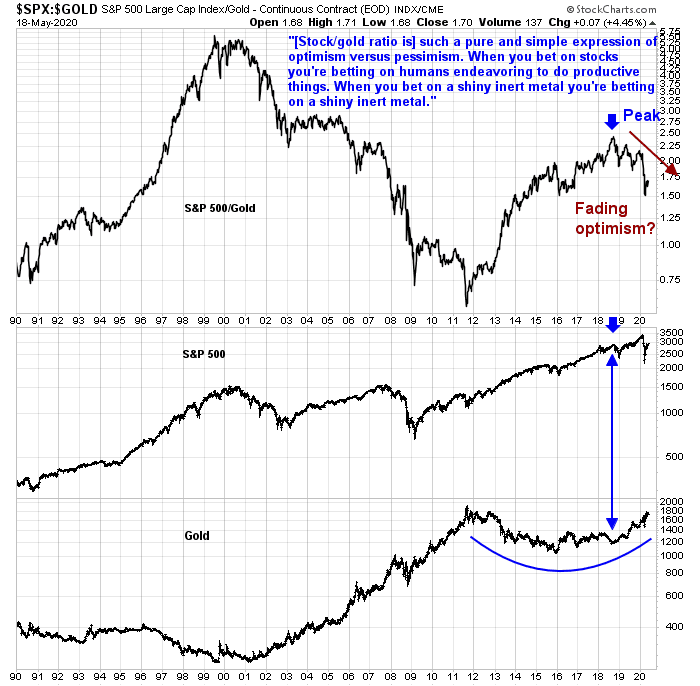
The stock market response has only a brief hiccup, which sounds like fantasy in light of the global macro disaster. So, why are we seeing the formation of a possible bubble, and signs of capitulation from the bears?
A study of psychology
We will never know why bubbles form, but one possible reason can be found in human psychology. The investor class has largely been insulated from the bulk of the economic shock, and they reacted by shortening their time horizons and focusing on short-term fundamental momentum.
Let me explain. The study of economics is based on homo economicus, a race of people with rational expectations. As the study of behavioral finance discovered, people are not always rational. Morgan Housel at Collaborative Funds observed that people behave differently based on their own experiences. He described Pavlov’s famous experiment where he conditioned dogs to drool by ringing a bell, because he rang a bell before he fed them. What is less known is what happened next.
A massive flood in 1924 swept through Leningrad, where Pavlov kept his lab and kennel. Flood water came right up to the dogs’ cages. Several were killed. The surviving dogs were forced to swim a quarter mile to safety. Pavlov later called it the most traumatic thing the dogs had ever experienced, by far.
Something fascinating then happened: The dogs seemingly forgot their learned behavior of drooling when the bell rang.
The dogs were suffering from PTSD because of the flood, and their behavior changed.
Ever the curious scientist, Pavlov spent months studying how the flood changed his dogs’ behavior. Many were never the same – they had completely different personalities after the flood, and learned behavior that was previously ingrained vanished. He summed up what happened, and how it applies to humans:
Different conditions productive of extreme excitation often lead to profound and prolonged loss of balance in nervous and psychic activity … neuroses and psychoses may develop as a result of extreme danger to oneself or to near friends, or even the spectacle of some frightful event not affecting one directly.
People tend to have short memories. Most of the time they can forget about bad experiences and fail to heed lessons previously learned.
But hardcore stress leaves a scar.
Here is how Housel generalized this experience to human behavior.
It’s why the generation who lived through the Great Depression never viewed money the same. They saved more money, used less debt, and were weary of risk – for the rest of their lives…
It’s why countries that have endured devastating wars have a higher preference for social safety nets…
It’s why baby boomers who lived through the 1970s and 1980s think about inflation in ways millennials can’t fathom.
The economy isn’t the stock market
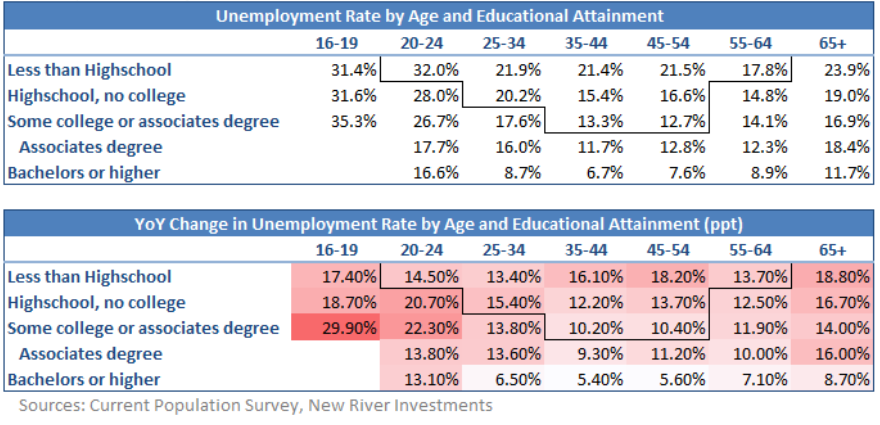
Here is why this analysis matters. The economy isn’t the stock market, and the investor class is not reacting to economic shock because it has largely been insulated from job losses. The burden of unemployment has fallen unevenly among the American population. It was mainly the low-wage workers who lost their jobs, or were furloughed. It has been the low-wage workers who would be suffering from economic PTSD.

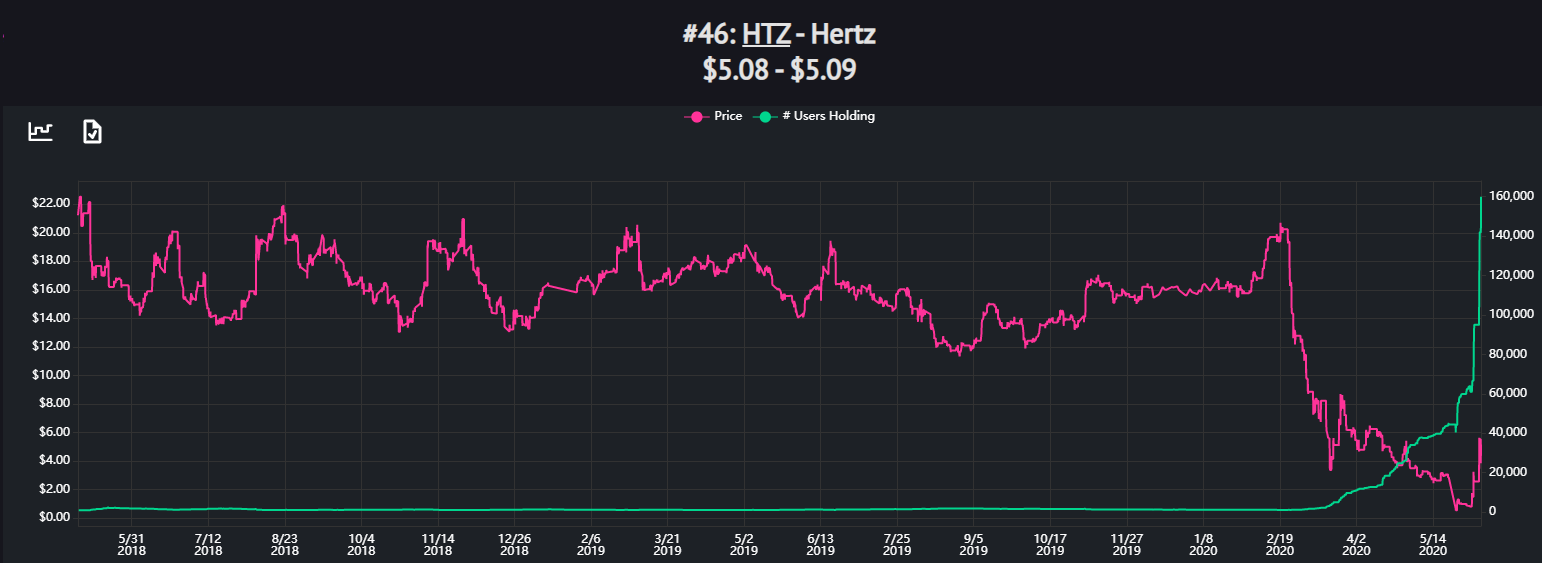
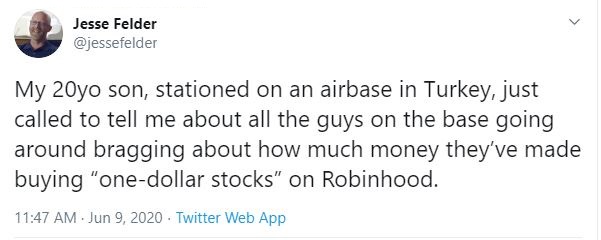
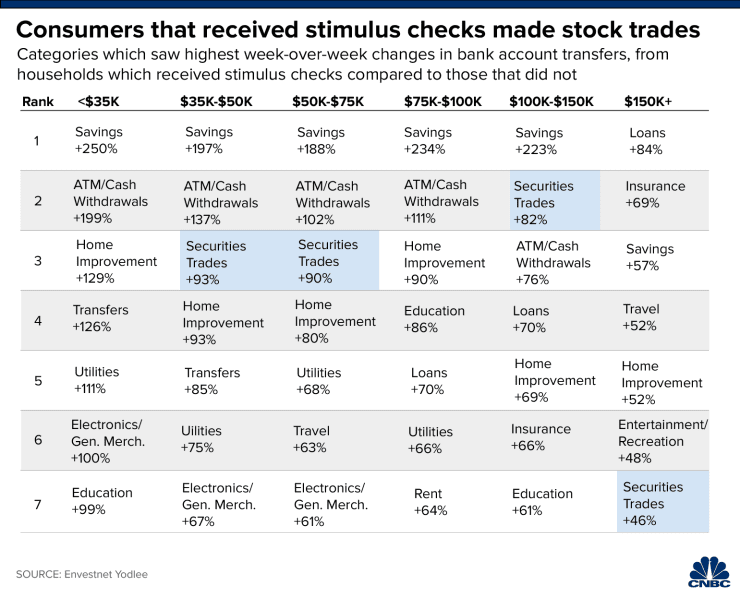
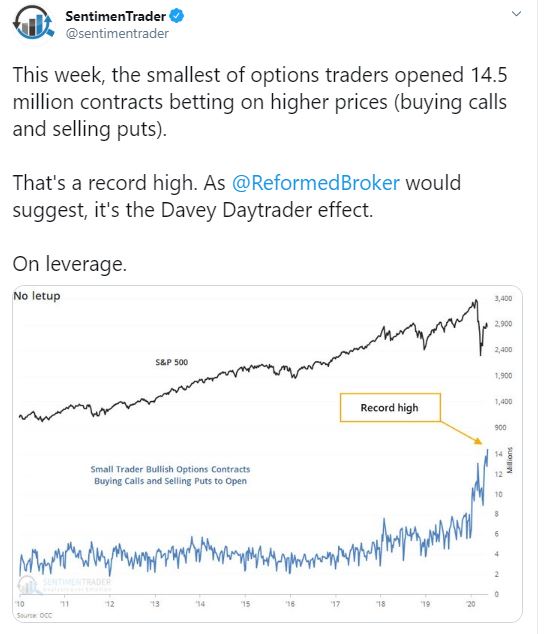
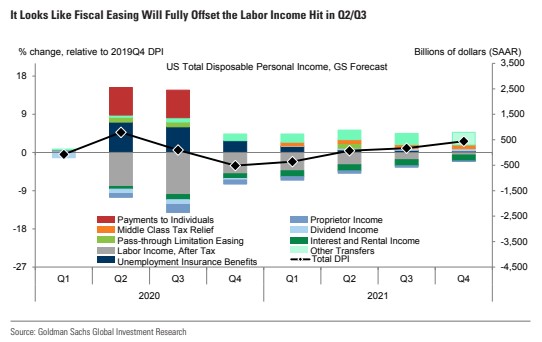
Investment managers belong to the white-collar worker class who have largely been untouched by pandemic-related layoffs. While the work-at-home regime may be an inconvenience, their economic circumstances are less affected than low-wage workers who have either lost their jobs, or need to risk their health to go into work. It is therefore little surprise that CNBC reported that the middle class used some of their stimulus money to play the stock market.

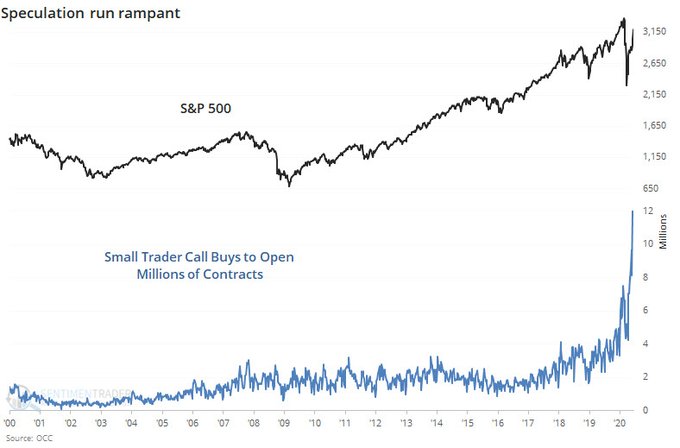
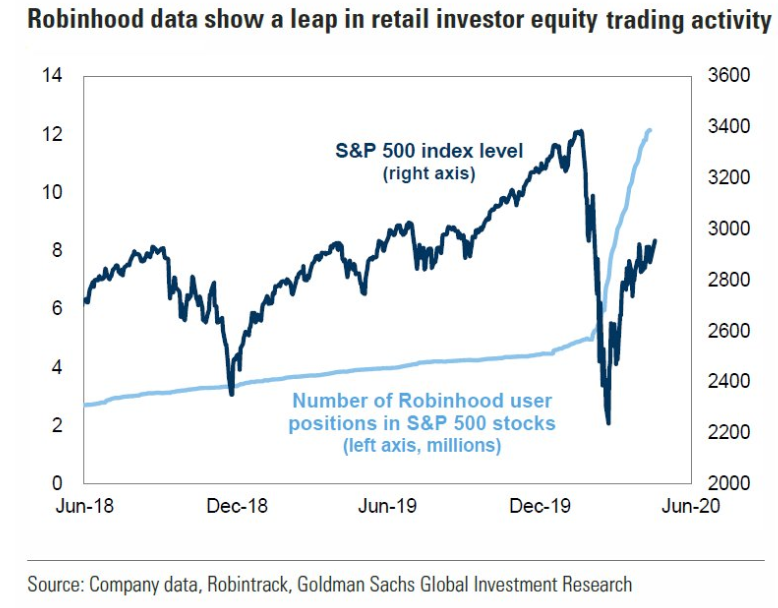
The white-collar investor class, which includes retail investors, and institutional and hedge fund managers, are reacting by staging a bullish stampede by focusing on the Fed stimulus, and the momentum of the recovery.
What could pop the bubble?
If this is indeed a market bubble, then what could pop the bubble?
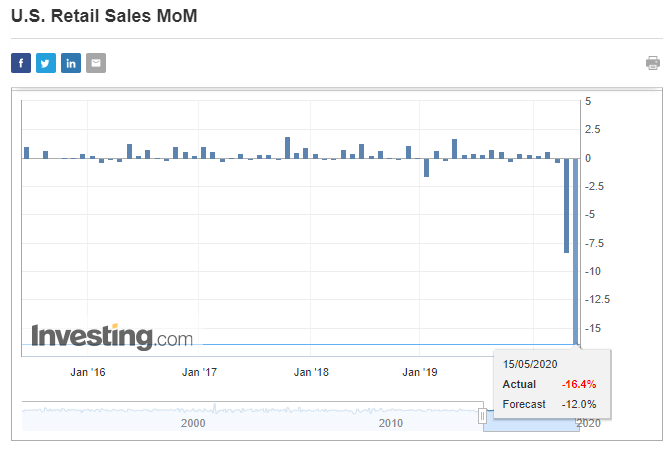
The Citigroup US Economic Surprise Index (ESI), which measures whether top-down economic releases are beating or missing expectations, has surged to its highest level ever, buoyed by upside surprises such as the May retail sales month-over-month advance of 17.7%. Past ESI retreats from elevated levels have usually seen stock prices stall with minimal upside potential. One bearish trigger would be a deterioration in ESI readings.

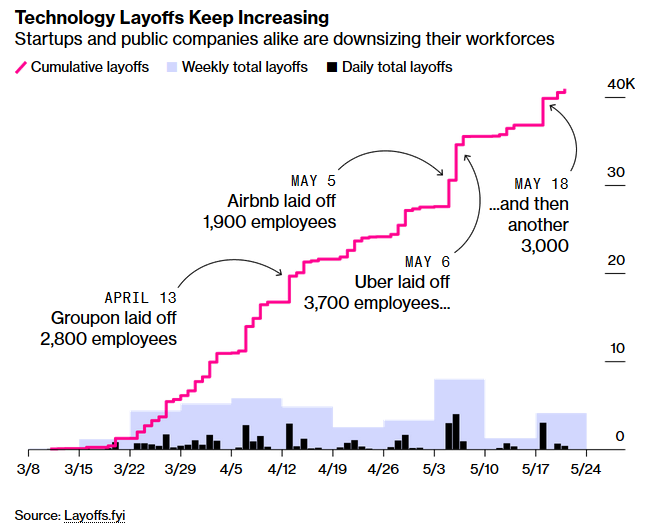
One trigger for ESI to fall is another wave of layoffs. Politico reported that Powell urged Congress to engage in more fiscal stimulus, and pointed out that state and local authorities are running out of money. Without federal support, this could mean mass layoffs, which would affect higher paying white-collar workers as well as low-paying positions.
He declined to give specific recommendations on further spending by Congress, but noted that millions of people are employed by state and local governments, many of which are experiencing fiscal crunches.
“It’s certainly an area I would be looking at if I were you,” he said. “That’s going to weigh on the economy.
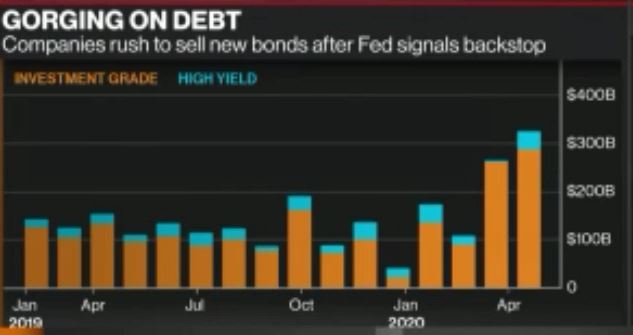
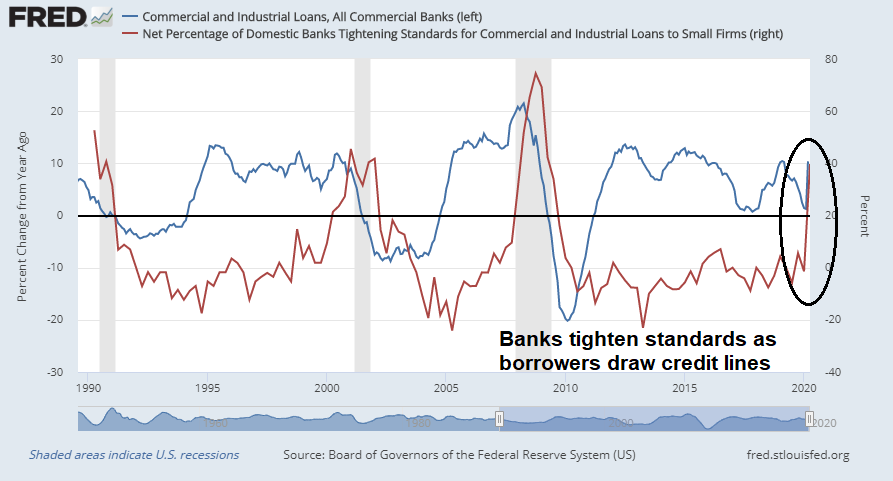
Jerome Powell’s stated in his Senate testimony that the Fed is taking steps “to support the flow of credit in the economy”, but Fed policy has its limits. Quantitative easing does not prevent defaults, it only postpones them. Already, corporate defaults are rising. As defaults rise, so will job losses that hit broad swaths of the labor market.

Similarly, household sector finances are coming under increasing stress. Credit card delinquency rates are also rising to levels last seen during the GFC.

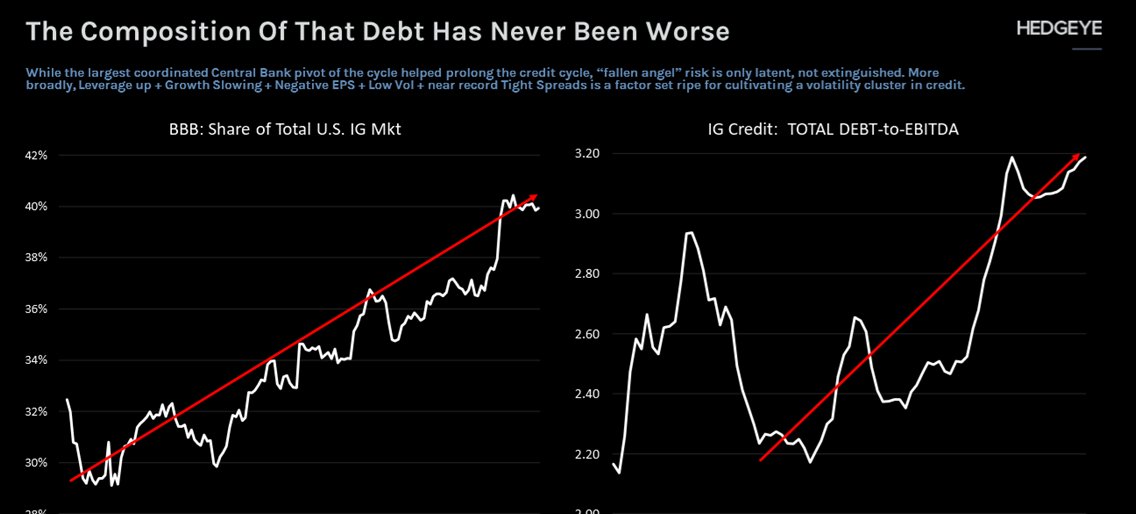
Remember, a well-functioning market needs price signals, and too much Fed support can obscure the process of creative destruction. Already, the number of zombie firms, defined as those whose debt servicing costs are higher than their profits but kept alive by easy credit, is rising rapidly. If allowed to proliferate, zombie firms are a drag on productivity. They seldom hire people; they shun new business investments; and they create a “dead zone” in the economy.

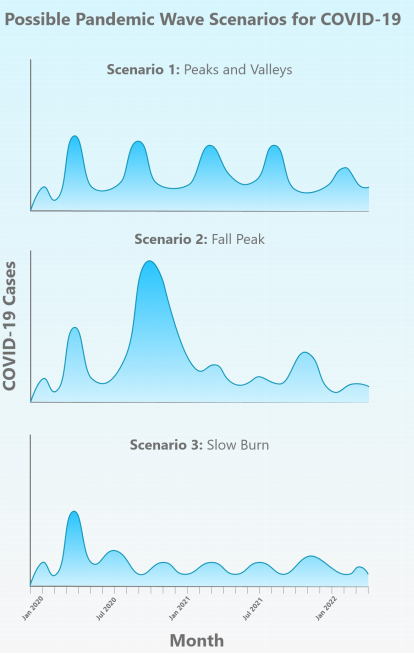
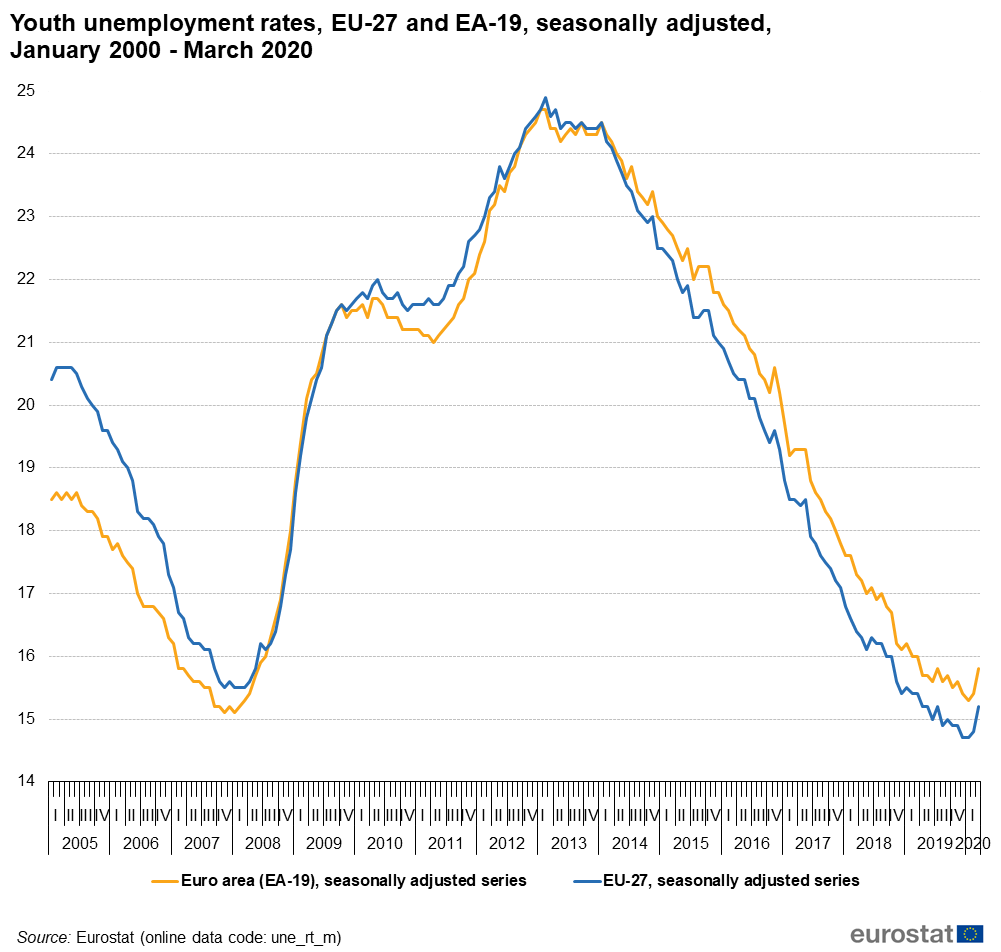
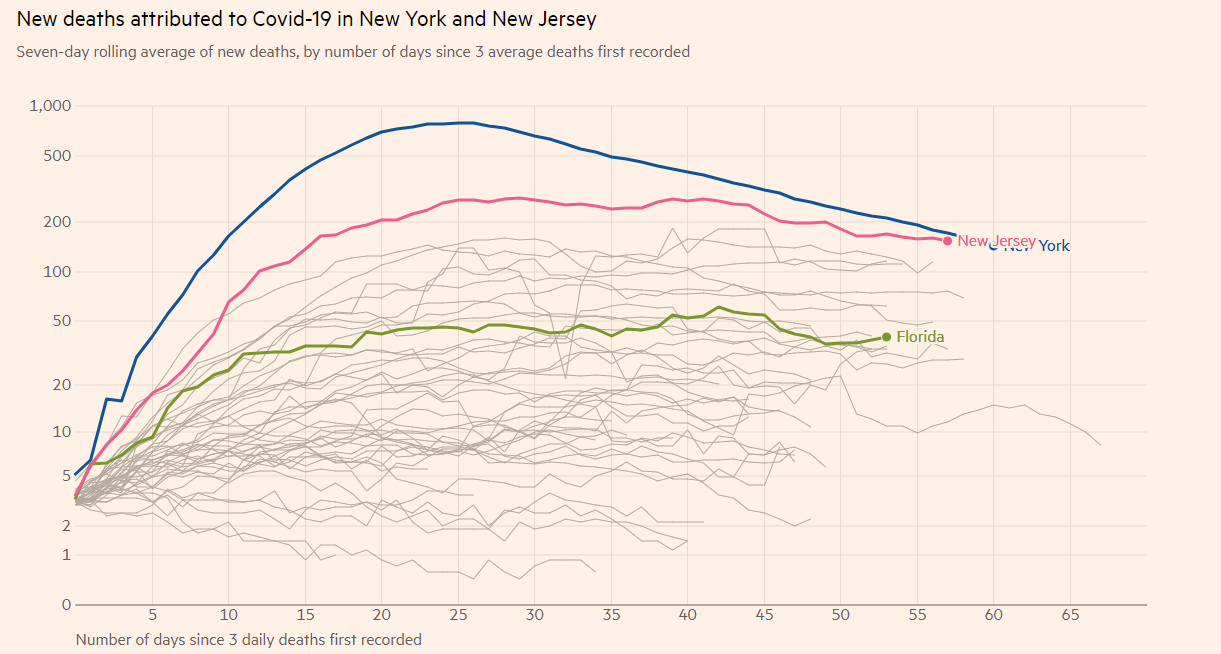
Another negative trigger could be a second pandemic wave, especially in the US. American public health policy has lagged other developed economies. The US population is roughly 330 million, while the EU’s population is 446 million. Europe has decisively bent the curve, while America has flattened the curve. What happens in a second wave, and what are the economic consequences? As a reminder, Jerome Powell stated in his Senate testimony, “The longer the downturn lasts, the greater the potential for longer-term damage from permanent job loss and business closures.”

Politico reported that Powell reminded lawmakers during his testimony that Fed projections assumes there is no second wave of infections.
Powell also said the Fed’s projections for economic performance this year, including a 9.3 percent unemployment rate by the end of 2020, didn’t factor in a potentially worse outcome if there is a second major outbreak of the coronavirus.
Not a bubble (yet)
Is this the start of a new market bubble? I am not prepared to make that call just yet. Technical price momentum indicators are insufficiently bullish to declare this a new mania. My bubble trigger is the monthly MACD indicator. Until the monthly MACD histogram turns positive, my inclination is to still call this a bear market rally.
Nevertheless, the adage that the economy isn’t the stock market may be especially true today. Despite enduring the fourth worse recession since 1876, the stock market reaction to the slowdown has been extremely mild. While the Fed has been swift to cushion the shocks, it cannot prevent bankruptcies and insolvencies, otherwise policy makers risk the rise of a class of nearly dead zombie companies which will be a drag on productivity.
Moreover, the burden of losses has been uneven, which is a factor that’s affecting investment psychology. The brunt of the economic shock has largely been borne by low-wage workers, and the investor class, consisting of middle and high-income households, have mainly been spared.
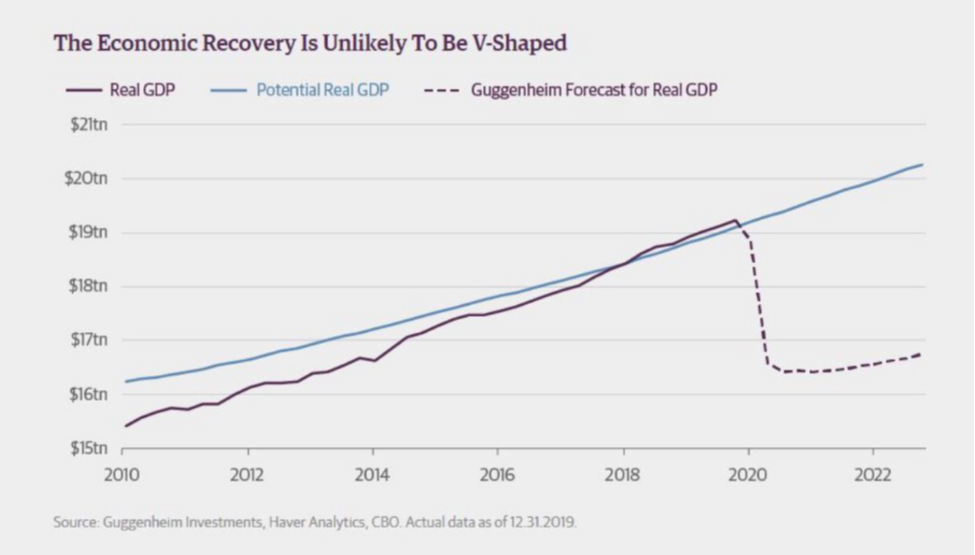
If I am wrong and this is a new bubble, we may need a second aftershock of rising insolvencies and white-collar layoffs for psychology to change. Investors are focused on the prospect of a V-shaped rebound today.

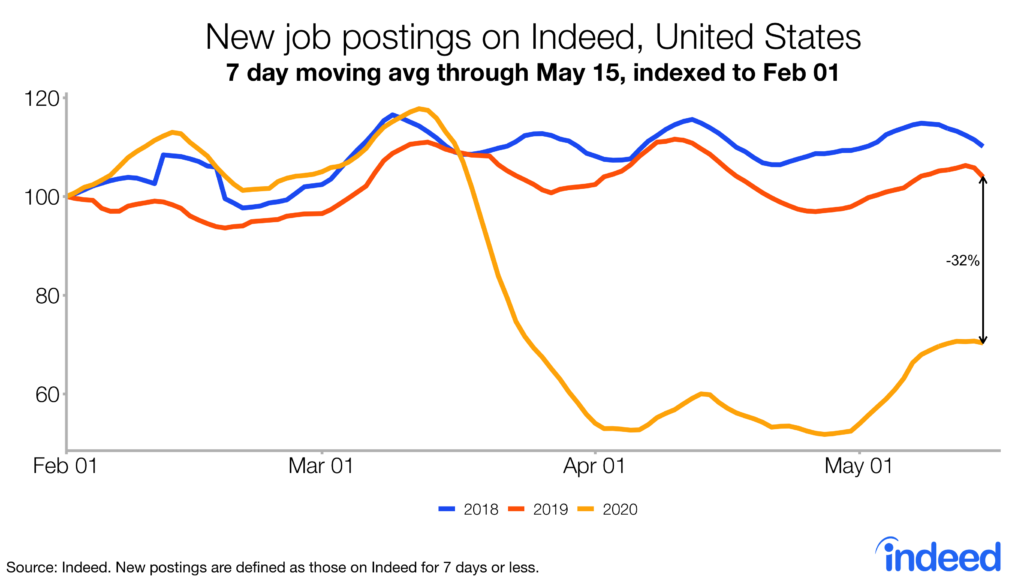
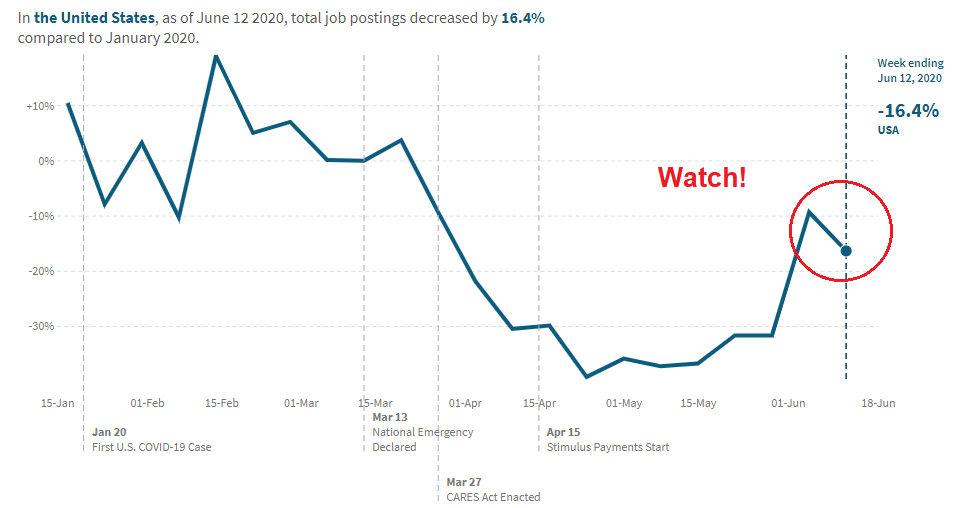
They should be wary of the risks of a pandemic second wave, or an economic second wave of rising insolvencies and layoffs. Already, weekly job postings are falling off after a business reopening related surge. Is this just a data blip, or something more serious? Stay tuned.
Also please stay tuned for our tactical trading publication tomorrow.