Mid-week market update: The stock market weakened on Monday when Trump’s early morning tweet indicated that he was slapping on steel and aluminum tariffs on Argentina and Brazil. The sell-off continued into Tuesday when Trump said in a news conference that he was in no hurry to do a trade deal with China, and he was willing to wait until after the 2020 election.

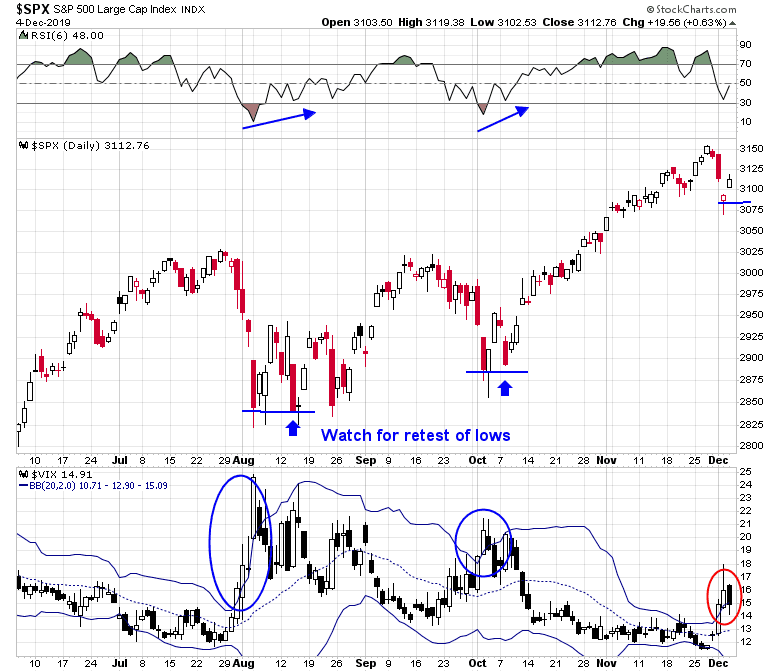
The market was already vulnerable to a tumble two weeks ago when it violated a rising trend line. This was followed by a rally to kiss the daily upper Bollinger Band, but it could not rally above the breached trend line.
The SPX gapped down on Tuesday, but formed what appeared to be a reversal candle, which was accompanied by a mild oversold reading on the 5-day RSI. The reversal was confirmed when this morning when equity future began to bounce back in sympathy with European stocks. The rally was further boosted by a Bloomberg report that “the U.S. and China are moving closer to agreeing on the amount of tariffs that would be rolled back in a phase-one trade deal despite tensions over Hong Kong and Xinjiang”.
How serious was the sell-off? What’s the technical damage?
Market internals
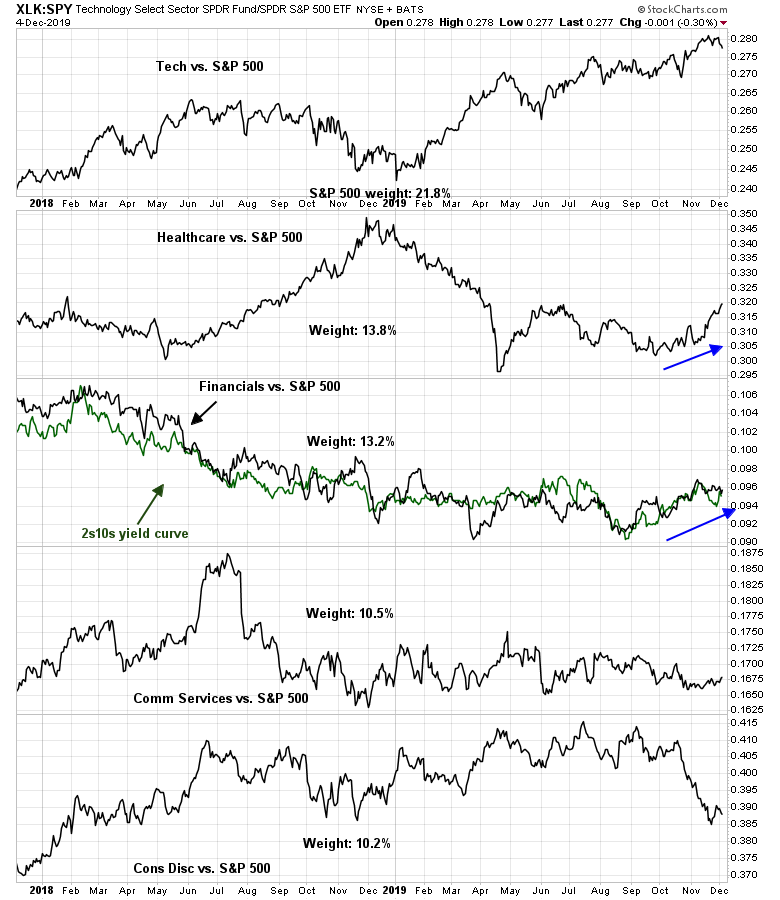
Let’s begin with the relative performance of the top five sectors of the market. These sectors comprise just under 70% of index weight, and the market cannot move meaningfully without major participation from a majority of these sectors. As the chart shows, the high flying technology sector’s leadership has stalled; consumer discretionary stocks have flattened after a period of underperformance; and two of the five sectors, healthcare and financial stocks, are in relative uptrends. That makes the bull trend a little wobbly, but it does not appear to be the sign of a major bear move.
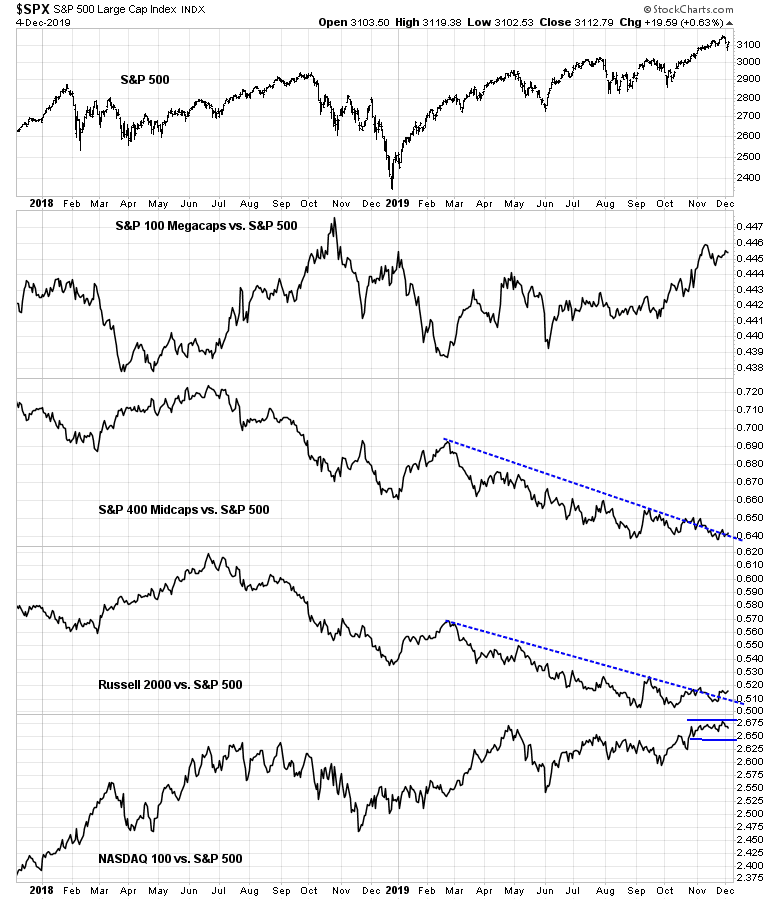
The analysis of market leadership by market cap grouping tells a different story. Megacap and NASDAQ 100 leadership seems to be stalling, but mid and small cap underperformance is ending. Both mid and small cap stocks are forming saucer bottoms after breakout out of relative downtrends. Are major bear moves usually characterized by emerging mid and small cap leadership?
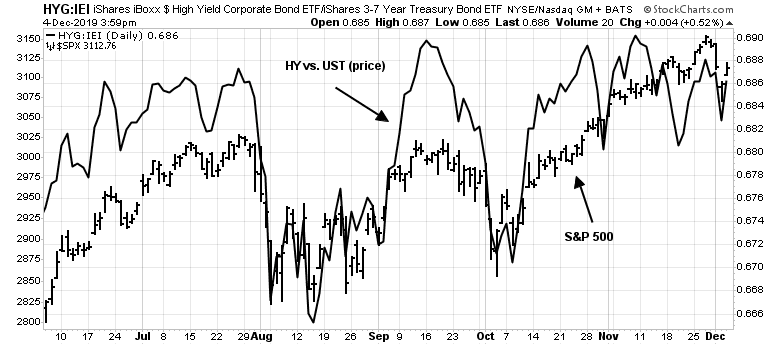
The credit markets are telling a story of stabilization. The relative performance of high yield (junk) bonds to duration-equivalent Treasuries had exhibited a mild bearish divergence, but that gap had largely been filled with the sell-off.
An bottoming process
Short-term momentum indicators had reached sufficiently oversold conditions for the market to bounce today. This chart depicts the % above their 5-day moving averages as of last night’s close.

The VIX Index spiked above its upper Bollinger Band on Monday, indicating a market oversold condition, and the signal was further confirmed with the market weakness on Tuesday. If history is any guide, expect a short-term bounce lasting 3-5 days, followed by a pullback to test the old lows, which is not always successful.
In other words, choppiness ahead. However, seasonality analysis still favors a Santa Claus rally later in the month. Jeff Hirsch at Almanac Trader found that the odds still favor a gain for the rest of December despite a rough start.
My inner investor remains bullishly positioned. Subscribers received an email alert on Monday that my inner trader had initiated a long position in the market. The trading model is now bullish.
Disclosure: Long SPXL
Thanks Cam!!