Preface: Explaining our market timing models
We maintain several market timing models, each with differing time horizons. The “Ultimate Market Timing Model” is a long-term market timing model based on the research outlined in our post, Building the ultimate market timing model. This model tends to generate only a handful of signals each decade.
The Trend Asset Allocation Model is an asset allocation model which applies trend following principles based on the inputs of global stock and commodity price. This model has a shorter time horizon and tends to turn over about 4-6 times a year. In essence, it seeks to answer the question, “Is the trend in the global economy expansion (bullish) or contraction (bearish)?”
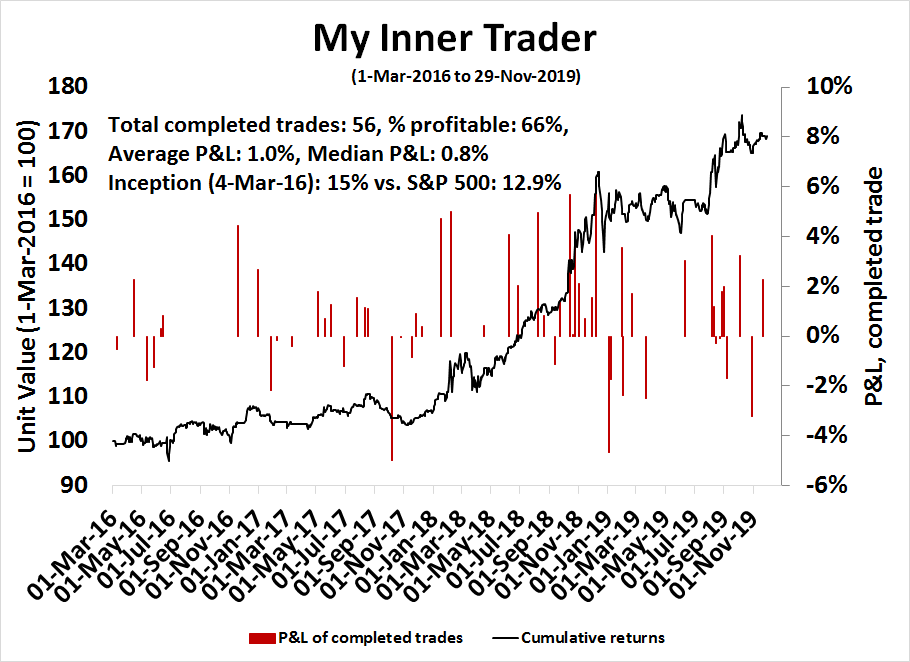
My inner trader uses a trading model, which is a blend of price momentum (is the Trend Model becoming more bullish, or bearish?) and overbought/oversold extremes (don’t buy if the trend is overbought, and vice versa). Subscribers receive real-time alerts of model changes, and a hypothetical trading record of the those email alerts are updated weekly here. The hypothetical trading record of the trading model of the real-time alerts that began in March 2016 is shown below.
The latest signals of each model are as follows:
- Ultimate market timing model: Buy equities
- Trend Model signal: Bullish
- Trading model: Bearish
Update schedule: I generally update model readings on my site on weekends and tweet mid-week observations at @humblestudent. Subscribers receive real-time alerts of trading model changes, and a hypothetical trading record of the those email alerts is shown here.
Long-term buy signal confirmed
A month ago, I highlighted a long-term technical buy MACD signal on the monthly Wilshire 5000 chart. The buy signal was not evident in global or non-US equities. As the month of November drew to a close, I can confirm that the rest of the world has caught up, and similar MACD buy signals can be found in other markets. History shows that these displays of long-term price momentum have resolved themselves in strong multi-year gains, and the index has seen gains 6 and 12 months later 100% of the time.

This week, we review sector leadership, and where the best upside potential can be found in the markets.
I conclude that the signs of a global cyclical recovery are firmly in place. Both U.S. and non-U.S. equity indices have flashed long-term buy signals that have proven to be remarkably effective in the past. I would favor exposure to mid-cycle sectors, such as industrials, financials, semiconductors (within technology), small-cap consumer discretionary and healthcare. Avoid late cycle sectors like energy and materials, avoid defensive sectors like consumer staples and utilities.
Buy beta! Risk on!
Globally bullish
The history of MACD buy signals have been uncannily bullish. The monthly MACD buy signals in the post-NASDAQ Bubble period has seen the Wilshire 5000 undergo bull markets that have lasted a minimum of two years. All of which have seen substantial gains.

The buy signal can also been seen in the MSCI World xUS Index.

Risk on!
Sector review: What to buy?
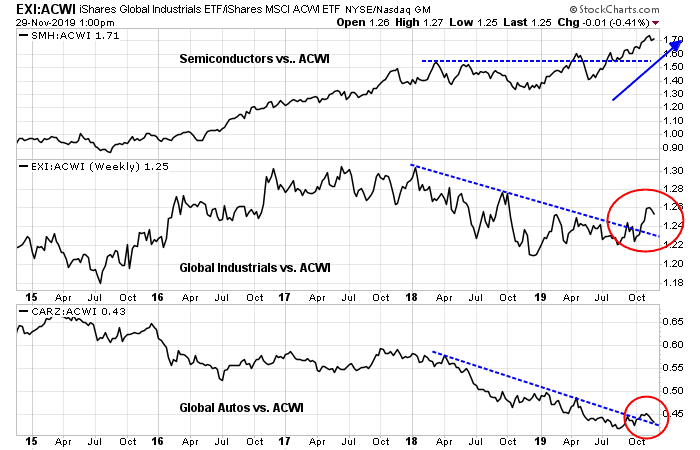
A review of sector exposure shows that cyclical sectors continue to be the market leaders. Semiconductors, which have been our favorite, have been on a tear relative to the MSCI All-Country World Index (ACWI). Global industrial stocks have also broken out from a relative downtrend compared to ACWI. Auto stocks, while not as strong as the other groups, have also staged a similar upside relative breakout, These are unequivocal signals of the start of a global cyclical recovery.
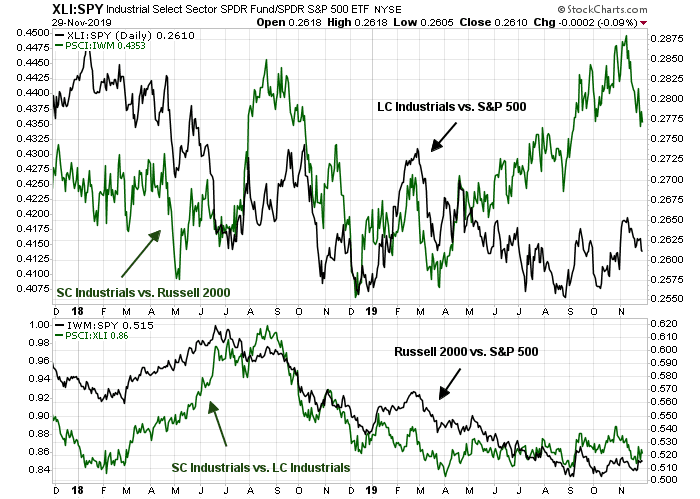
A US sector review comes to a similar conclusion. The framework for our sector review will analyze the relative return of the large and small cap sector to their respective large and small benchmarks, as well as the small and large cap sectors against each other. This form of analysis can reveal hidden sources of strength and weakness by disentangling sector effects from the effects of individual stock heavyweights in the sector.
Consider industrial stocks. The top panel shows that while large cap industrial stocks have only begun to strengthen against their large cap benchmark, small cap industrials have been the leaders against the Russell 2000 for most of this year. The green line in the bottom panel shows that small cap and large cap industrial stocks have roughly matched pace with each other for 2019. Small cap industrial outperformance was therefore an early sign that this sector had exhibited hidden market leadership.
The analysis of the technology sector tells a different story. While both large and small cap technology stocks are leading their respective benchmarks, small cap technology had slightly underperformed their large cap counterparts for 2019, which reflect the strength of the FAANG names. However, semiconductors have been the real market leaders within the sector. The bottom panel shows that while the NASDAQ 100 have been flat against the S&P 500, indicating a FAANG leadership stall, semiconductors have continued to rise against the technology sector for the past few months.

Should the global economy undergo a cyclical revival as I expect, it will push up bond yields. As technology stocks are mainly growth stocks with low earnings and high P/E multiples, they will act like a long duration bond with higher than average interest rate sensitivity as rates rise. Rising bond yields will therefore present a headwind for the technology sector. Better to have exposure to the more cyclical part of this sector, namely semiconductors.
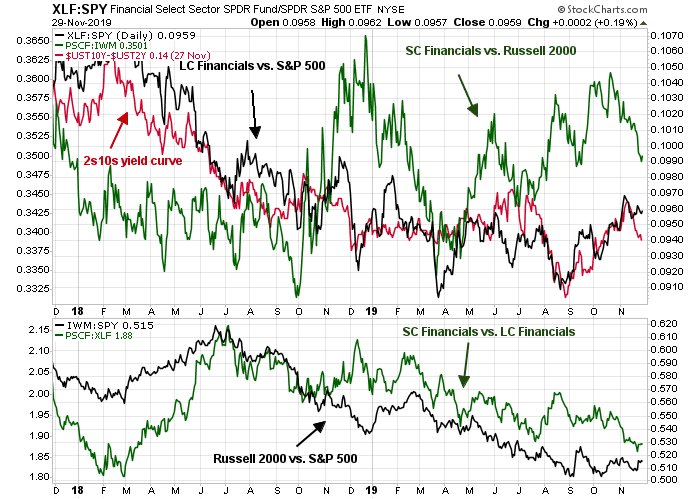
Large and small cap financial stocks have shown themselves to perform very differently from each other. While the relative performance of large cap financial stocks have been highly correlated to the shape of the 2s10s yield curve (red line), the relative performance of the small cap financial sector has been more positive, but volatile. As I expect the yield curve to continue steepening in response to better growth expectations, I would overweight this sector, but with a balanced commitment to both large and small cap names. Large cap exposure should benefit from the macro effects of a steepening yield curve, while small cap exposure should see better relative, but idiosyncratic and volatile gains, from small cap exposure.
The consumer discretionary sector also presents a bifurcated picture. Large cap consumer discretionary performance has been weighed down by the poor returns of heavyweight AMZN (red line). However, the small caps in this sector are showing signs of better relative returns. Overweight this sector, but concentrate in the small caps.

Healthcare stocks show a similar level of bifurcation as the consumer discretionary sector. Small caps are strong. Overweight the sector, and small caps in particular.

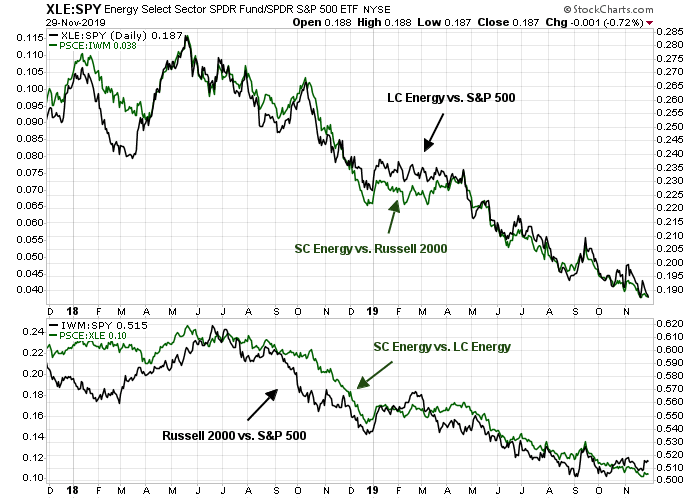
There is not much that can be said about the late cyclical resource extraction sectors. Energy stocks are not showing any signs of revival, in either large or small caps. Avoid.
The same could be said of the materials sector. Avoid.

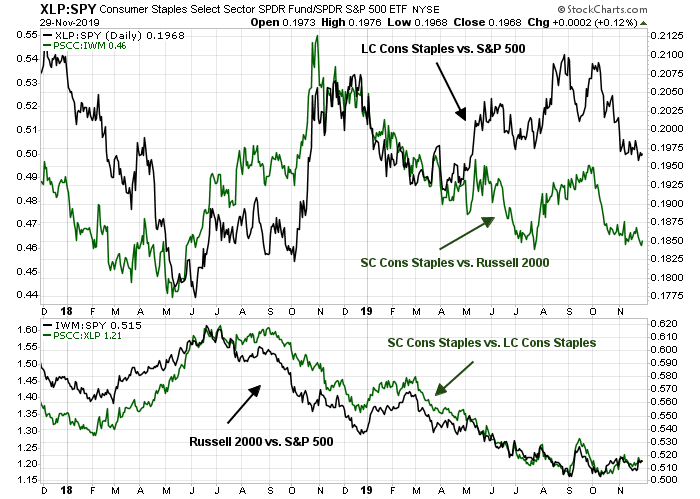
I would also underweight the consumer staples sector for a different reason. It is a defensive sector, and defensive stocks tend to lag in a cyclical rebound.
Similar comments apply to the utilities stocks. In particular, small cap utilities have been tanking relative to the Russell 2000, and small cap utilities are underperforming large cap utilities.

The real estate sector presents some opportunities for investors seeking yield. While both large and small cap REITs are performing roughly equally compared to their large and small cap benchmarks, small cap REITs are starting to turn up against large cap REITs. As well, the real estate sector should perform reasonably well in an environment when economic growth is strengthening. In addition, the household sector of the economy has been on fire, which should also give support to this sector.

For completeness, I present the relative performance of the communications services stocks, which do not have a small cap ETF. The relative performance of the cap weighted sector has been flat. The relative performance of the equal-weighted stocks in this sector relative to the equal-weighted benchmark, which is a partial proxy for small cap performance, has lagged. This is not an exciting sector. Avoid.

The cyclical rebound explained
I conducted a series of client meetings last week, and some questions arose about the fundamental underpinnings of the cyclical rebound.
The reason may be relatively simple. The global economy has become “less bad”. Jeroen Blokland pointed out that recession odds, based on Bloomberg’s economists poll, have begun to recede. This is a sign of a shift in macro and fundamental sentiment that is underpinning the broad based strength in global equity markets.

My own economic forecast has paralleled the Bloomberg survey, but with a 9-12 month lead. In October 2007, I wrote about a recession scare (see A recession in 2020?) as my suite of long leading indicators were nearing a recession signal (see the Recession Watch page for the latest readings).
Where does that leave our recession model? Conditions are neutral to slightly negative, and deteriorating. These readings are not enough to make a recession call yet, but if the pace of deterioration continues at the current rate, the models will flash a recession warning by the end of the year, which translates into the start of a recession in late 2019 or early 2020.
I concluded that the market was becoming concerned about a recession:
In conclusion, the odds of a recession are rising. The lights on my recession indicator panel are not red, but they are flickering. In addition, recession risks are rising because of the looming trade war. Technical conditions are also reflective of these risks. Investors should therefore adopt a cautious view of equities.
After the publication of that report, the stock market tanked, only to bottom about three months later on Christmas Eve, reflecting rising recession fears.
The real economy responded to that forecast as well. As the long leading indicators were designed to spot a recession about a year in advance, the market began to become extremely concerned when the 2s10s yield curve inverted, about 11 months after the publication of that report. However, conditions did not deteriorate further to warrant a recession call, and the long leading indicators have strengthened considerably and now point to little or no recession risk in late 2021.
In short, the evolution of the long leading indicators over the past year fully explains market views of economic expectations. Anxiety rose in the late summer and early fall of 2019 in accordance with the deterioration of long leading indicator conditions 12 months ago. They have since started to improve.
In conclusion, the signs of a global cyclical recovery are firmly in place. Both US and non-US equity indices have flashed long-term buy signals that have proven to be remarkably effective in the past. I would favor exposure to mid-cycle sectors, such as industrials, financials, semiconductors (within technology), small cap consumer discretionary, and healthcare. Avoid late cycle sectors like energy and materials; avoid defensive sectors like consumer staples and utilities.
Buy beta! Risk on!
The week ahead: Good or Bad Santa?
There was a story in the local newspaper about a mall Santa Claus getting fired for overly “naughty” pictures (link here). The question for equity investors is whether we are likely to see Good Santa, or Bad Santa this December.

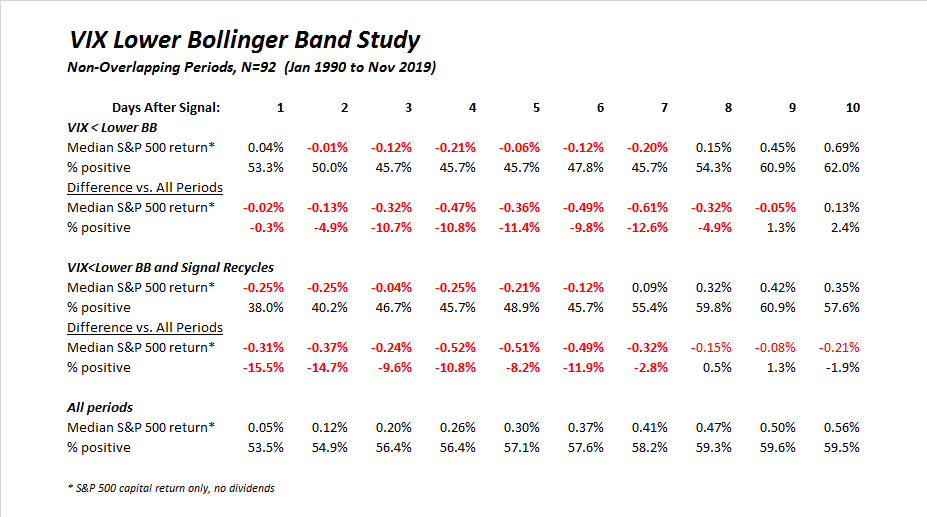
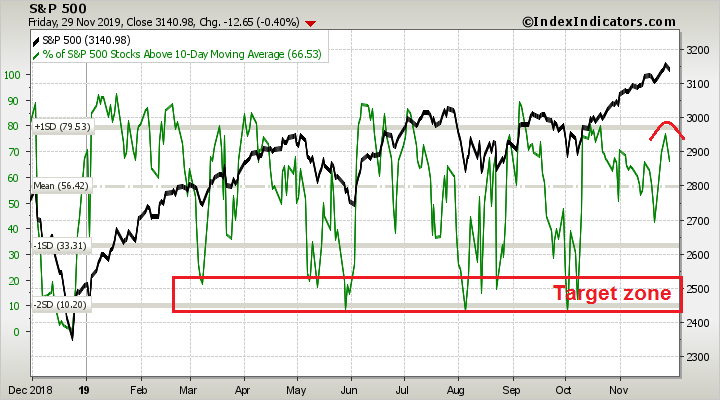
I would argue that Bad Santa is likely to appear first to scare everyone, followed by Good Santa to dispense presents for all the good Wall Street boys and girls. The VIX Index fell below its lower Bollinger Band last week, which is an indication of an overbought market. Depending on how strongly the bears can seize control of the tape, initial support can be found at the rising trend line at 3135, with secondary support at the Fibonacci retracement at 3040, and strong support at the breakout of 3025-3030.

The VIX falling below the lower BB was a warning. A recycle of the VIX above the lower BB was a more effective sell signal. As my historical study of this indicator shows, the VIX falling below its lower BB resolved with weak returns, and the recycle signal had even weaker returns out to about five days after the signal.
As well, Rob Hanna at Quantifiable Edges observed that when the SPX closed at a new high on the day before Thanksgiving, the history of short-term returns have tended to be weak (with the caveat that the sample size of this study is relatively small N=7).

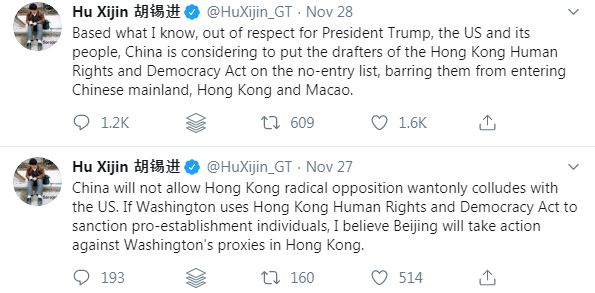
From a macro perspective, the bulls can forget about the prospect of any good news about a “Phase One” trade deal. President Trump signed the Hong Kong Human Rights and Democracy Act last week in support of the Hong Kong protesters. This will put a wedge between American and Chinese trade negotiators. China has made it clear it is very touchy when it comes to Hong Kong – just ask the NBA. In response to Trump’s signing the Act into law, Beijing has threatened unspecified retaliation.
We have some early hints from Global Times editor Hu Xijin. China intends to target key individuals with sanctions.
A Bloomberg article speculated that Beijing could take targeted political actions to retaliate:
It could hit out at U.S. companies by releasing a long-threatened “unreliable entities” list, stop buying American products, unload Treasuries or curb exports to the U.S. of rare earths, which are critical to everything from smart-phones to electronic vehicles.
On the diplomatic side, China could take measures such as halting cooperation on enforcing sanctions related to North Korea and Iran, recalling the Chinese ambassador to the U.S. or downgrading diplomatic relations. Based on the government’s responses on Thursday, none of those appeared imminent.
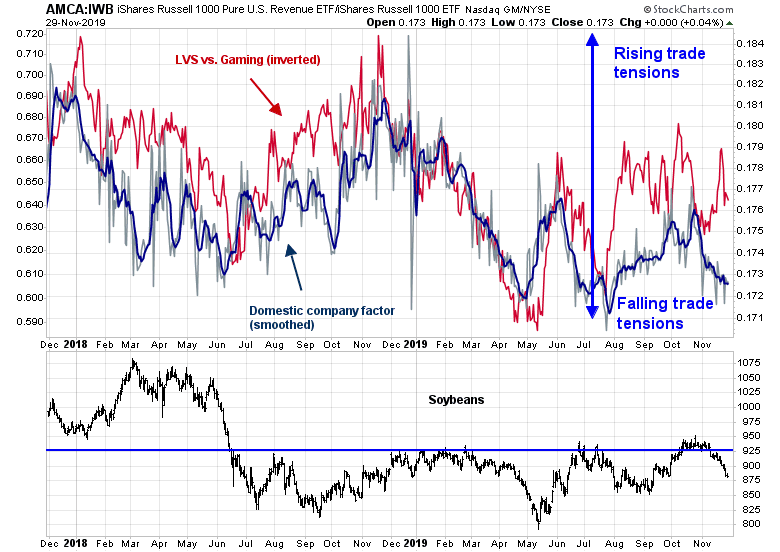
So far, our trade war factor, which measures the relative performance of domestically exposed Russell 1000 stocks to the overall Russell 1000, is relatively calm (black line). However, soybean prices have weakened. I am also monitoring the relative performance of Las Vegas Sands (LVS), which is Republican donor Sheldon Adelson’s vehicle that operates casinos in Macau (red line). If Beijing wanted to take a rifle shot approach to retaliation, then sanctions against Adelson could send a message to Trump and the Republicans.
The next shoe in the trade war may not have dropped just yet. As the Chinese have become more aware of Dow Man’s obsession with the stock market, don’t be surprised to see the news of any retaliation hit during US market hours.
Nevertheless, I remain bullish on an intermediate term basis. The SPX may be undergoing a melt-up in the manner of late 2017. It is unusual to see the index remain above its weekly BB for more than a week, which it did two weeks ago. The melt-up of late 2017 also saw similar episodes of upper weekly BB rides, punctuated by brief pauses marked by “good overbought” conditions on the weekly stochastic. The technical conditions appear similar today, and I am therefore giving the intermediate term bull case the benefit of the doubt.

The bull case is also supported by fundamental momentum, as measured by earnings estimate revisions. Positive estimate revisions can be observed across all market cap bands.

My inner investor remains bullishly positioned and overweight equities. My inner trader initiated a small short position last week. Short-term momentum appears to have recycled. He is waiting for momentum to reach oversold levels before covering his shorts and reversing to the long side.
Disclosure: Long SPXU
Do you prefer US stocks or Ex-US stocks? EAFE/EM over US?
The S&P 500 trades at a forward PE of 17.6, developed markets about 14x forward and EM about 12x. The upside potential is far more outside the US.
It’s easy to be confused about why a new leg is starting in a global bull market as Cam is saying. Let me cut through all the elements pro and con and drill down to what I believe is the #1 driving force.
That is the Fed extreme stimulative easing from the September meeting onwards. It is massive QE by any other name. Observers understate the impact since they only count the new monthly Fed buying. They should also count the cessation of Fed selling of their holdings (QT). Adding both together exposes the magnitude of the swing to easing.
In September 2012, the Fed unleashed extreme QE also and markets went up for two years. They had already recovered from the 2011 low so this was not at some major market low.
Look at the charts of the market from 2012 on. It was up and up and up.
The US economy is being stimulated with a $trillion deficit and this new massive QE. This is the type of stimulus you need at a recession low point not when unemployment is at a 35 year low.
So markets are powered by stimulation.
This is most effective in the American markets where institutional money is a big driver. Global markets are cheaper but they continually lag. In an environment of anti-globalization, the American economy is the least exposed to trade in the G10. Their financial system is rock solid. They allow innovation.
We also have the Presidential election coming up. Both parties want to appear as helping the economy. Note the North American trade deal is being passed in the House.
I’d stick to American stocks.
Can you give us some names to buy and hold? How about a combination of VTI and VT?
I’m restricted as to what I can recommend as a Canadian portfolio manager on a blog accessed by American investors.
As a general factor theme with no names, I like Quality and am adding Value.
Cam, great analysis. Thank you.
You noted that tech stocks that are growing but have low earnings and trading at high P/E multiple will see headwinds from rising interest rates. That headwind applies to all growth stocks, not just tech. Are you staying away from growth and tilting toward value stocks?
Sorry I was unclear. My comment applies to all growth stocks. That said, there is a lot more tech within the growth universe than the value universe.
I quote you in the context of growth/tech sector:
“Should the global economy undergo a cyclical revival as I expect, it will push up bond yields. As technology stocks are mainly growth stocks with low earnings and high P/E multiples, they will act like a long duration bond with higher than average interest rate sensitivity as rates rise. Rising bond yields will therefore present a headwind for the technology sector”.
We have expected bond yields to rise for the past decade. Bond yields have not risen to the extent that one would have expected. What is the chance yields will rise, unless inflation rises? Inflation is not exactly on the horizon, or is it?