Preface: Explaining our market timing models
We maintain several market timing models, each with differing time horizons. The “Ultimate Market Timing Model” is a long-term market timing model based on the research outlined in our post, Building the ultimate market timing model. This model tends to generate only a handful of signals each decade.
The Trend Asset Allocation Model is an asset allocation model which applies trend following principles based on the inputs of global stock and commodity price. This model has a shorter time horizon and tends to turn over about 4-6 times a year. In essence, it seeks to answer the question, “Is the trend in the global economy expansion (bullish) or contraction (bearish)?”
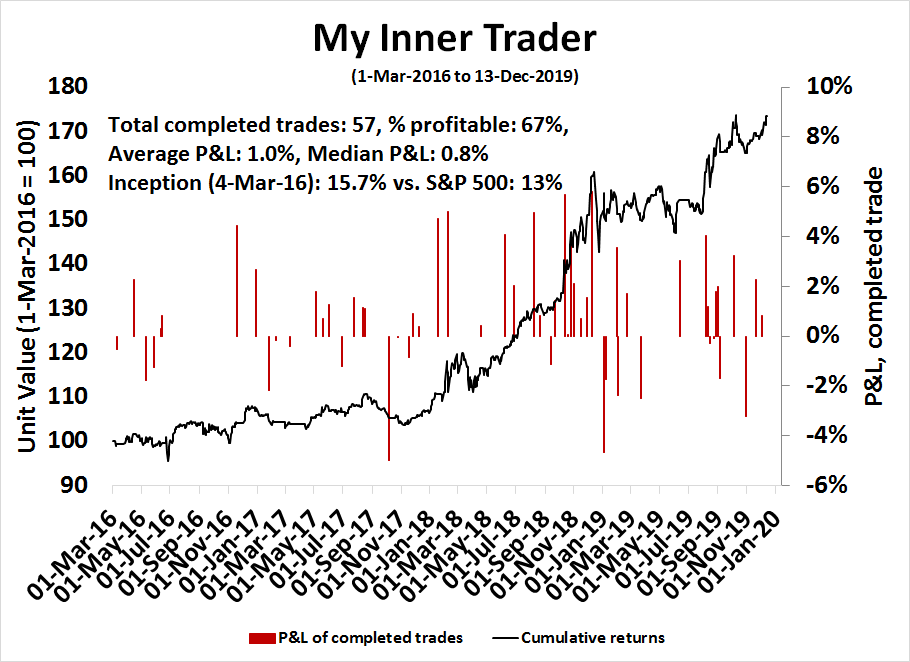
My inner trader uses a trading model, which is a blend of price momentum (is the Trend Model becoming more bullish, or bearish?) and overbought/oversold extremes (don’t buy if the trend is overbought, and vice versa). Subscribers receive real-time alerts of model changes, and a hypothetical trading record of the those email alerts are updated weekly here. The hypothetical trading record of the trading model of the real-time alerts that began in March 2016 is shown below.
The latest signals of each model are as follows:
- Ultimate market timing model: Buy equities
- Trend Model signal: Bullish
- Trading model: Bullish
Update schedule: I generally update model readings on my site on weekends and tweet mid-week observations at @humblestudent. Subscribers receive real-time alerts of trading model changes, and a hypothetical trading record of the those email alerts is shown here. As well, please join and “like” our Facebook page here.
Would you buy this chart?
Now that we have greater clarity on the Sino-American trade relationship, as well as Brexit tail-risk, can we get back to simple task of investing?
Consider the following question. Would you buy this chart, or factor? It was in an uptrend from 2011 to 2018. It consolidated sideways for about two years, and recently staged an upside breakout to fresh highs.
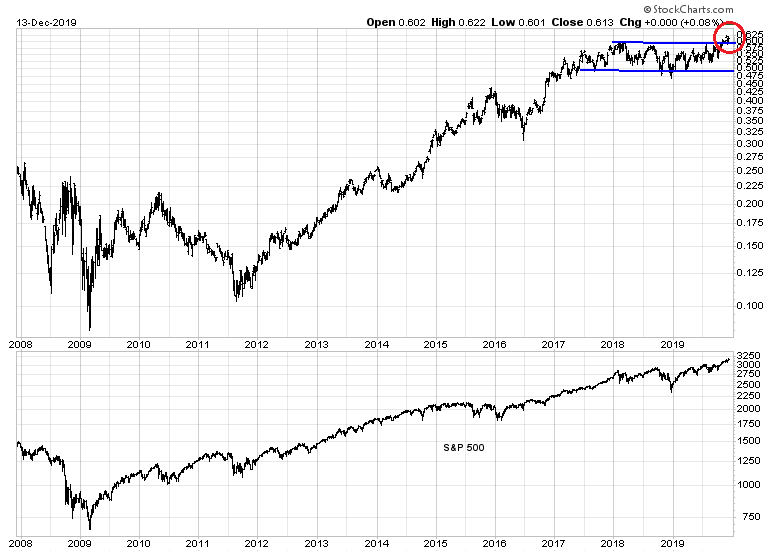
It is the ratio of the KBW Bank Index to the CRB, or what I call my Fed Report Card. It measures the Fed’s ability to maintain growth and financial stability while keeping asset inflation (CRB) under control. Despite Powell’s dovish tilt after the latest FOMC meeting, the Fed is performing well on that metric.
For investors, my cross-asset analysis suggests superior return opportunities in bank and financial stocks amidst signs of a global cyclical revival.
A cyclical revival
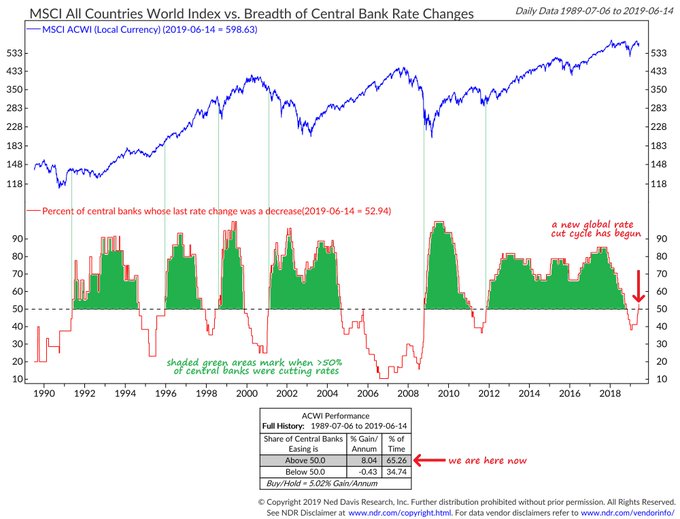
More and more signs of a global cyclical upturn have been appearing, even before the news of a Phase One trade deal, and a Tory victory in the UK election that took Brexit tail-risk off the table. Macro Charts observed that global central banks are starting an easing cycle, which should be bullish for risky assets.
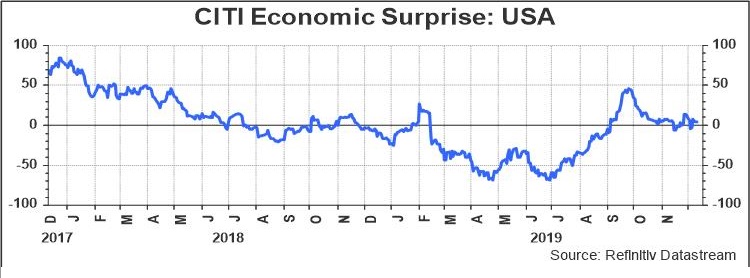
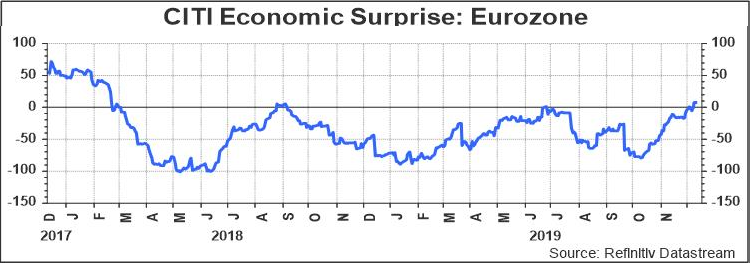
The Citi Economic Surprise Index, which measures whether economic statistics are beating or missing expectations, is positive for the US.
Eurozone ESI recently turned up and it is now positive after spending several months in negative territory.
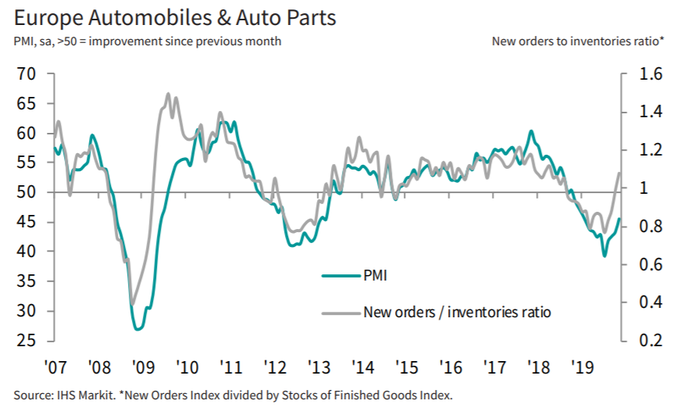
Speaking of Europe, Callum Thomas recently highlighted other signs of improvement in European autos, which is a highly cyclical industry. The European auto sector may also be benefiting from the start of a replacement cycle from diesel to electric vehicles.
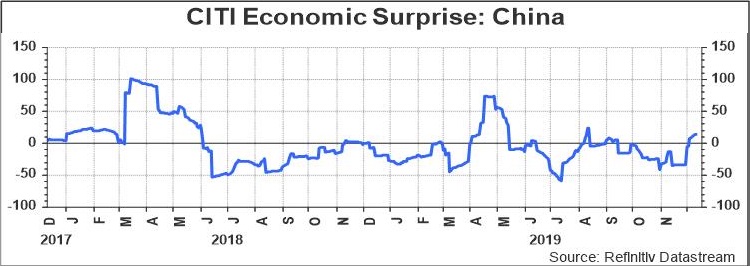
Even China ESI has turn positive, indicating positive surprises despite the recent gloom over decelerating growth.
There was also other upbeat timely news from Asia last week. Yonhap reported that the closely watched first 10-day December South Korean exports rose a surprising 7.7%.
Bullish for banks and financials
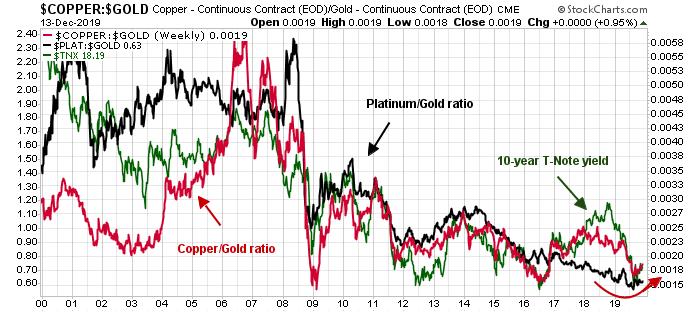
Here is why these developments are bullish for banking and financial stocks. The copper/gold and platinum/gold ratios, which are global cyclical indicators, are turning upward. Both ratios are also correlated with the 10-year yield, which is not surprising as bond yields tend to rise as growth expectations rise.
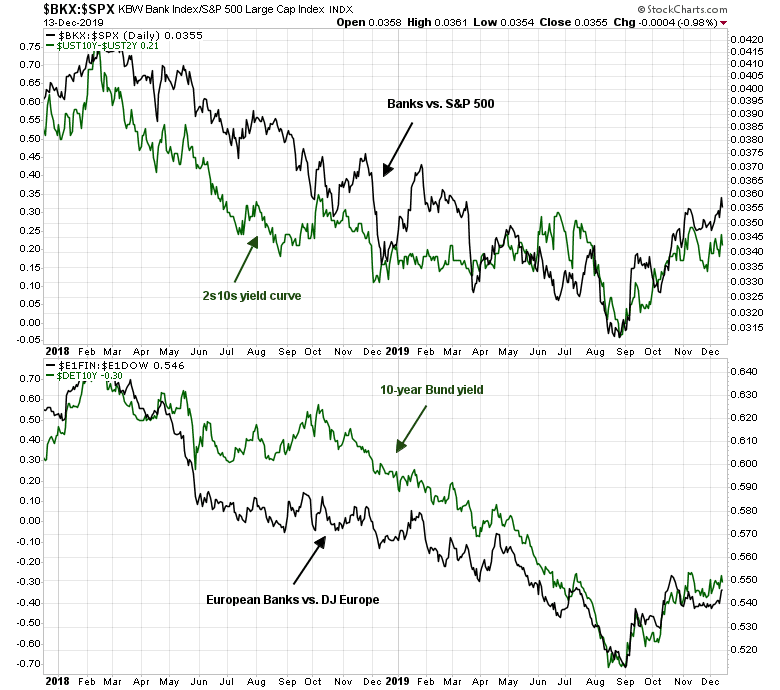
While the relative performance of bank stocks are correlated to the 10-year yield, they exhibit a tighter correlation with the 2s10s yield curve. As growth expectations rise, the yield curve steepens, which allow for better banking profitability as banks borrow short and lend long. In Europe, negative rates have destroyed the banking system, and a rising 10-year Bund yield is a positive sign for the European banking sector.
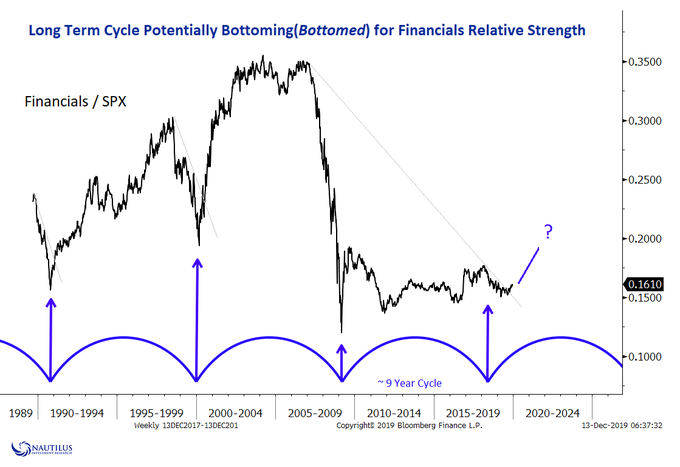
Lastly, Nautilus Research highlighted a big picture technical perspective. Using cycle analysis, they concluded we may be at the start of a long-term bullish cycle of bank and financial stock outperformance.
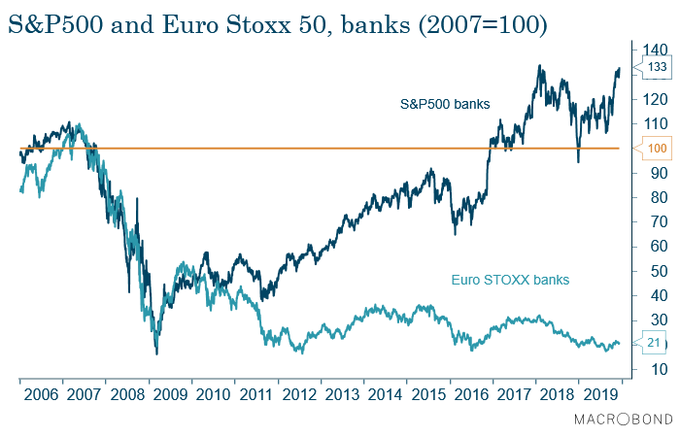
Even better opportunities in Europe
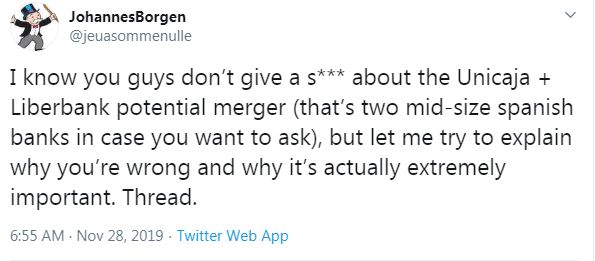
While I believe that US financial stocks should outperform, the real opportunity is in the beaten up European financial sector. Recently, Johannes Borgen wrote a twitter thread which revealed a shift in European banking regulation that has the potential to be bullish for the sector. (For the uninitiated, CET1 = Common Equity Tier 1 capital, NPL = Non-Performing Loans).
I think we can all agree one of the major effects and economic distress created by the financial crisis was the massive bank deleveraging. This was triggered by large losses but also by massively increased capital requirements (x3 more or less, SSM = the ECB’s Single Supervisory Mechanism).
New capital raises did offset that a bit, but not enough – because raising even more capital was too painful for shareholders. The dilution is just too large.
We can also all agree that negative rates are bad for banks (well, all except the ECB – until very recently, but that’s another story!) and that if they are to contribute to economic growth, banks need to be more profitable to improve their capital.
Unfortunately, this is harder to do than to say: IT investments take a long time to pay off, restructurings are expensive and equity isn’t cheap, NPL coverage requirements keep creeping up, rates are not going up, litigation is still there, etc.
So everybody knows (and the ECB has been crystal clear about this recently) that M&A needs to happen, there needs to be less competition in the banking market and the same cost base needs to deliver more turnover. Technically it’s possible.
So to put it bluntly: the EU’s economy needs more bank M&A. The days are long gone when supervisors were screaming about banks being too large to manage from a systemic point of view.
There are many reasons why M&A hasn’t been happening a lot: the incompleteness of the banking union is one, but that’s not enough. This does not apply to intra-border M&A – such as Unicaja + Liberbank!
A less often discussed constraint and barrier to M&A has been the position of the supervisor; a slightly schizophrenic one! Under Mrs Nouy’s stewardship, every big M&A project came with a required capital increase!
Banks were often puzzled by this, e.g. Italian banks would ask: “if the two banks have adequate NPL coverage, why do they need a bigger coverage once they combine and are more efficient?” Honestly a very good question.
And most of the time, the reason was basically this: “I’m asking you to raise capital, because I can. You’re asking something from me (authorization for the merger), I’m asking something from you (more capital.)” That’s it.
Obviously, this complicates deal making and even made some M&A projects economically meaningless.
So coming back to Unicaja + Liberbank. Since Mr. Enria took over, it seems the SSM has slightly changed its approach. Various speeches seem to imply that the SSM would not adopt the same kind of strategy before approving mergers.
And if that’s true – if the SSM stops asking for more equity each time there’s a major M&A deal – honestly, it’s a game changer. And guess what: reportedly, the SSM seems to be on board for a Unicaja + Liberbank deal with no additional equity.
And we’re not talking about a Rabobank + ABN Amro deal here. Liberbank is rated Ba2/BB+ whereas Unicaja is BBB-/Baa3. Both banks still have quite a nice stack of legacy NPA assets, included a large chunk of foreclosed real estate.
So honestly, if this merger doesn’t come with mooooar CET1, which one will?
Bottom line: even if you’re not interested in banking, keep an eye on this deal and look for the conditions requested by the SSM to approve the deal. That’s what matters.
To summarize, European banking regulation seems to be changing. The regulator’s reaction to this transaction opens the door to more banking mergers, and stronger banks. Combine that with a cyclical revival that boosts the 10-year Bund yield, banking profitability improves. The European banking sector is one that has been left for dead for about a decade. Any signs of improvement in operating and regulatory environment have the potential for these stock to go on a tear.
So go ahead, put some banking and financial stocks under your Christmas tree. You can thank me in the new year.
The week ahead
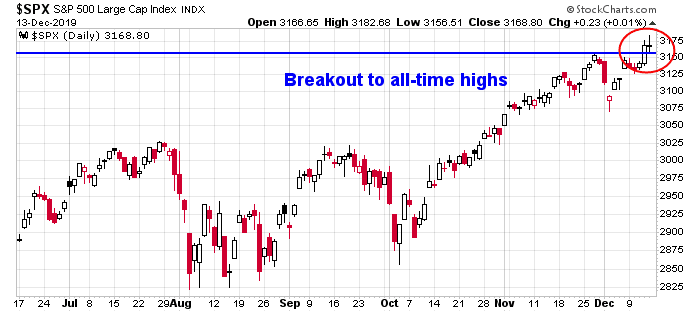
Looking to the week ahead, it is said that there is nothing more bullish than a stock or an index making all-time highs. But the key question for traders is whether they should buy the breakout, or sell the headlines. The market staged an upside breakout to all-time highs on Thursday on the Phase One deal news, and the index closed flat Friday but held above the breakout level.
Here are bull and bear cases.
The bull case
The bull case rests mainly on price momentum. During my tenure at a hedge fund, I learned that there are four important dates in a year. They are the quarter-end dates that the incentive fees are calculated. If a fund charges a 2 and 20 structure (2% of assets and 20% of gains), the 20% incentive fee is calculated on the return for the quarter.
On one hand, many hedge funds close down their books and flatten their positions about this time of the year because market liquidity dries up in the latter half of December. On the other hand, we also know from surveys and imputed data calculations that both traditional long-only managers and hedge funds were defensively positioned entering Q4. As stock prices began to rise, they engaged in a FOMO beta chase. Now imagine that you are a hedge fund manager whose bonus depends on your quarterly returns. You were caught off-side as the risk-on rally began. You chased beta in response, and you may nor may not be positive for the quarter. Do you shut down your book now, or continue to chase the market upwards, especially in light of numerous global upside breakouts which are holding?
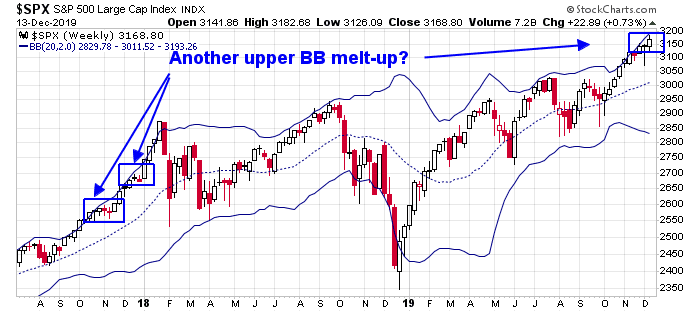
Greed is good. Fear (of no bonuses) is also a great motivator. The market is starting to look like it is repeating the surge of late 2017, which was characterized by upper Bollinger Band rides on the weekly chart, punctuated by brief periods of consolidation. Now that the index has staged an upside breakout to fresh highs, could we be seeing another melt-up?
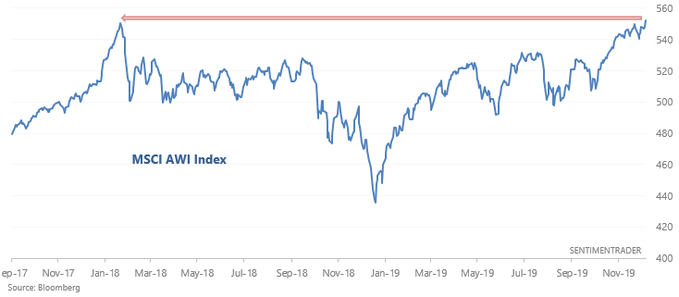
SentimenTrader documented the effects of price momentum from the effects of the upside breakouts and positive breadth. All have bullish implications. (By ACI he probably means ACWI, or All-Country World Index).
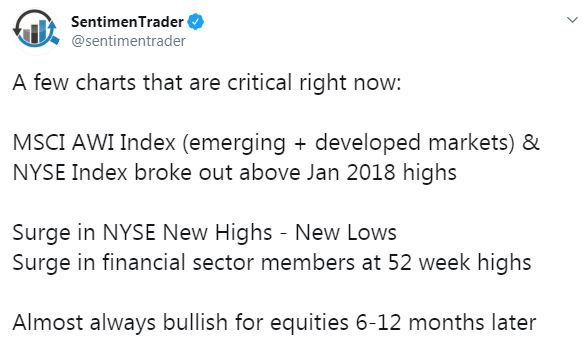
Here is MSCI ACWI:
NYSE Composite:
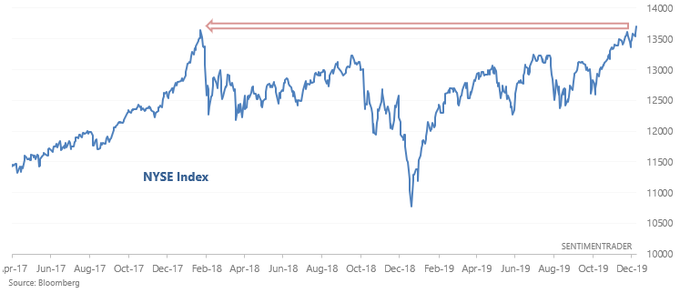
NYSE new highs – lows:
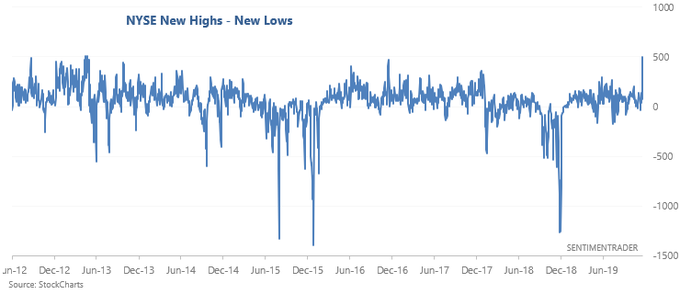
Financials:
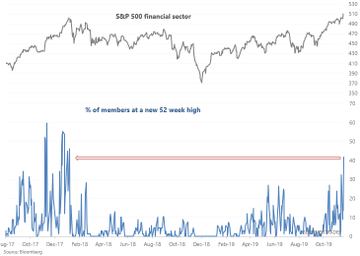
Cross- asset analysis is also supportive of the bull case. The USDJPY exchange rate has been highly correlated with stock prices, and it is rising in line with increased risk appetite.
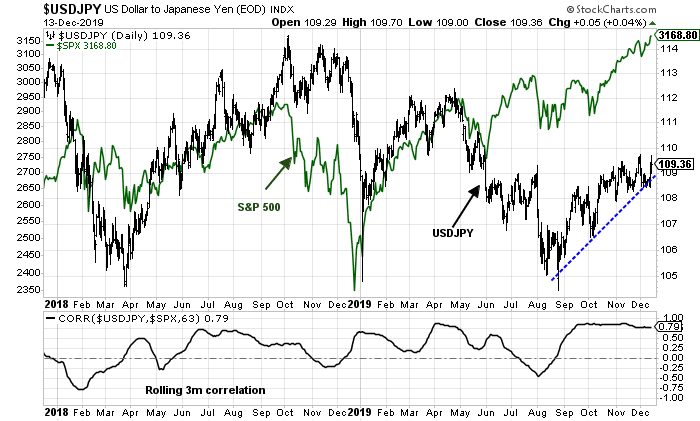
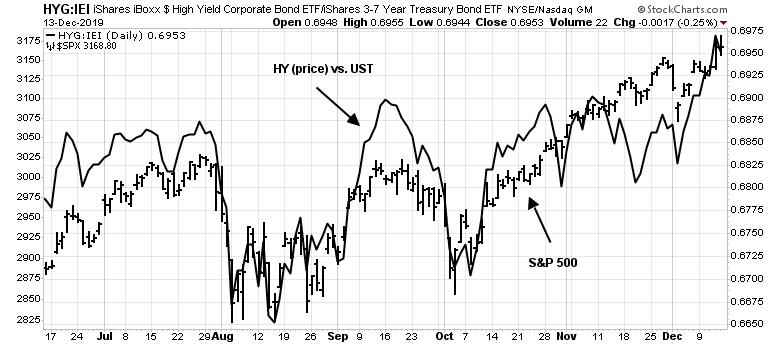
As well, the relative returns of high yield (junk) bonds is confirming the upside equity breakout.
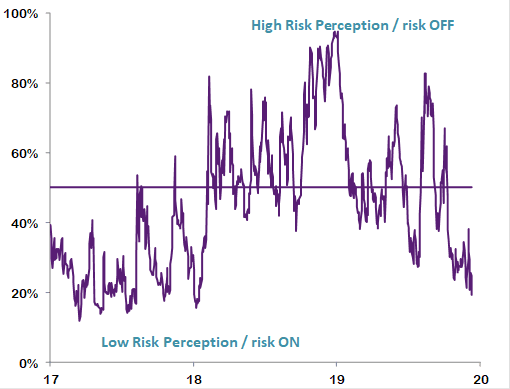
Even before the news of the trade deal, the Natixis Risk Perception Index had been falling, indicating increased risk appetite.
FOMO risk-on!
Bear case
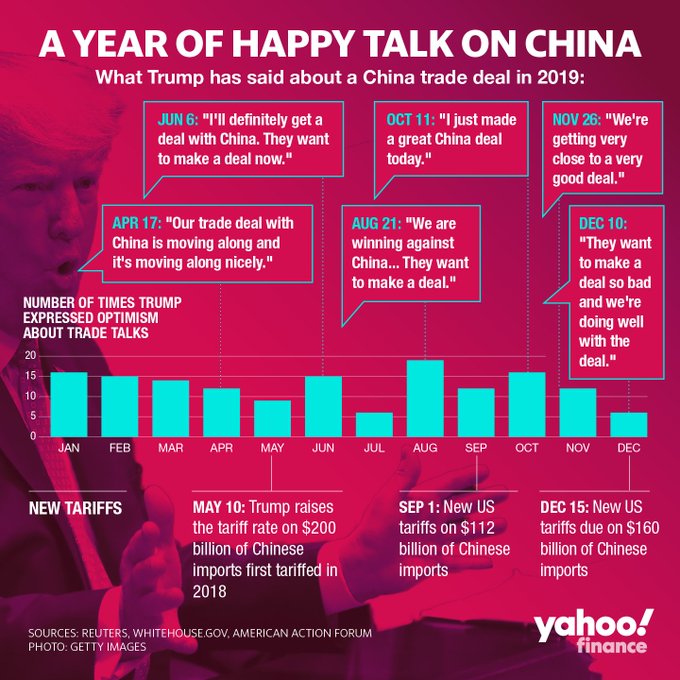
The bear case rests with the details of the fundamentals. First of all, it is unclear what exactly was agreed to in the Phase One deal as a full text has not been ironed out. The devil is still in the details. As Yahoo Finance documented, Trump’s has shown a record of exaggeration when it comes to his statements on China.
Here are some important unanswered questions about the announced Phase One deal as the deal has not been papered by the lawyers.
- What exactly did China commit to on agricultural purchases?
- Is the cut from 15% to 7.5% on $120 billion in tariffs a first step, or will there be more reductions?
- What exactly are the Chinese commitments on IP protection, forced technology transfer, and currency stability?
- What is the dispute resolution mechanism?
Kayla Tausche of CNBC reported the details of Chinese agricultural purchases, as per Robert Lightizer, but those details have not been confirmed by the Chinese. In fact, the Chinese spokesman went out of his way to dodge the question when asked about this topic during their press conference.
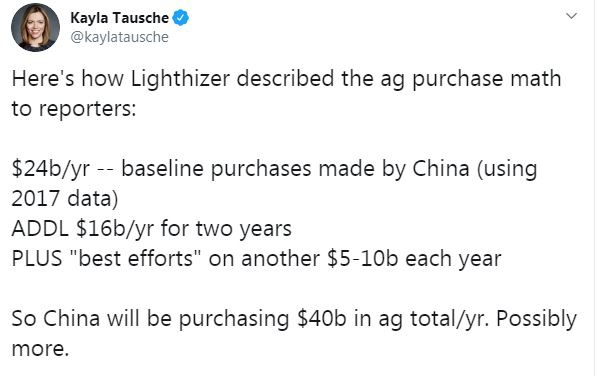
If Lightizer’s statement is to be taken at face value, China has committed to buying about $40 billion a year of agricultural goods from the US, with more on a “best efforts” basis. Brad Setser at the Council on Foreign Relations estimated the scale of Chinese agricultural imports. Chinese agricultural imports from the US his historically topped out at about $20 billion a year, but their total imports amount to between $40 and $50 billion. Technically, the commitment is possible. But even assuming that American farmers could produce that much output, which is questionable, it would mean a significant diversion from other countries. As well, such a surge in Chinese demand for American goowould drive up the price of food for US consumers.
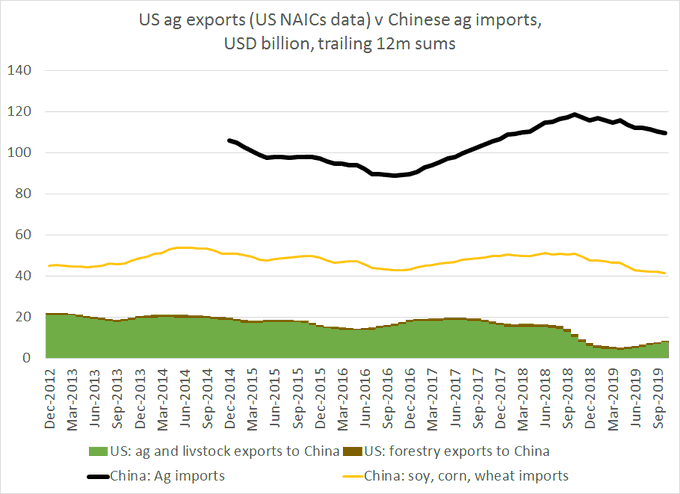
Eunice Yoon of CNBC reported that Chinese negotiators raised concerns over farm purchase commitments. First, China could be challenged at the WTO for a reallocation of purchase from other countries by other countries. As well, the commitment is for a specific value of goods, not specific quantities. If American exports are priced above market, then Beijing would have to order SOEs to buy US farm products and subsidize the imports based on prices paid and market price. In that case, would that open them up to accusations of unfair subsidies?
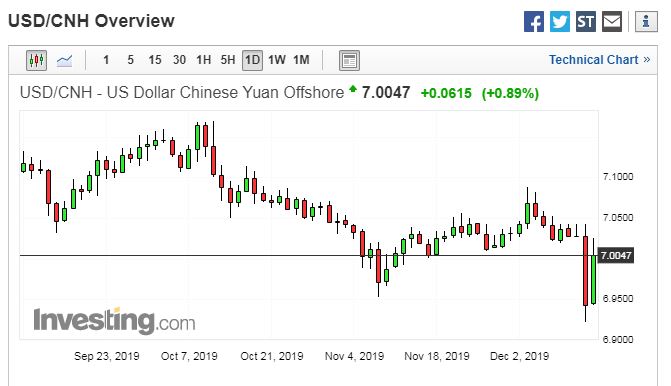
The devil is in the details. We do not have a deal until it is papered and signed. In the meantime, I would monitor the offshore yuan, which rallied on the news of the deal, but retraced most of its gains after many of the details became apparent.
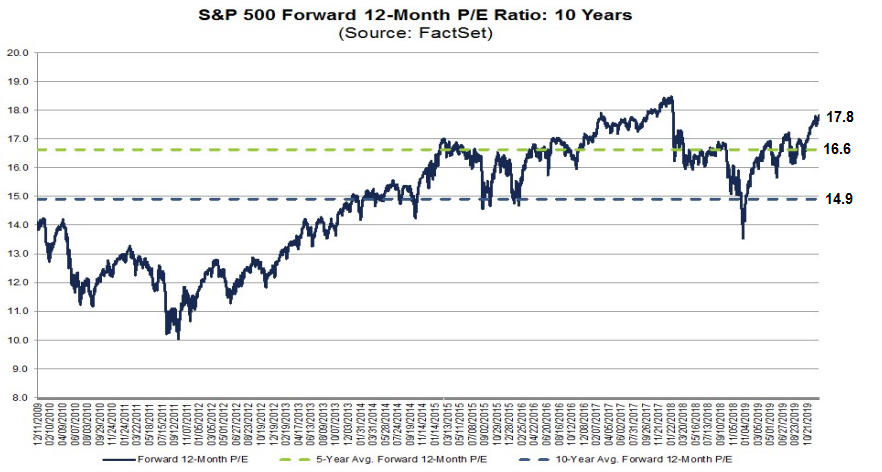
Valuation headwinds
Another problem that the bears raise is the elevated valuation of US equities. FactSet reported that the market is trading at a forward P/E of 17.8, compared to its 5-year average of 16.6 and 10-year average of 14.9. At a 17.8 time forward earnings, the market is nearing nosebleed levels last seen at the peak of the late 2017 market melt-up.
To be sure, forward 12-month EPS is rising again, albeit slowly. The key to the justification of higher prices is a substantial improvement in earnings estimates, based on the combination of a cyclical revival, improved business confidence leading to more business investment from falling trade tensions, and an improved European outlook based on the removal of a disorderly no-deal Brexit.
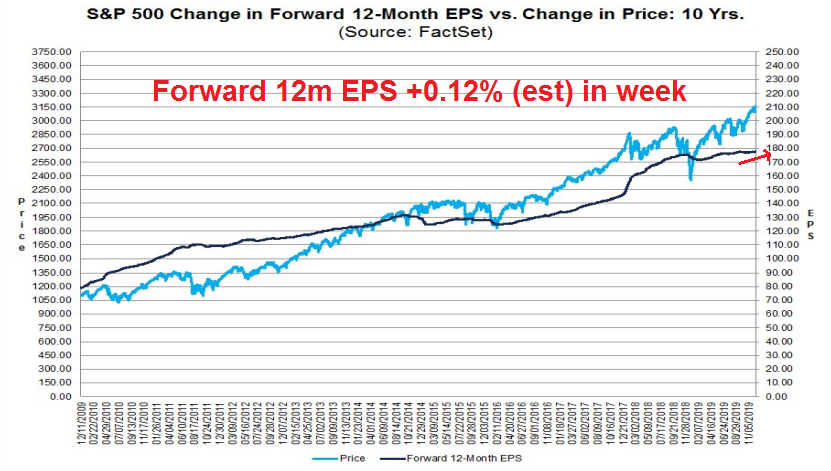
Those are all tall orders. Stay tuned.
Resolving the bull and bear cases
Here is how I resolve the bull and bear cases from a trader’s perspective. There are two news headlines that the market reacted to, the trade deal, and the UK election that took the risk of a disorderly no-deal Brexit off the table.
Unquestionably, there are many unanswered questions around the trade deal. The most immediate effect is to eliminate the threat of escalation of the imposition of December 15 tariffs. At a minimum, that is good news which eliminated an immediate tail-risk. Undoubtedly, we will see more ups and downs as the details of the agreement are ironed out, but those are problems for early 2020.
Boris Johnson’s victory in the UK election is an unequivocal piece of good news for the markets.
In the short run, these circumstances are setting up for a Santa Claus rally into year-end and possibly into early 2020. Hedge funds and institutions were caught short, and they have been engaged in a beta chase into year-end. In addition, liquidity is expected to dry up starting next week, so any buying pressure will affect prices in a more dramatic fashion.
My inner investor is bullish positioned. He is tilted towards European equities where valuations are cheaper, and benefiting from the tailwind of a positive catalyst. My inner trader is long the market. He had been waiting for a pullback to test the early December lows, but that is an unlikely outcome at this point.
Disclosure: Long SPXL
Cam, re Euro financials bullish, as counterpoint, whats your take on Repos and general unwillingness for overnight interbank lending?
I have seen commentary from “nothing to worry about/it’s not QE” to “OMG the banking system is about to collapse”.
My take is this is an issue that has the Fed’s full attention. This implies that they will not allow any tail risk to manifest itself. Powell sounded like he was almost ready to do a Draghi “whatever it takes” moment at the last post-FOMC press conference when asked about repos.
Banks and other financials are a big part of the Value Factor that seems to have bottomed in early September.
OECD leading economic indicator for Global has started to turn up as well as many countries. That’s historically been excellent for stock markets.
Cam, while it appears rates have bottomed, It would also seem that upside is limited. Even a modest increase in the yield curve could have significant ramifications on growth given debt overhang. Would be interested in your thoughts and current view of the level and direction of rates 1-5 years out. Thanks.
I have no specific upside target on rates, either on the short or long ends of the yield curve. All I can say is, as long as the “Fed Report Card” indicator is rising, the positive effects of rising growth expectations are outweighing the negative effects of rising rates and inflation expectations.