Mid-week market update: I am leaving on a seasonal family vacation tomorrow, so posting will be lighter than usual. While the usual weekend publications will continue, tactical market interpretations are problematical this time of year when liquidity is low. However, here are some guidelines on how to think about the stock market for the remainder of 2019.
Recently, there have been more voices calling for a market melt-up. Bloomberg reported that BAML strategist Michael Hartnett called for a SPX target of 3,333 by March 3. Marketwatch also cited bullish forecasts by UBS Global Wealth Management Chief Investment Officer Mark Haefele, and Morgan Stanley’s Michael Wilson.
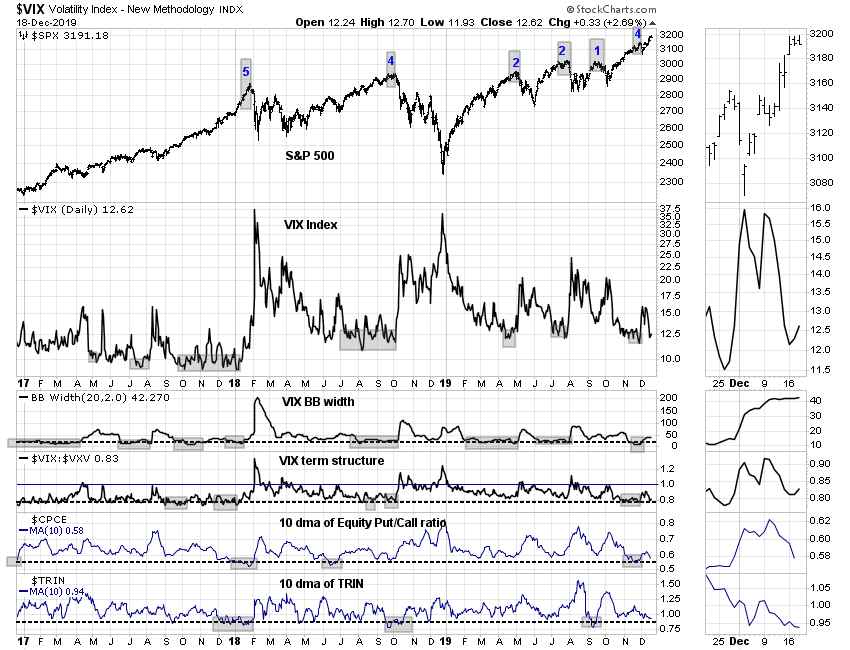
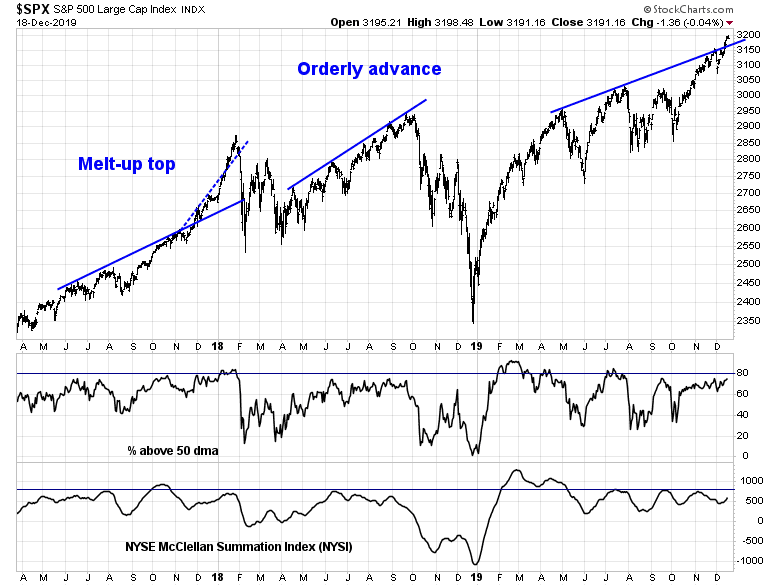
The technical pattern is also starting to look like the melt-up and blow-off top that began in late 2017. The SPX overran rising trend lines (twice) while shrugging off negative RSI divergences. In fact, neither the 5-day nor 14-day RSI flashed any warnings when the market finally topped out in January 2018. Today, the index has rallied above one rising trend line. Compare the late 2017 melt-up behavior with the orderly advance of mid-2018, which never significantly breached the uptrend line. and weakened as RSIs flashed negative divergences. Equally impressive is the NYSE new highs – new lows seen in the current advance.

Is the market melting up?
More room to run
I don’t know. If it is melting up, sentiment models indicate that the market has more room to run. Sentiment is becoming bullish in what seems to be a FOMO stampede, but readings are not extreme yet. Callum Thomas’ Euphoriameter is barely at the bottom of the target zone, indicating more room for the market to become even more euphoric.

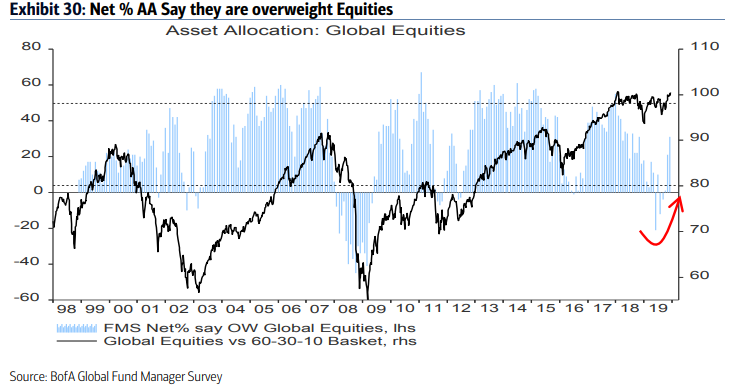
The latest BAML Global Fund Manager Survey shows that global institutions have turned bullish, but readings are only neutral and not extreme.
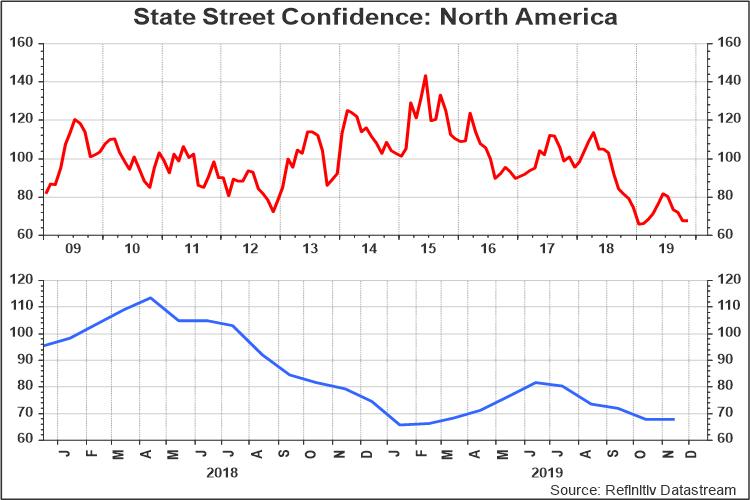
Equally revealing are the State Street confidence surveys of portfolio positioning. Institutions have been piling into European equities.

But they are cautious in North America…
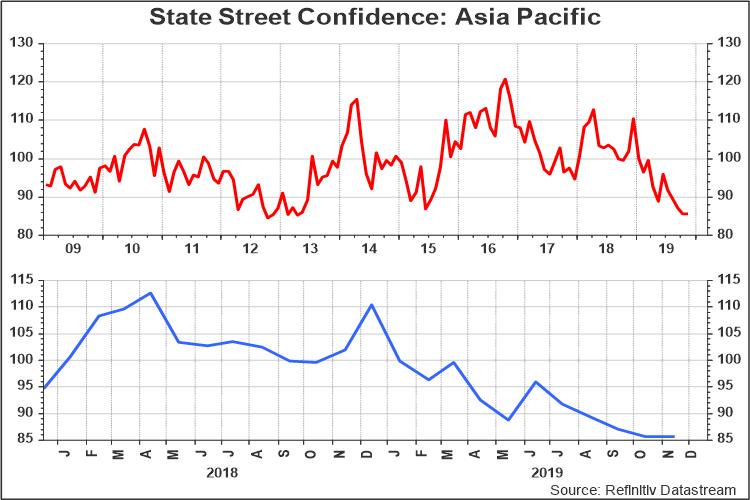
…and in Asia.
In the meantime, global liquidity is strong, and it is creating tailwinds for stock prices.

If this is indeed a FOMO rally, then institutions have a lot more room to pile in.
How to spot the top
Assuming we are undergoing a melt-up, here are some indicators that I would watch for signs that the rally is becoming unsustainable.
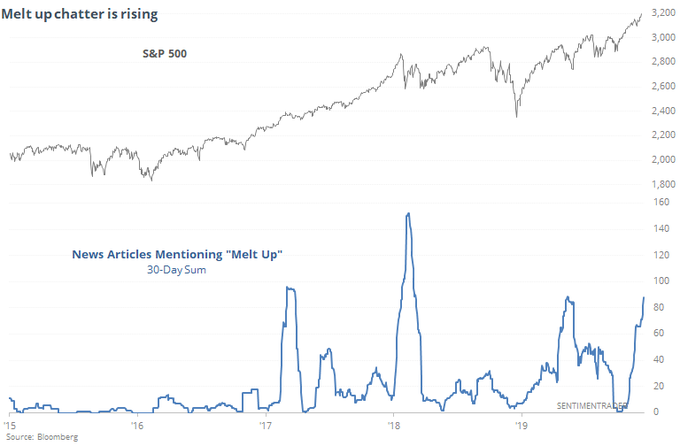
First, SentimenTrader has been monitoring the incidence of “melt up” news articles. We are getting close, but not quite there yet.
My own suite of short-term market sentiment indicators are not flashing warning signs yet, but readings are nearing euphoric levels. Watch this space (readers can see updated charts using this link).
I would also like to see % above 50 dma to rise above 80%, and NYSI to rise above 800 (live link). We are not there yet. In fact, these readings arguably constitute minor negative divergences that point to internal weakness, and not a momentum-driven melt-up. Watch for a breach of rising trend line support for a trading sell signal.
Medium term (1-2 week) market internals, such as net 20-day highs-lows, are reaching short-term overbought readings. But they are not high enough to be consistent with a blow-off top (live chart link).

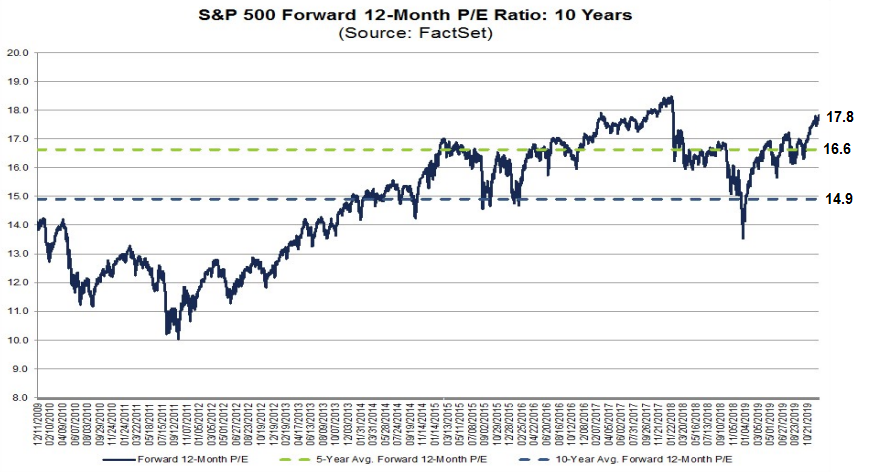
Valuations are becoming extended. FactSet reported that the market was trading at a forward P/E of 17.8, which is above its 5-year average of 16.8, and 10-year average of 14.9. If it were to rise to the levels seen at the January 2018 highs, that would be a cautionary sign, though high valuations do not represent an actionable trading sell signal (see the latest earnings commentary from FactSet analyst John Butters here).
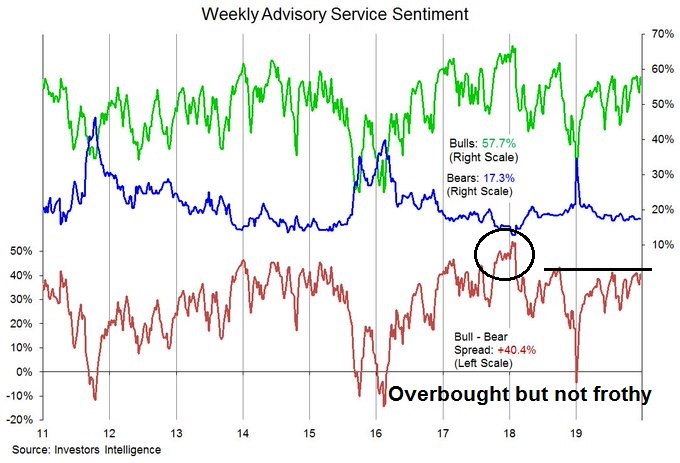
In conclusion, current market conditions can be best described as overbought, but not as frothy as the late 2017 melt-up, as shown by the latest update of II sentiment. We have to allow the market action to dictate the outcome.
Traders and investors have to allow for the possibility that the market is undergoing a melt-up. In that case, traders should be aware that a melt-up is likely to be followed by a meltdown. However, there are a number of signs that can warn traders of an impending blow-off top so that they can take the appropriate action to reduce risk. If, on the other hand, the market is not melting up, traders can use a breach of rising trend line support as a signal to reduce risk.
Just keep in mind the analysis from Ryan Detrick, who pointed out that market seasonality favors an advance in the last half of December – which is why we believe in Santa Claus.

My inner investor is bullishly positioned. My inner trader is also bullishly positioned, but lightly because he is unsure of whether he can monitor the markets while on vacation. Otherwise, he would have added to his long positions by now, but with tight trailing stops.
I’ll be back in the New Year.
Disclosure: Long SPXL
Cam, Have a great break.
Thanks for all your commentaries this year, and I look forward to catching up again next year.
Maybe we’ll see a new decade/new returns piece?
I appreciate it’s an arbitrary calendar event, but…
Cheers,
Brian
Thank you for the great work this year. Have a great vacation & Merry Christmas.
Life is full of outlier events – the markets (driven by crowd behavior) even more so. Last year’s unexpected -7% decline in December may be matched by a rally this month that catches investors equally off guard.
Maybe history will rhyme. Bitcoin peaked around now in 2017…what if now is the peak?
The rally may continue or not but it is time for Santa.
The repo thing makes me nervous though.
Thanks Cam. You are amazing.
Merry Christmas to all. We are in this together.
Cam, for Christmas, I want another Zweig breadth thrust, perfectly called. See what you can do, ok? lol. Have a great holiday!
Merry Christmas and Happy New Year to All.
Cam, Looking forward to another year of posts full of amazing insights and wisdom! Thank you.
Cam,
I have super vacation and thank you for all of your insights!