I was not at my desk and out at some meetings on Monday. When I returned near the end of the day, I nearly fell off my chair when I saw the VIX Index had spiked above its upper Bollinger Band again, indicating an oversold market.
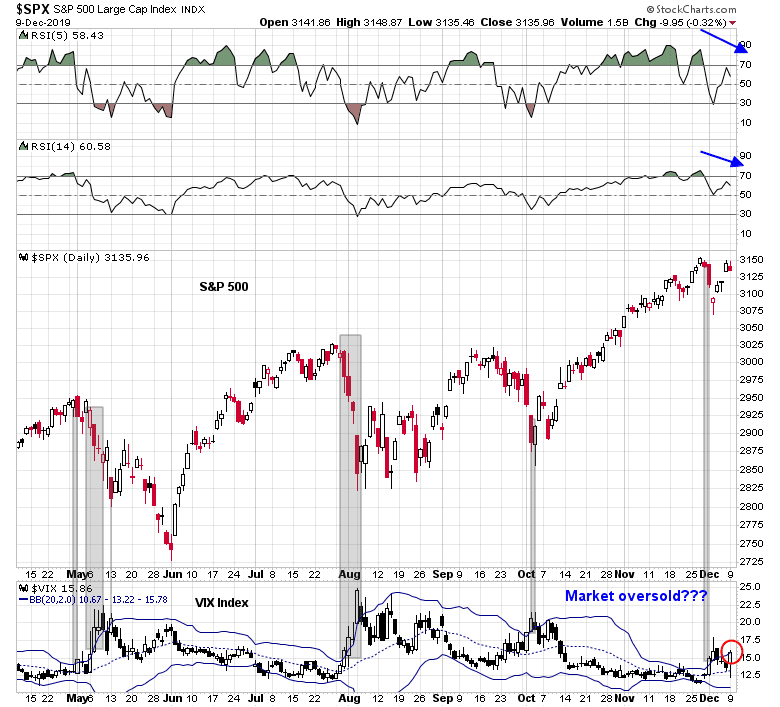
Is the market oversold? Again? So soon?
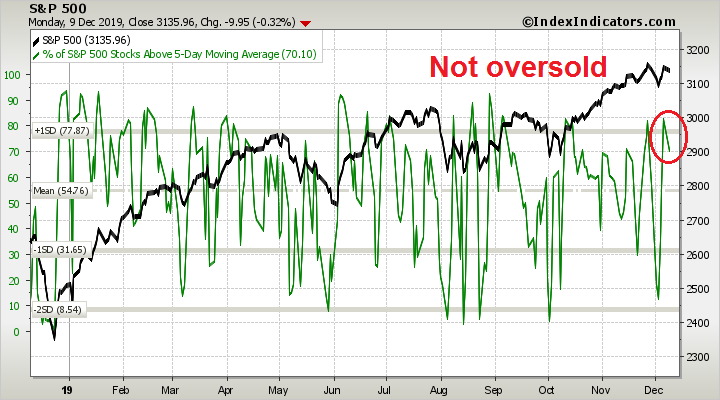
Looking for confirmation
Short-term momentum does not appear to be oversold. In fact, they show a market that was overbought and recycling downwards, which is a short-term sell signal.
What’s going on?
The answer can be found in the VIX Index, which is designed to measure anticipated one-month volatility, and its term structure. In the past, spikes of the VIX above its upper BB have been accompanied by inversions of the term structure. The middle panel shows the short-term term structure. The ratio of 9-day VIX (VXST) to 1-month VIX (VIX) ratio (middle panel) has indeed spike to above 1, indicating rising fear. Other upper BB spikes also saw inversions or near inversions of the 1-month to 3-month VIX (VXV) ratio (bottom panel). The latest episode is somewhat different from the past. While VXST/VIX has inverted, VIX/VXV is still relatively tame.
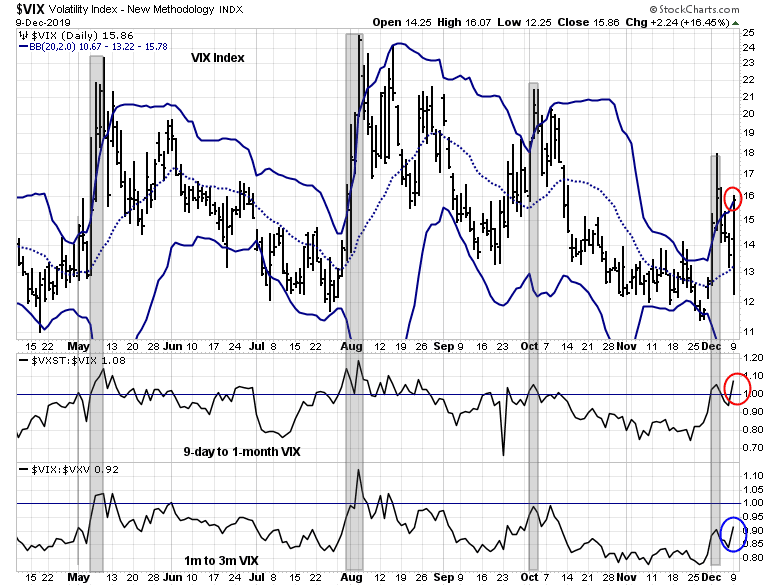
In effect, the VXST ratio iscounting rising short-term volatility, while longer term (VIX and VXV) remain subdued. To put this into English, market uncertainty is rising because of the following events this week:
- FOMC meeting (Wednesday)
- ECB meeting (Thursday)
- Trump`s decision on the December 15 tariffs (technically this weekend, but likely an announcement will occur late in the week)
Viewed in this context, the VIX spike above its upper BB is not an actionable trading signal. However, my inner trader is still long the market for other reasons.
A lesson for investors
The lesson for traders and investors is to avoid relying on any single indicator, and to look for confirmation before taking action.
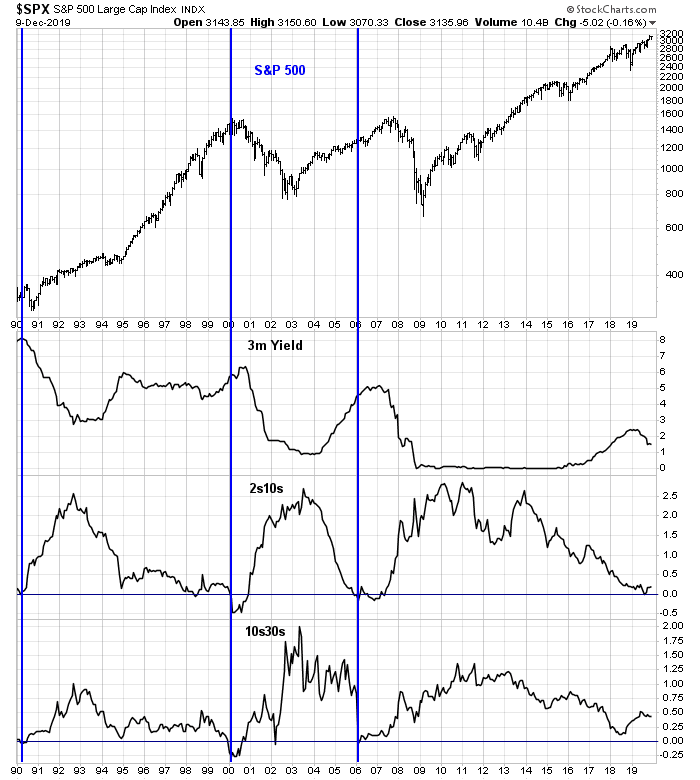
Consider the recent example of the inverted yield curve. Remember how the 2s10s inverted, and all the Recessionistas ran around proclaiming a recession was around the corner?
At the time, I was somewhat dubious about the inverted yield curve as a recession indicator because the entire yield curve had not inverted. In fact, the longer end of the curve, as measured by the 10s30s was steepening. The vertical lines in the chart below shows the instances since 1990 when both the 2s10s and 10s30s had inverted. Equity bear markets followed short afterwards. However, the latest episode is very different from the past 2s10s inversions in two important ways:
- The 3-month T-Bill rate were rising when the 2s10s and 10s30s inverted, indicating that the Fed was tightening. This time, 3-month T-Bill yields were falling, indicating Fed easing.
- The 10s30s had not inverted, indicating the market did not entirely believe economic growth was tanking.
Lessons learned?
Well done.
Good one Cam!
Thanks
Fritz
Lesson learned.