Preface: Explaining our market timing models
We maintain several market timing models, each with differing time horizons. The “Ultimate Market Timing Model” is a long-term market timing model based on the research outlined in our post, Building the ultimate market timing model. This model tends to generate only a handful of signals each decade.
The Trend Asset Allocation Model is an asset allocation model which applies trend following principles based on the inputs of global stock and commodity price. This model has a shorter time horizon and tends to turn over about 4-6 times a year. In essence, it seeks to answer the question, “Is the trend in the global economy expansion (bullish) or contraction (bearish)?”
My inner trader uses a trading model, which is a blend of price momentum (is the Trend Model becoming more bullish, or bearish?) and overbought/oversold extremes (don’t buy if the trend is overbought, and vice versa). Subscribers receive real-time alerts of model changes, and a hypothetical trading record of the those email alerts are updated weekly here. The hypothetical trading record of the trading model of the real-time alerts that began in March 2016 is shown below.

The latest signals of each model are as follows:
- Ultimate market timing model: Buy equities
- Trend Model signal: Neutral
- Trading model: Bearish
Update schedule: I generally update model readings on my site on weekends and tweet mid-week observations at @humblestudent. Subscribers receive real-time alerts of trading model changes, and a hypothetical trading record of the those email alerts is shown here.
A seismic shift ahead
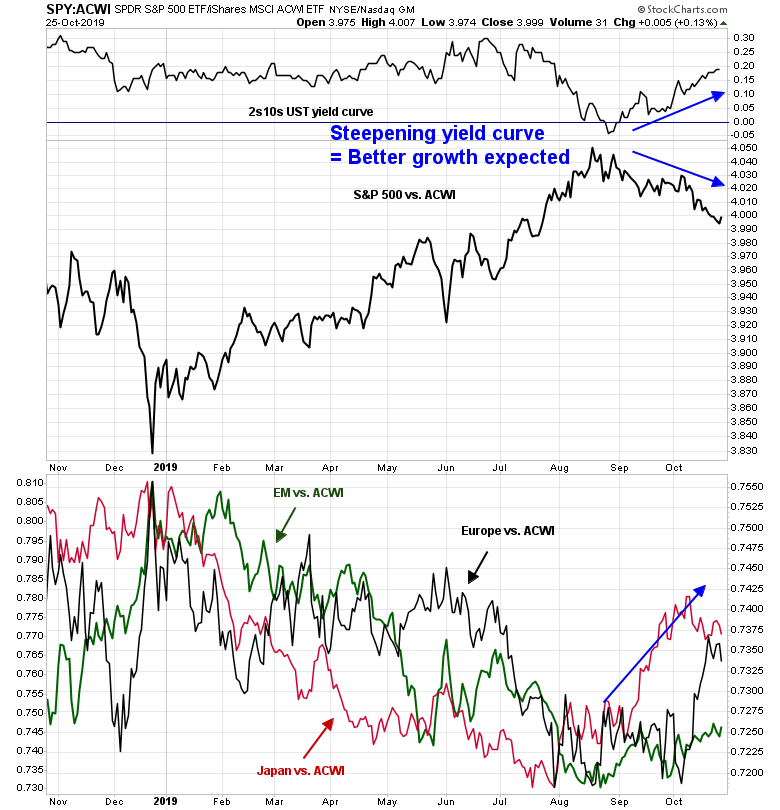
Last week, I highlighted the rising bifurcation of US and non-US equity markets (see The stealth decoupling sneaking up on portfolios). Further factor analysis reveals a possible seismic shift in cross-asset and factor return patterns, beginning with a steepening yield curve that is signaling better economic growth expectations.
To summarize, a factor based review of equity returns leads to the following conclusions.
- Favor non-US equity exposure over US
- Favor value over growth, and avoid high-octane NASDAQ names
- Favor global financials over technology
- Position for a cyclical rebound with exposure to semiconductors, industrials, and US homebuilding
- While the macro backdrop appears favorable, it may be too early for exposure to EM, gold and inflation hedge industries like resource extraction
A factor tour around the world
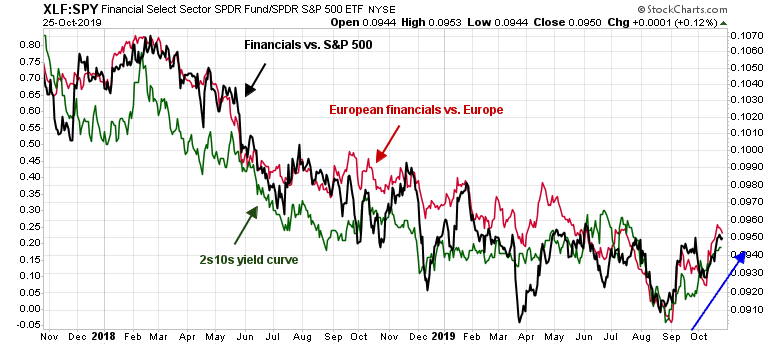
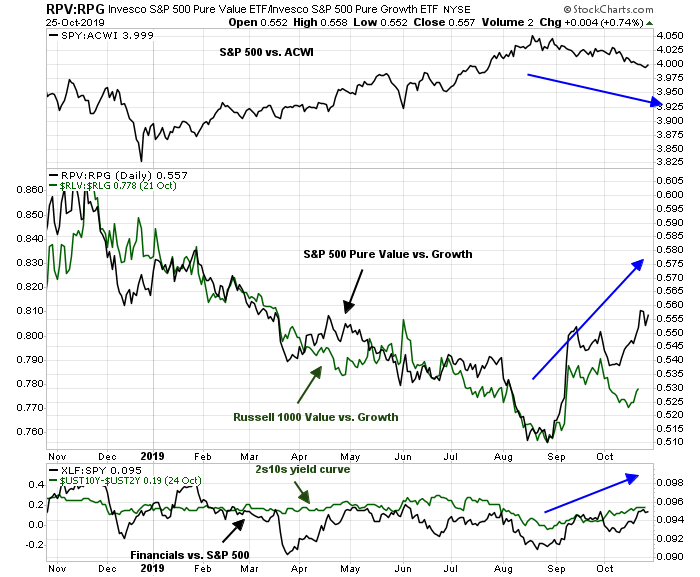
To explain, let us take a factor tour around the world. We begin with the behavior of financial stocks. The relative performance of this sector is historically correlated with the shape of the yield curve. A steepening yield curve is a favorable environment as it benefits institutions which borrow short and lend long. The recovery in this sector is not just limited to the US market. European financial stocks have also been turning up in this environment of better growth expectations.
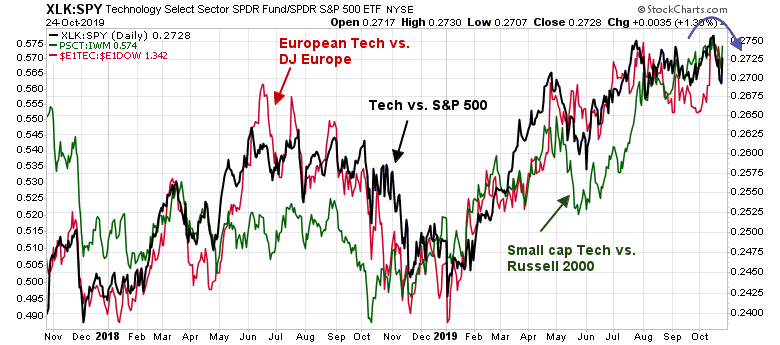
At the same time, the relative performance of technology stocks have begun to roll over. Like the pattern in financial stocks, the relative weakness is synchronized among large cap, small cap, and European technology stocks. Arguably, investors have a lessened need for exposure to this growth sector as a source of growth if global growth expectations are beginning to rise.
A Value revival
This seismic shift in sector performance has also led to a shift in style returns. An analysis of the pure value and growth indices, as well as the Russell value and growth indices, reveals that the biggest differences is a value overweight in financial stocks, and a growth overweight in technology. For the geeks, a word of difference between the two types of indices is warranted. Both methodologies rank stocks by value and growth characteristics. The pure value and growth indices splits the universe in half, and float weights the stocks in each value and growth group to construct the pure index. The Russell value and growth indices, however, will have index constituent overlaps. That way, a value stock will have 20% of its “normal” weight in a growth index, and vice versa for a growth stock in a value index.
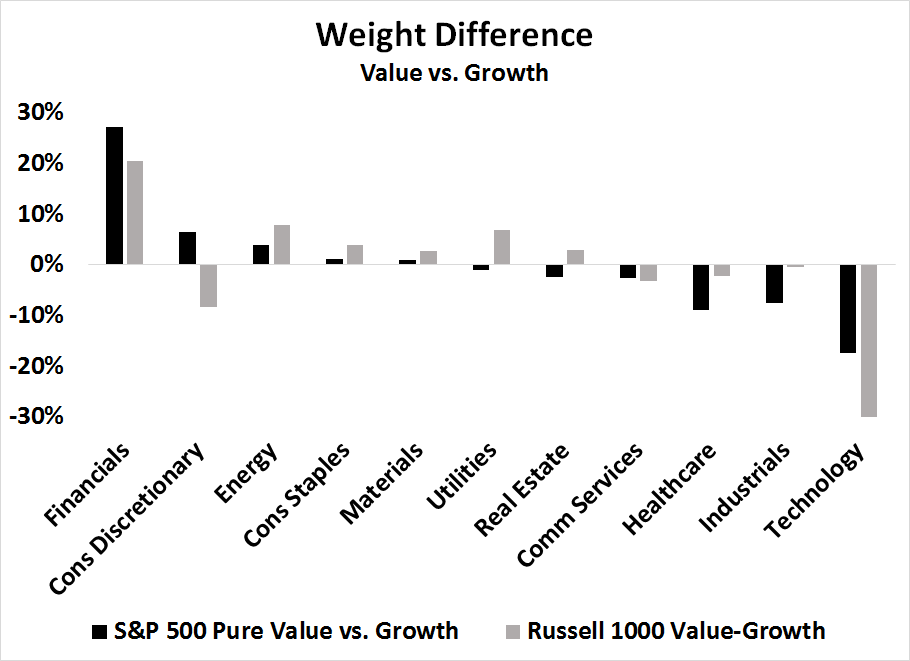
In light of the changes in growth expectations, the changes in return patterns of value over growth are therefore to be expected.
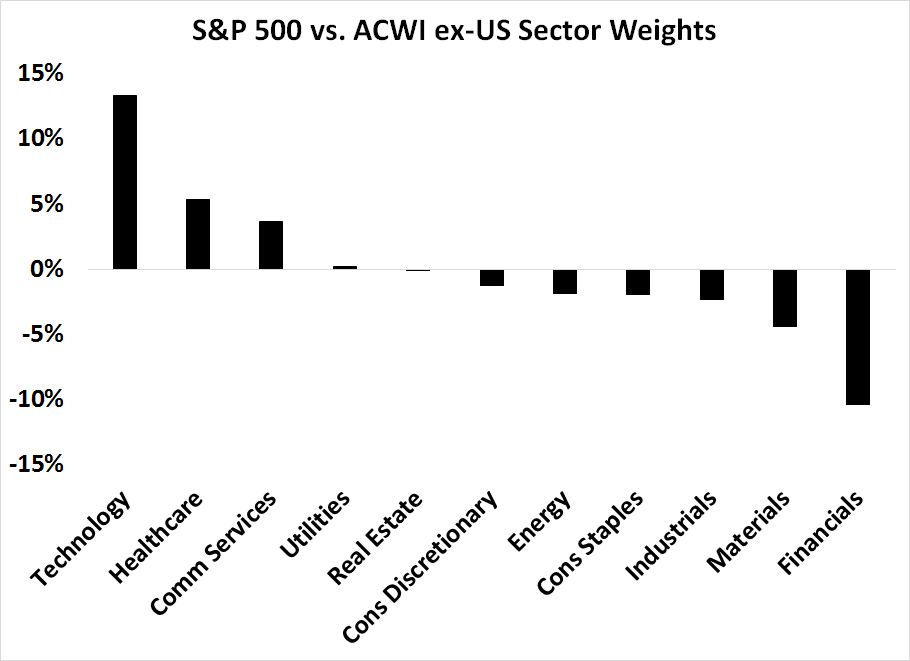
A similar pattern of sector weight differences between value and growth can be found in US and non-US equities. US stocks are far more exposed to technology, while non-US stocks are more heavily weighted in financial stocks.
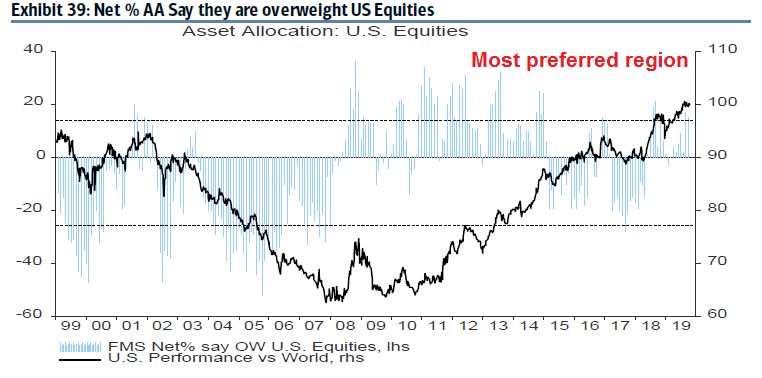
The BAML Global Fund Manager Survey showed that while global managers were roughly market weight equities, their greatest overweight was in the US.
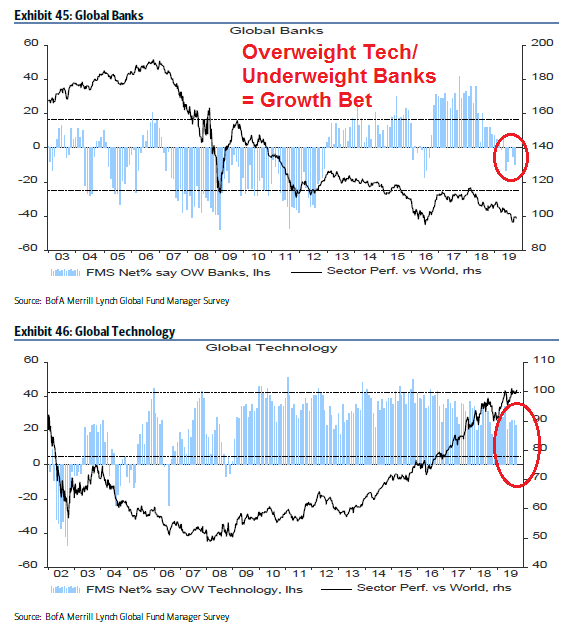
Further analysis of their sector weights shows an underweight position in banks, and overweight in technology. By inference, global institutions have an implicit bet on growth and against value. Should this factor shift continue, watch for them to scramble and reverse those positions.
Signs of cyclical stabilization and rebound
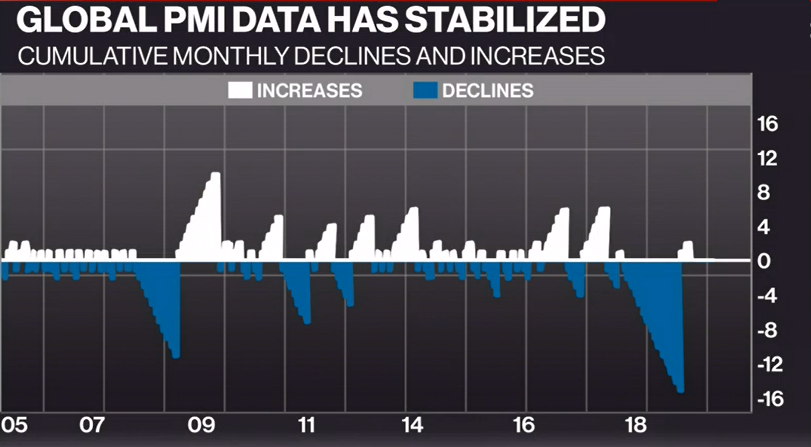
Another silver lining we are seeing are early market signals of a cyclical rebound. For one, global PMIs have stopped falling and they are beginning to recover.
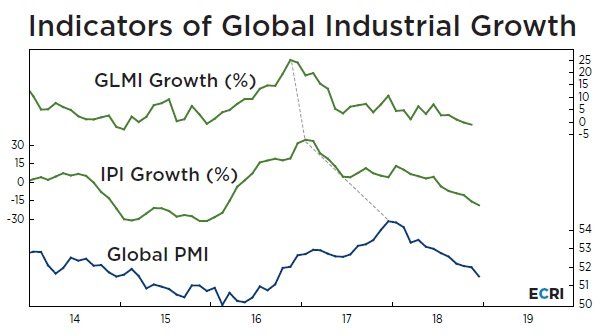
Despite the recent gloom over rising trade tensions, it is possible to see a cyclical recovery without an end to the Sino-American trade war. That’s because Lakshman Achuthan of ECRI observed that a global cyclical downturn began before the start of the trade war.
In hindsight, it’s clear that actual global industrial production growth started slowing at the end of 2017. In other words, the year-over-year pace of increase in the world’s total industrial output began a sustained decline in late 2017. That’s the definition of a global industrial slowdown…
In this case, while the global manufacturing PMI also started easing at the end of 2017, its decline didn’t become evident until a few months into 2018, when the sustained nature of the downturn became increasingly difficult to dismiss as meaningless “noise.” Coincidentally, that’s just about when President Trump began his trade war, slapping tariffs on washing machines and steel and aluminum imports. Because the trade war was front and center, economists thought it was to blame for the drop in PMI and global industrial growth.
Achuthan concluded:
Looking ahead, that means at some point global growth can revive even without the trade war ending. Even so, the recovery will be credited, as always, to the prominent events of the time.
Sean Maher of Entext provided two possible fundamental drivers for a cyclical turnaround in global growth, autos and smartphones:
To sustain the recent rotation toward cyclical value, we need a rebound in two key industrial sectors we’ve been structurally bearish on since 2016/17 – autos and smartphones. In both cases, a technology shift (diesel to hybrid electric in Europe/Euro 6 equivalent in China, 4 to 5G in mobile) and the rapid rise of a second-hand market in China have dented new sales. Those postponed consumption/extended replacement cycle headwinds are now abating – mainstream German car brands have electrified, and buyers of ICE cars worried about residual values can now choose a VW e-Golf over a Tesla.
Indeed, the Ifo survey of German auto sector confidence is showing signs of stabilisation, while annualised output is also likely bottoming at just over 5m units. Last month, EU demand for new passenger cars increased by 14.5% to 1.2m units – the growth is certainly flattered by a low base following the introduction of a new emissions testing regime last year, but its striking that four of the five major EU markets saw double-digit gains. Over the first nine months of 2019, new car registrations were down 1.6% y/y but that should be turning positive into early 2020 – much of the slump in demand has been due to a technical industry transition creating consumer confusion over residual values etc. Tighter emissions standards have also been a drag in China, which adopted the local equivalent of Euro 6 for ICE engines in June this summer – sales have begun to recover since.
As for smartphones, while 5G handsets are still only about 1% of Chinese sales, with 40 cities fully networked by mid-2020 and operators offering 30-40% discounts on 3000-4500 RMB handsets (taking them closer to 4G prices), that proportion should surge toward double digits through H1. Given this upgrade cycle and flattering base effects, the overall market which has been falling 5% or so y/y in recent months should turn strongly positive by mid-2020. Pre-registrations for 5G service are approaching 10m users, even with just a handful of handsets currently available (although dozens more Chinese designs will be launched by mid next year).
As growth expectations have begun to rise, we are also seeing evidence of stabilization and rebound of cyclical stocks. A pattern of a bottom and recovery in cyclical industries is evident in the relative return patterns in the US. Semiconductor stocks, which are highly sensitive to the smartphone theme identified by Maher, have been in a multi-month relative uptrend, and the housing sector has been steadily improving since late 2018.

The stabilization theme is also evident globally. Global industrial stocks are testing a relative downtrend line as it makes a saucer shaped bottom. A similar rounded bottom can also be found in global auto stocks.

Too early to buy gold, inflation hedges
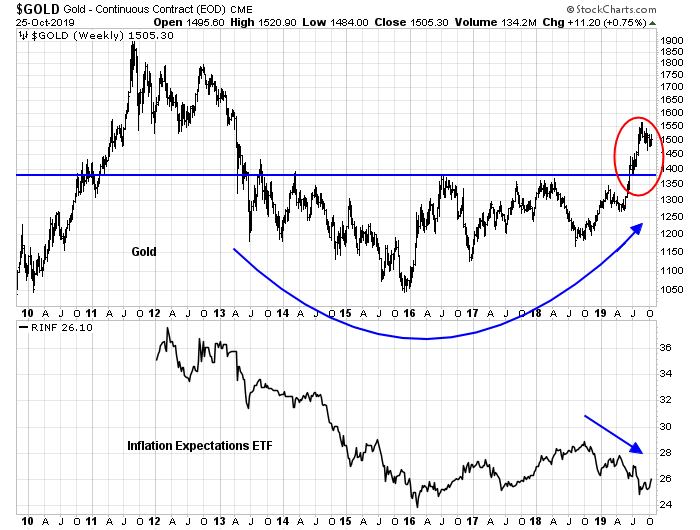
As growth and inflation expectations recover, I am always asked about gold. From a technical perspective, it is still too early for gold and inflation hedge vehicles to make a move. While gold prices have made a definitive breakout from a multi-year base, inflationary expectations are still falling, which creates headwinds for gold and inflation hedge vehicles.
The latest Commitment of Traders report analysis on gold from Hedgopia reveals that large speculators remain in a crowded long position, which is likely to put a ceiling on any price rallies in the short run.

The outlook for resource extraction stocks, which are the main vehicles for inflation hedges, depend on Chinese demand. The relative performance of Chinese material stocks are still flat and falling. The relative performance of energy stocks are still in a relative decline, and mining and materials stocks are only trying to make a relative bottom. While investors may want to consider taking an initial position in these groups, it is too early to expect outperformance.

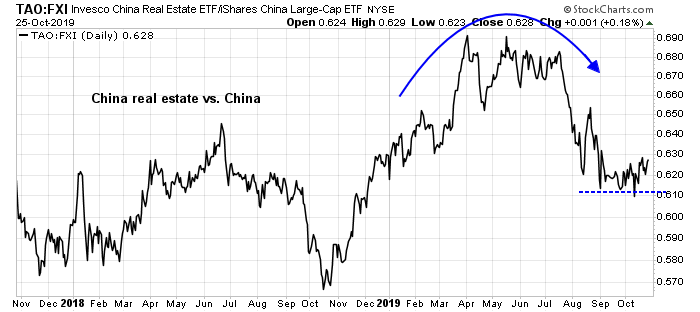
Despite the gloomy outlook for the Chinese economy and Chinese demand for materials, there is a silver lining. The relative performance of China’s property developers appear to have stabilized. These are highly levered companies, and they are very sensitive barometers of China’s financial health because the Chinese population has poured its savings into real estate. The stabilization of their relative performance without any material financial calamities is a signal that the Beijing authorities have been able to manage a soft landing (for now).
Too early to buy EM
Another recent bullish development for global risk appetite is the weakness in the USD. A rising USD has put strains on the global financial system because of the outsized position of offshore EM and corporate debt. The USD Index staged a breakout out of a bullish cup and handle formation, but it recently retreated below the breakout level, which negates the technical pattern. This should provide a tailwind for emerging markets (EM), but EM stocks are only bottoming on a relative basis.
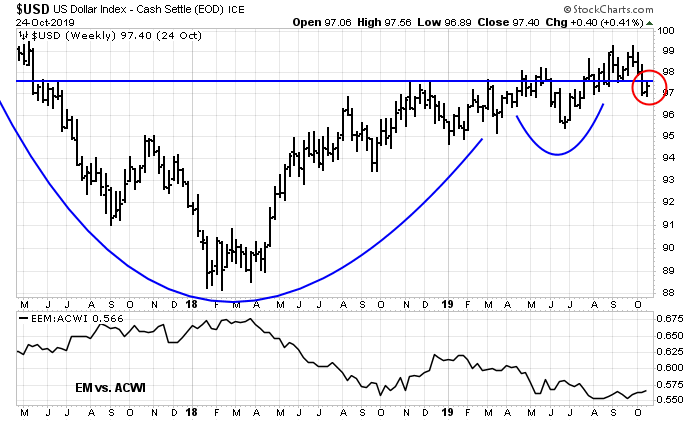
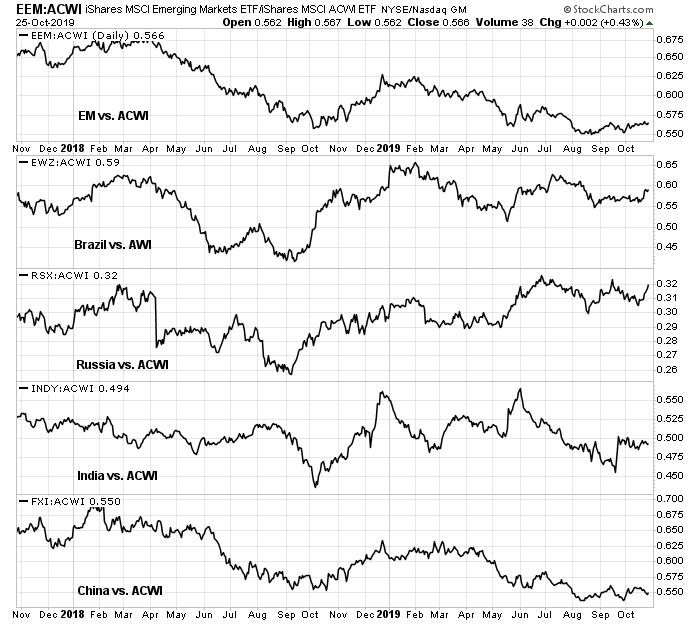
It is probably too early to make a full commitment to EM. The analysis of the relative performance of EM and BRIC countries reveals that two countries (Brazil and Russia) are stabilizing against ACWI, and (India and China) two are still weak. It is too early for EM, wait for some signs of better relative performance.
In summary, a factor based review of equity returns leads to the following conclusions.
- Favor non-US equity exposure over US
- Favor value over growth, and avoid high-octane NASDAQ names
- Favor financials over technology globally
- Position for a cyclical rebound with exposure to semiconductors, industrials, and US homebuilding
- While the macro backdrop appears favorable, it may be too early for exposure to EM, gold and inflation hedge industries like resource extraction
Global institutions appear to be caught on the wrong side of these exposures. Should this seismic shift continue, expect a FOMO stampede of these trends, which should lead to better relative performance in the future.
The week ahead
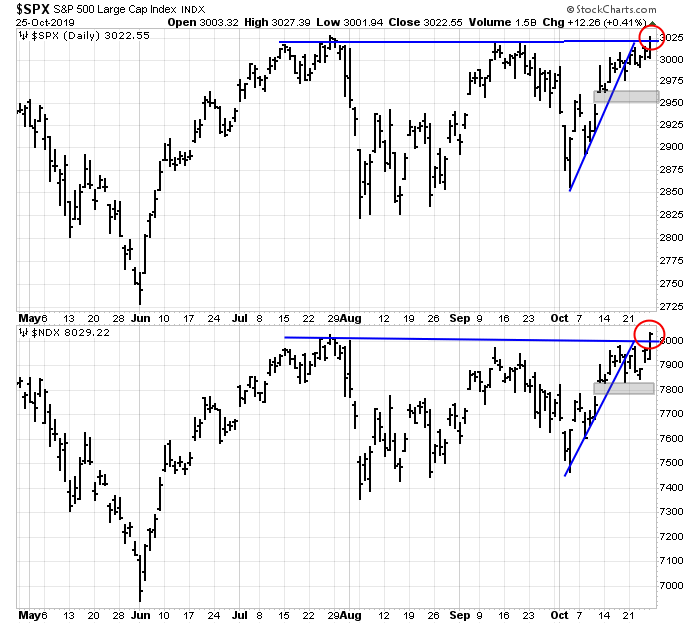
Looking to the week ahead, market direction has been buffeted by bullish long-term momentum and short-term technical and fundamental headwinds. The SPX and NDX had consolidated sideways through uptrend lines last week. The SPX rallied on Friday to test its all-time highs, while the NDX staged an upside breakout. It is said that there is nothing more bullish than an index making fresh highs, but how bullish is this move?
The advance was accomplished on the news of progress in the Sino-American trade talks, but the fundamentals remain challenging. The market trades at a forward P/E ratio of 17.1, which is elevated and equals the levels reached last July.
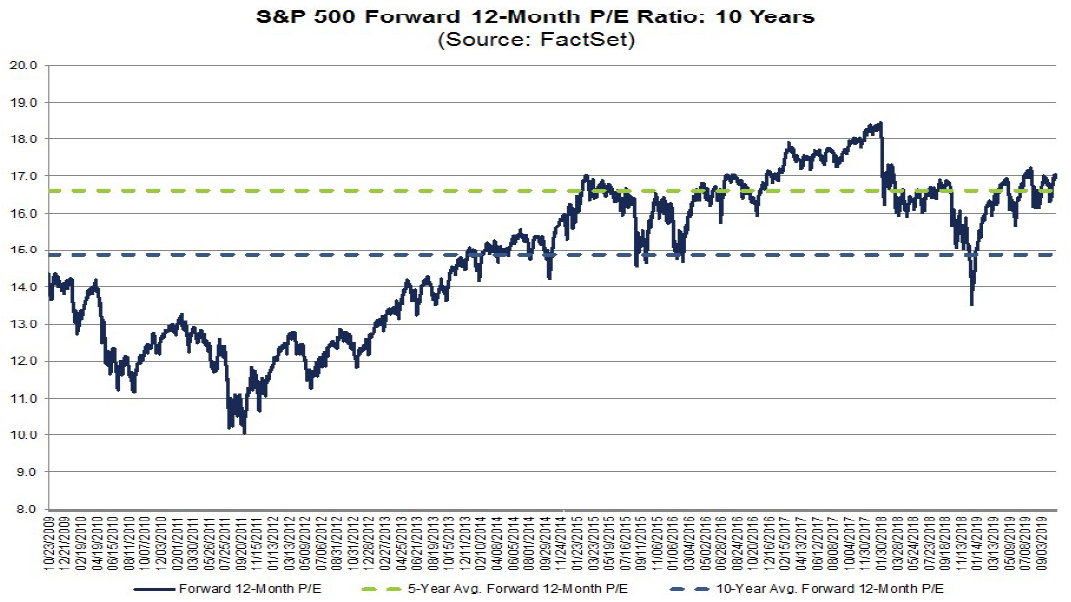
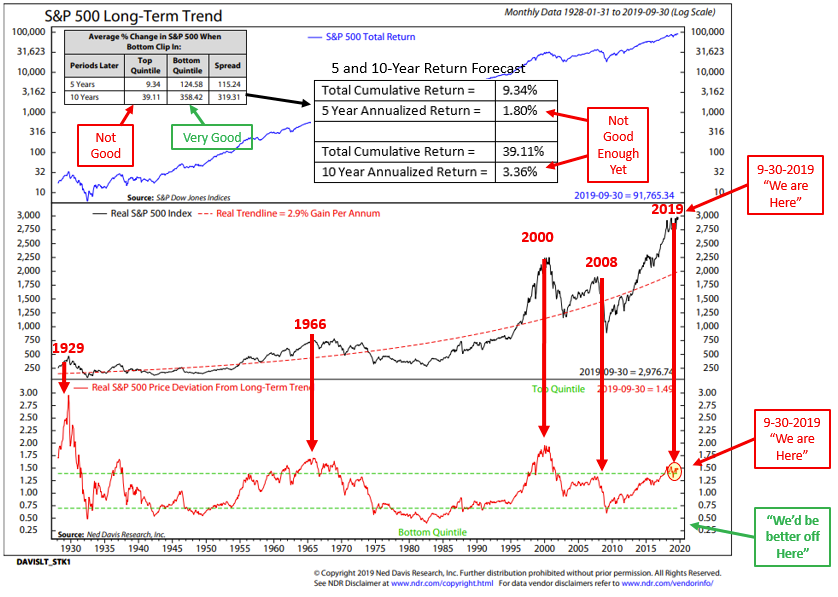
For a longer term perspective, analysis from Ned Davis Research shows that current levels of elevated P/E valuations has resulted in subpar 5-year returns of 1.8% and 10-year returns of 3.4%.
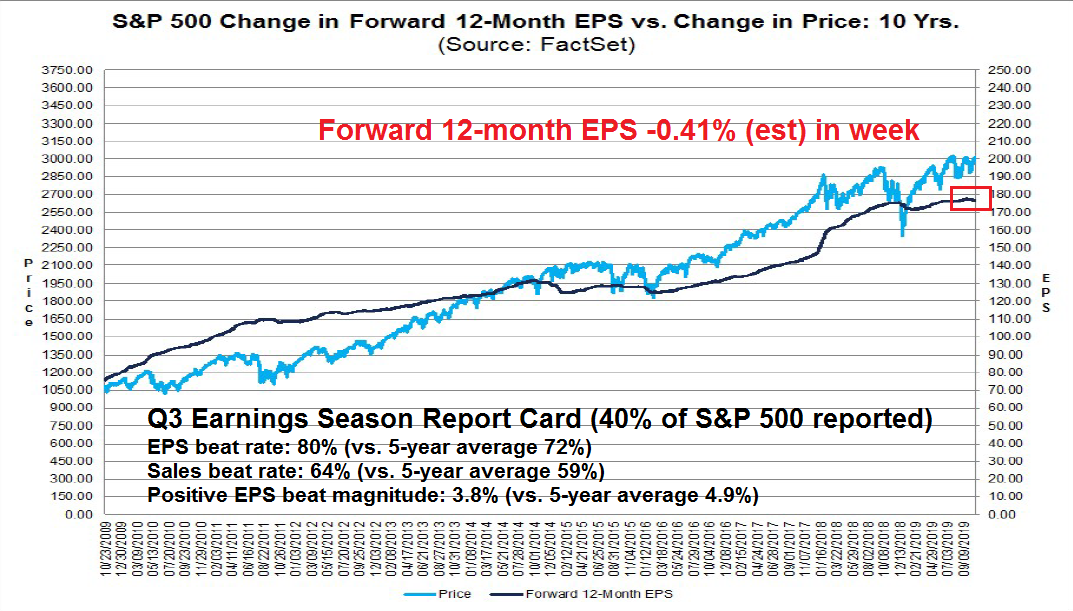
More importantly, the E in the forward P/E is falling, which creates further headwinds for stock prices. Even though the EPS and sales beat rates are well above historical norms, Street analysts are revising down their earnings estimates, and the magnitude of the earnings beats are below average by historical standards.
While it is true that overbought and overvalued markets can continue to advance, technical signals are also flashing warning signs. As the index tests overhead resistance, both the 5-day and 14-day RSI are exhibiting negative divergences, and against a background of declining net highs-lows. In addition, the term structure of the VIX has reached levels indicating complacency. Past episodes have generally seen prices stall and fall.
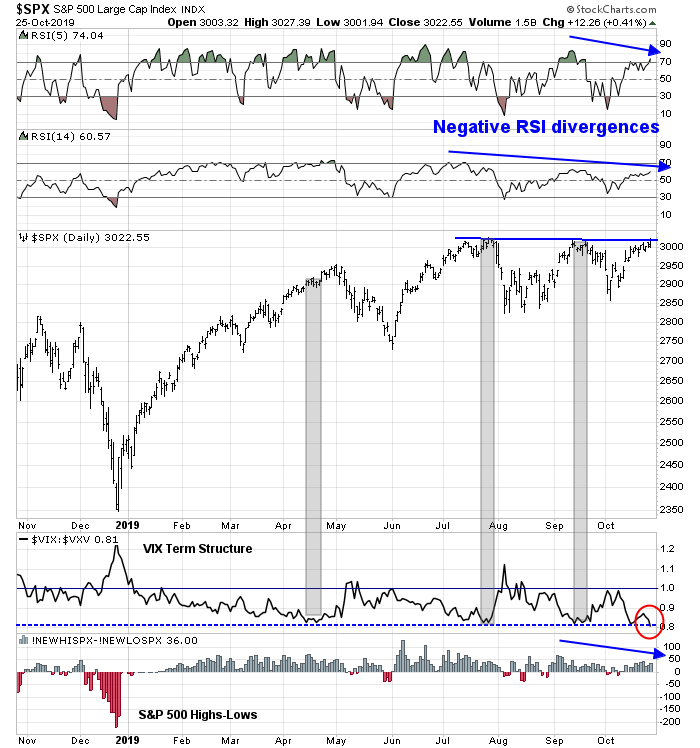
Breadth indicators are mixed, but lean bearish. The most bullish indicator is the Advance-Decline Line, which made fresh highs last week. However, % above 50 dma, % above 200 dma, and % bullish are all exhibiting patterns of lower highs even as the SPX tests resistance.

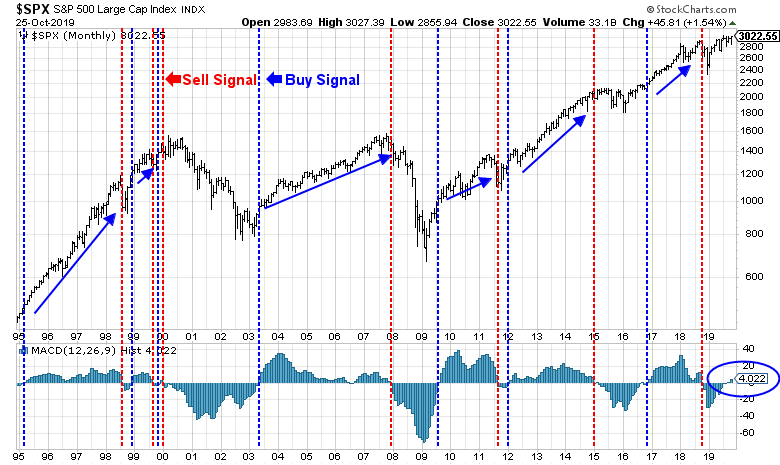
The bearish tilt of short-term trading indicators are offset by powerful longer term bullish forces. The SPX is on the verge of a bullish outside month.

Should the SPX remain at current levels at month-end, it will flash a MACD buy signal, which has been a highly reliable indicator of higher prices ahead.
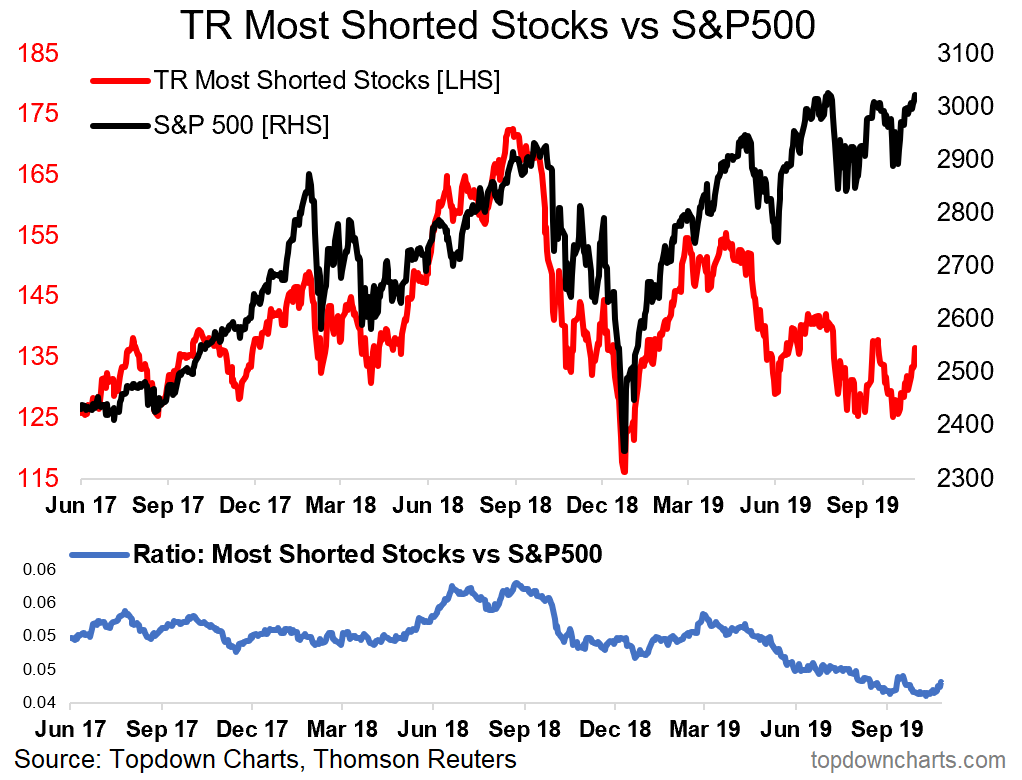
Analysis from Callum Thomas of Topdown Charts shows that the most shorted stocks are lagging the market in this advance This is an indication of genuine investment demand, rather than a “flash in the pan” short covering rally.
While the monthly MACD buy signal has not been confirmed by the broader Wilshire 5000, only minor price gains will push this index into a buy signal.

Similarly, global stocks are also on the verge of a buy signal if the market even stages even a minor advance next week.

From a trader’s perspective, much depends on market action next week. FAANG heavyweight Alphabet will report earnings Monday, with Apple and Facebook reports Wednesday. The FOMC meeting will also end Wednesday, when the Federal Reserve is expected to cut another quarter-point. However, the market expects that this will be the final rate cut for the year. In short, intermediate-term market direction will depend on whether the SPX and NDX can continue to breakout to the upside next week.
My inner investor is neutrally positioned at roughly the equity weight specified by his investment policy. My inner trader is giving the bear case the benefit of the doubt, and he is short. However, he will reverse long should the upside breakout hold next week.
Disclosure: Long SPXU
If the MACD were to signal a break out high next week, would it constitute a long term or trading buy signal?
It would be a LT buy signal. If you look at the chart the market can dip below the buy signal point but downside risk is limited.
Cam,
What are those ETFs that meet the criteria of your conclusions?
Cam, I think these factor, sector, Industry etc . reports are fantastic!
Thanks!!
XLI,XLF are both US sector ETF. Doesn’t fit with the 1st favouring non-US exposure conclusion.
Any suggestions on the industrials and financials sector etf outside of US?
Within the US, consider XLF and XLI
Outside the US, you can consider EUFN (European financials) and EXI (Global Industrials)
Cam, Loved this post. Very helpful. Thank you.
if the interest rates begin to rise, it will affect the affordability of homes. Are you expecting other positive factors to override this negative? Thanks!
The answer is a qualified yes. I would expect the expectations of better growth to offset the effects of higher rates, but you never know about these things.