Preface: Explaining our market timing models
We maintain several market timing models, each with differing time horizons. The “Ultimate Market Timing Model” is a long-term market timing model based on the research outlined in our post, Building the ultimate market timing model. This model tends to generate only a handful of signals each decade.
The Trend Asset Allocation Model is an asset allocation model which applies trend following principles based on the inputs of global stock and commodity price. This model has a shorter time horizon and tends to turn over about 4-6 times a year. In essence, it seeks to answer the question, “Is the trend in the global economy expansion (bullish) or contraction (bearish)?”
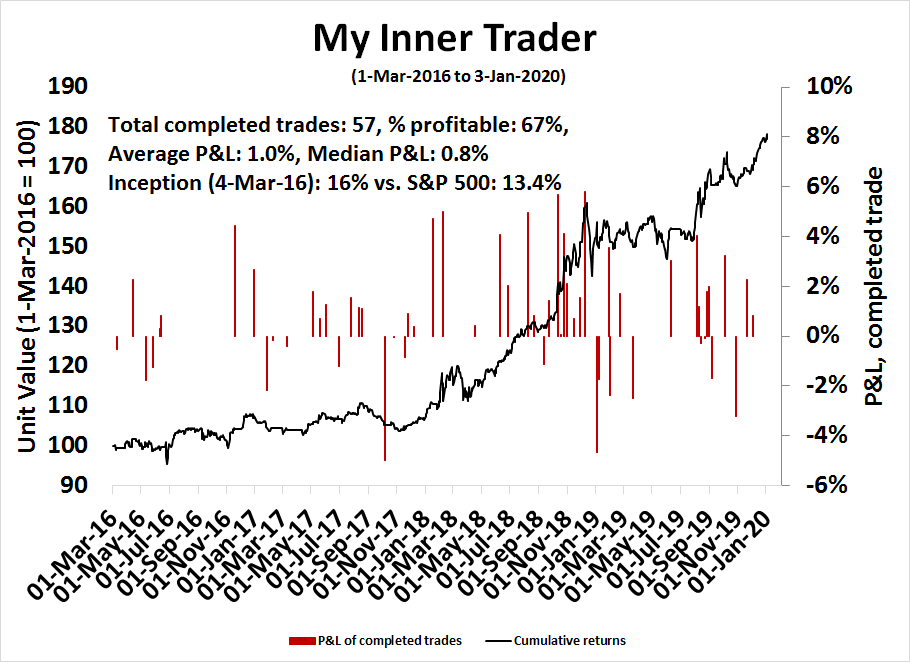
My inner trader uses a trading model, which is a blend of price momentum (is the Trend Model becoming more bullish, or bearish?) and overbought/oversold extremes (don’t buy if the trend is overbought, and vice versa). Subscribers receive real-time alerts of model changes, and a hypothetical trading record of the those email alerts are updated weekly here. The hypothetical trading record of the trading model of the real-time alerts that began in March 2016 is shown below.
The latest signals of each model are as follows:
- Ultimate market timing model: Buy equities
- Trend Model signal: Bullish
- Trading model: Bullish
Update schedule: I generally update model readings on my site on weekends and tweet mid-week observations at @humblestudent. Subscribers receive real-time alerts of trading model changes, and a hypothetical trading record of the those email alerts is shown here.
Melt-up hangover ahead?
Back in mid-December, I rhetorically asked if the stock market was undergoing a melt-up (see Is the market melting up?). At the time, the jury was out on that question. Today, we have the answer. The market is exhibiting the classic signs of a blow-off.
CNBC reported that even the perennial bullish Ed Yardeni, who had a SPX 2020 year-end target of 3500, was openly worried about an air pocket.
″[A] 10% to 20% [correction] would be quite possible if this market gets to 3,500 well ahead of my schedule,” he said.
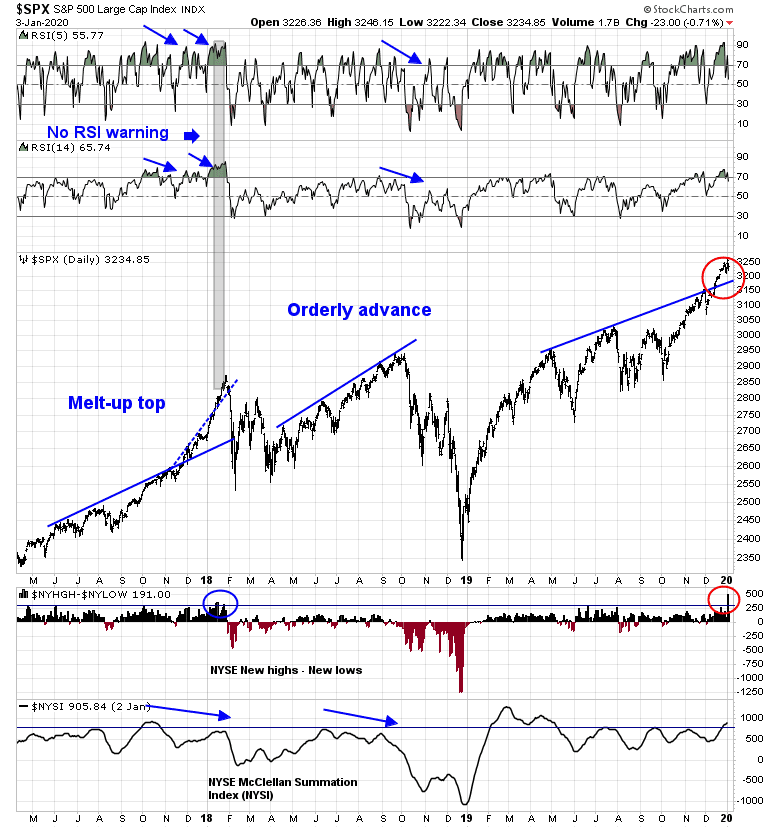
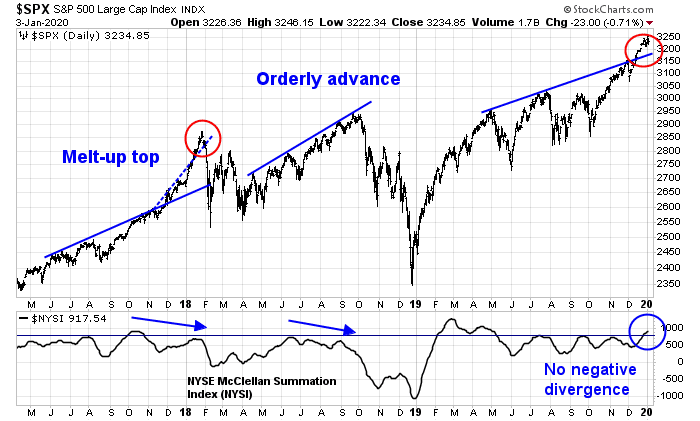
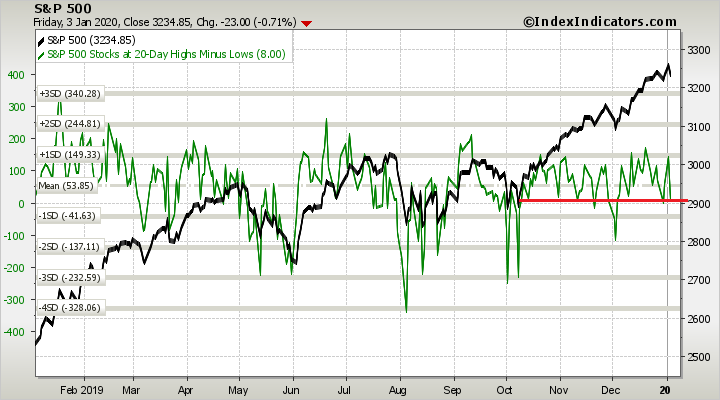
What should traders and investors do? If we were to use the late 2017 and early 2018 episode as a template, there are definite indications that the market has overrun its rising trend line and a soaring net new highs to lows, which are signs of a melt-up. By comparison, the advance in the summer of 2018 was far more orderly. From a technical perspective, there are not the same warnings of an imminent market top that we saw in early 2018. In January 2018, the market broke down without any negative RSI divergences, but did see a negative NYSI divergence. Today, there are neither RSI nor NYSI negative divergences, which could mean that this rally has more room to run.
The market’s risk-off reaction to the killing of Qasem Soleimani certainly presents a challenge to the bulls. Iran has vowed to retaliate for the targeted assassination, and the geopolitical risk premium has spiked as a result. Are we headed for a melt-up hangover? We discuss the bull and bear cases.
I interpret current market conditions as highly extended in the short-term, and equity prices can correct at any time. However, any pullback should be viewed as a pause in the context of a long-term bull.
The market’s knee jerk risk-off reaction to rising geopolitical risk in the Middle East is a test for both the bulls and bears. While fears of a Middle East conflict are spiking, they are unlikely to amount to much in the very short run. Iran has declared a three day period of mourning for Soleimani. Tehran is likely to play the news of the assassination as an opportunity to whip up nationalism and rally public support for its regional military campaigns. Beyond any “lone wolf” attacks inspired by Iranian rhetoric, any significant reprisal operation will takes weeks, if not months, to plan and execute. As the markets have the attention span of a 10 year-old, any geopolitical risk premium is likely to fade if there is no immediate evidence of escalation.
Traders should take steps to either reduce risk, or maintain tight trailing stops. Investment oriented accounts could take steps to rotate into non-US markets. If accounts are restricted by mandate from investing outside the US, consider either reducing equity weights, or selling covered call positions against existing long positions to reduce risk.
The bad news
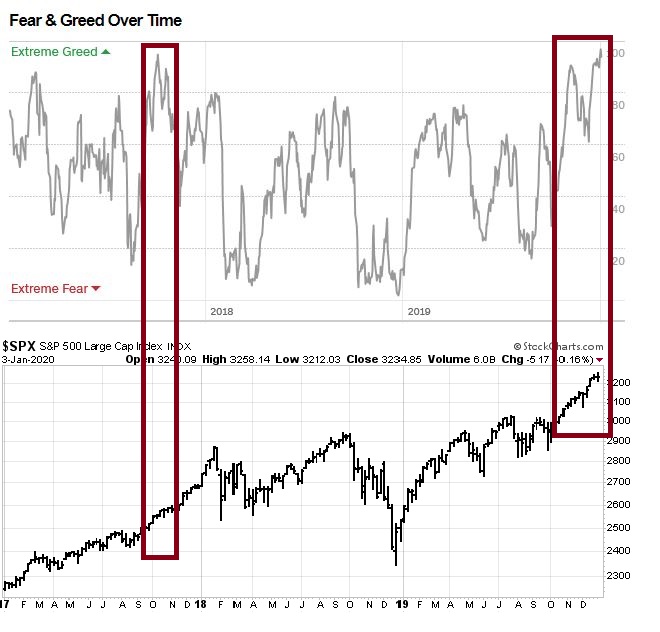
The bear case is easy to articulate. Sentiment has become excessively bullish. The Fear and Greed Index closed Friday at 94, which is an extremely greedy condition. This index does not function well as a tactical trading sell signal, but it is a sign of a rising risk.
Callum Thomas also pointed out that the ratio of leveraged long to short ETFs is at an extreme level.

Valuations are also becoming stretched. Data from FactSet shows that the market’s forward P/E is at 18.3, which is nearly the same level seen at the melt-up peak of early 2018.
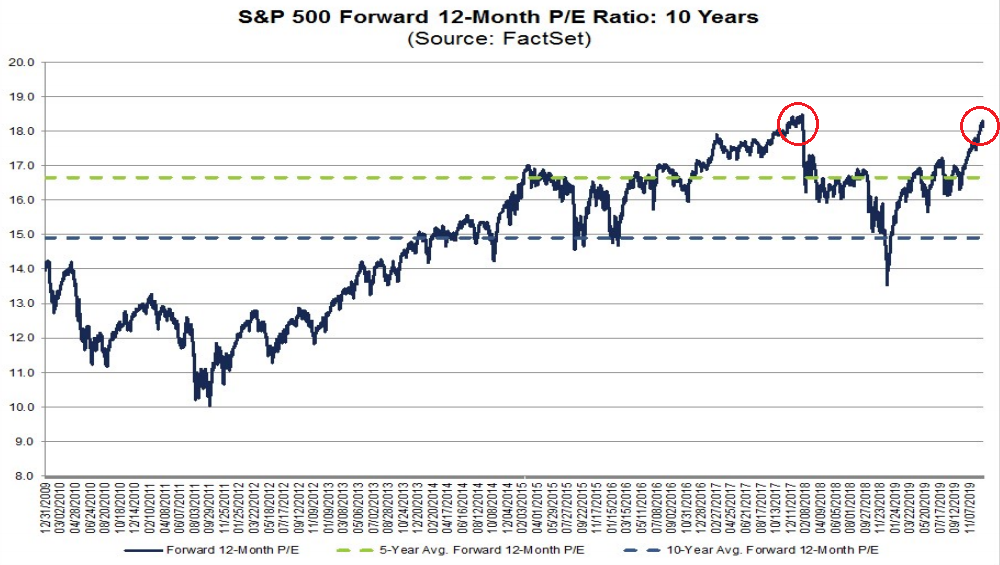
At a forward P/E of 18.3, the Rule of 20 comes into play. As a reminder, the Rule of 20 flashes a warning if the sum of the forward P/E and CPI exceeds 20.
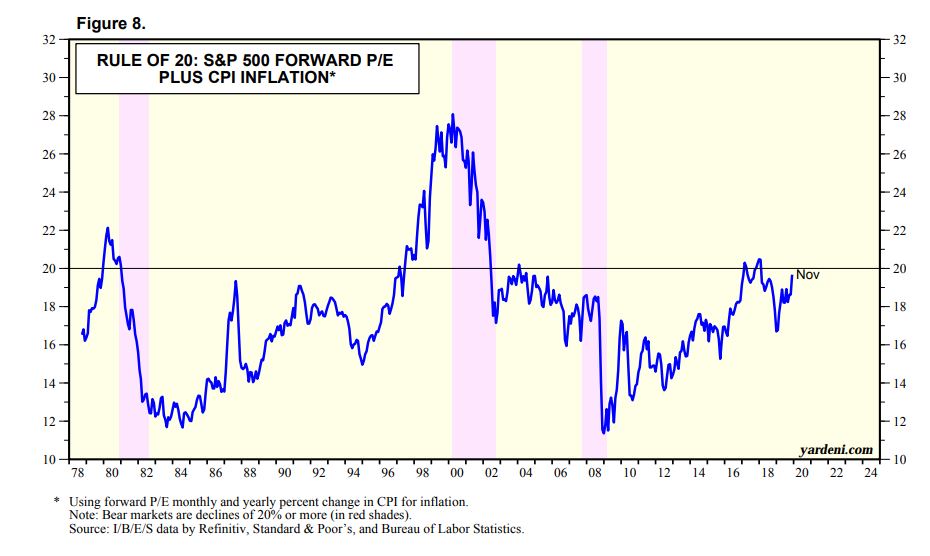
The Rule of 20 has often been cited by Ed Yardeni as a sign of excessive valuation. No wonder Yardeni was growing concerned about a correction.
As well, the market’s confidence about a global cyclical rebound appears to be fading. New Deal democrat has been monitoring the US economy with a series of coincident, short leading, and long leading indicators, is growing worried about the corporate sector, or what he calls the “producer” side of the economy.
The producer recession appears to be deepening, and whether weakness in the producer sector spreads out to affect consumers remains an important and unresolved issue. December light vehicle sales appear to have weakened slightly, and initial jobless claims have turned negative, but consumer spending generally appears positive.
He did qualify his analysis with the caveat that a recession is not in his forecast, but a near-term soft patch for the economy is possible.Watch for possible weakness in the December Non-Farm Payroll Report due this coming Friday.
The long leading forecast remains positive. The short-term forecast remains neutral. The coincident indicators are positive.
The theme of manufacturing weakness and consumer strength was confirmed by the December 23, 2019 publication of The Transcript, which is a monitor of earnings calls and corporate presentations.
The main takeaway is the dichotomy between a US consumer economy that is doing well and a manufacturing sector that is weak. The uncertainty and slow growth will certainly continue into 2020.
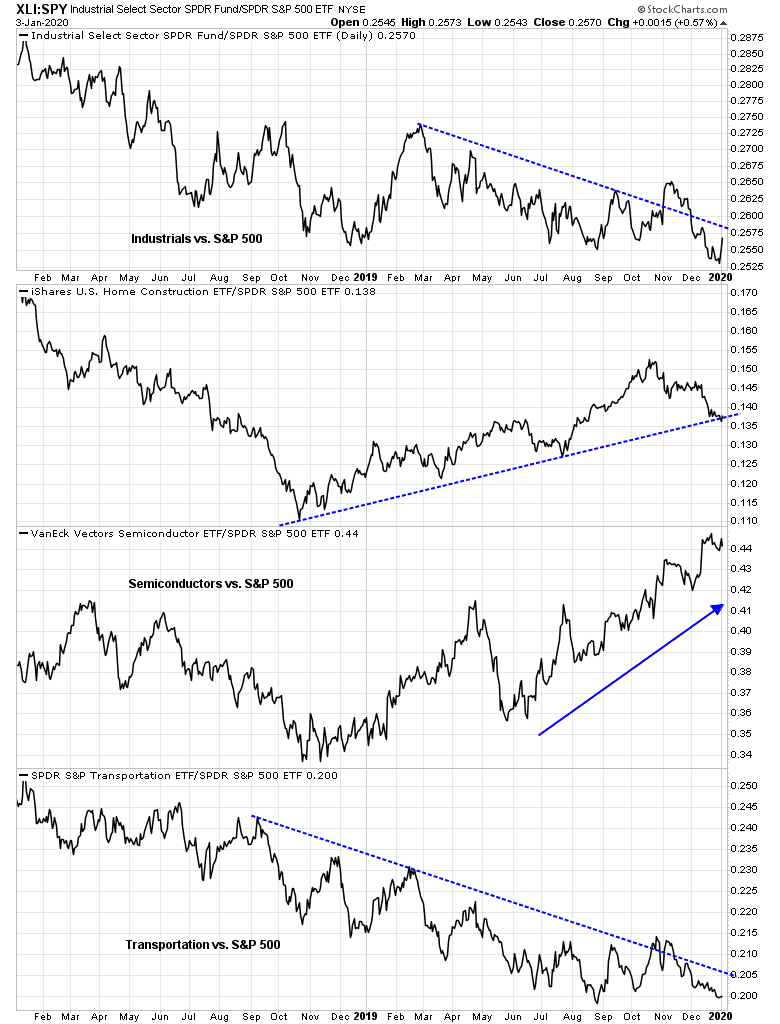
Indeed, my monitor of the relative performance of cyclical US stocks shows that only one out of four groups are in a relative uptrend. While semiconductors remain strong, industrial, homebuilding, and transportation stocks are all losing their leadership positions.
A similar picture of cyclical weakness is developing from a global perspective. Semiconductors remain the leadership, but global industrial and auto stocks are weakening and showing signs of sideways relative consolidation.

The American assassination of Iranian general Qasem Soleimani is just the icing on the bears’ cake. The ensuing risk-off episode has the potential become the trigger for a correction and meltdown after the recent melt-up.
The good news
While the short-term outlook appears dark, here is the good news. The equity bull market is still alive from a long-term perspective. There is no sign of a recession on the horizon. CNBC reported that Goldman Sachs is saying the economy is nearly recession proof. Goldman’s recession model shows recession risk is below 20%, and falling.
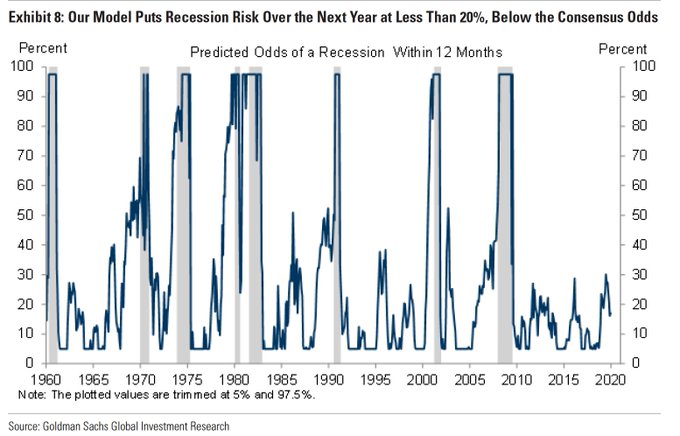
Recessions are bull market killers. In the absence of a recession, equity prices should have a positive bias.

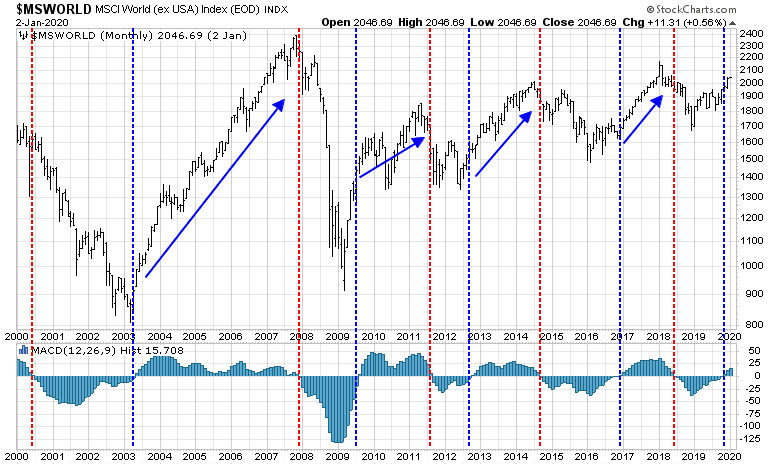
As well, monthly MACD momentum recently flashed long-term buy signals for stocks. These signals have been extremely effective in the past at calling long-term bull markets.
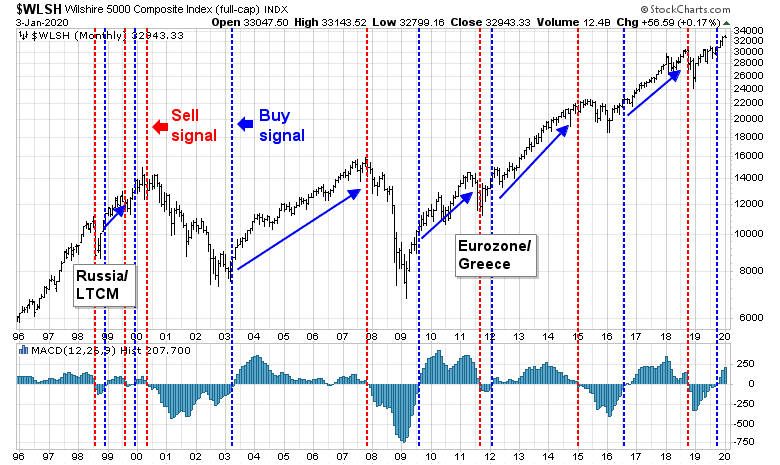
A similar buy signal was also seen for non-US markets.
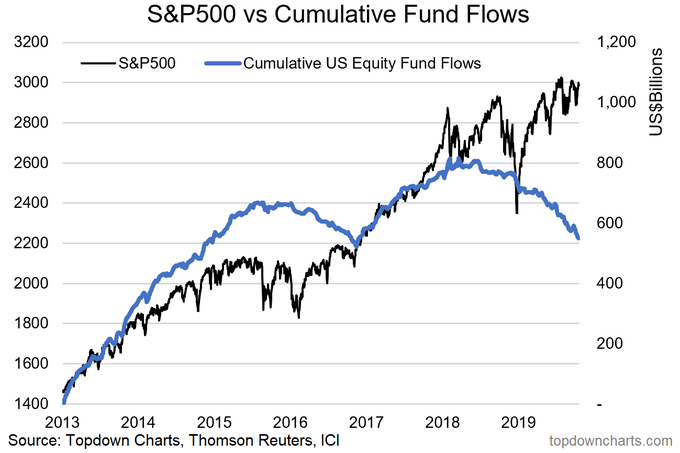
In addition, long-term measures of retail sentiment are showing signs of caution. Callum Thomas of Topdown Charts that cumulative equity fund flows are in a downtrend, which is contrarian bullish.
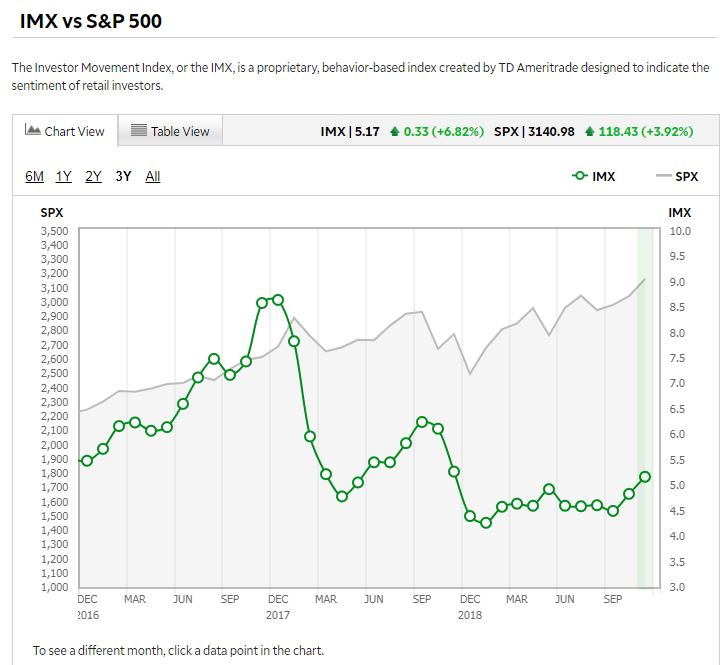
Similarly, the TD-Ameritrade Investors Movement Index (IMX) is also not exhibiting any signs of enthusiasm. Unlike sentiment surveys such as AAII, which asks how respondents feel about the market, fund flows and IMX show what investors are actually doing with their money, which are much better indicators of long-term sentiment.
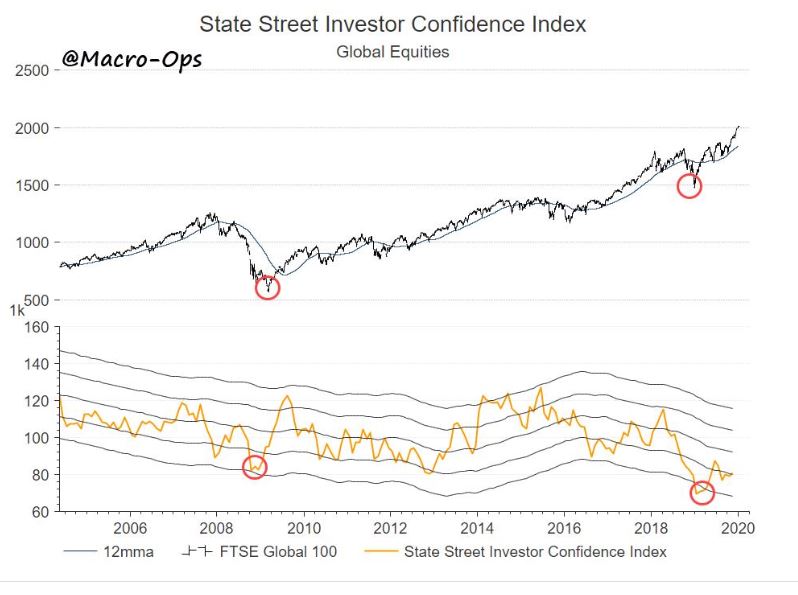
Institutional sentiment has only begun from highly depressed levels. Alex Barrow at Macro Ops observed that State Street Confidence, which is based on aggregate custodial data, bottomed out in December 2018. Confidence has been slowly recovering, and readings are not even back to neutral yet. We are far away from any signs of excessive institutional bullishness.
I interpret these conditions as the bull market has a long way to run before it tops out.
A healthy rotation?
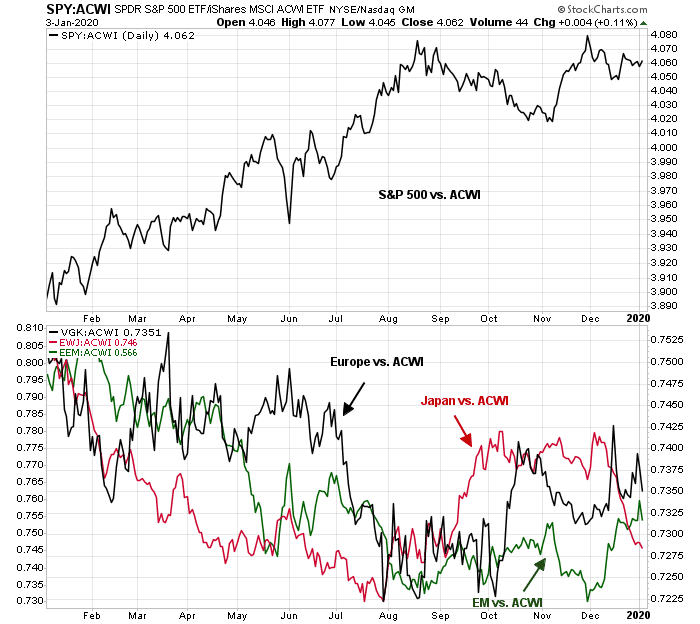
I would argue instead that the bull market is showing signs of a healthy rotation. Leadership is changing from US stocks to non-US markets.
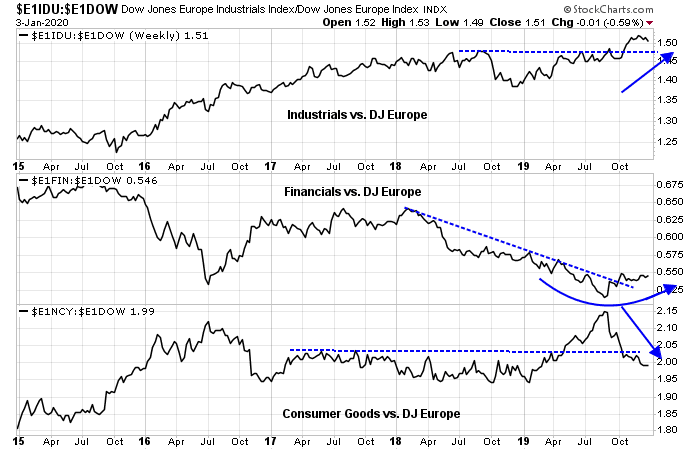
In Europe, the cyclical bull is still alive. Mid-cycle cyclical stocks, such as industrial and financial companies, are consolidating after breaking out of relative downtrends. Defensive stocks, such as consumer goods, are in relative downtrends.
There are also signs of cyclical revival coming from China. China has been the major global consumer of commodities, and market signals indicate that the Chines cycle is turning up. Both the copper/gold and platinum/gold ratios, which are important cyclical indicators, are rising.

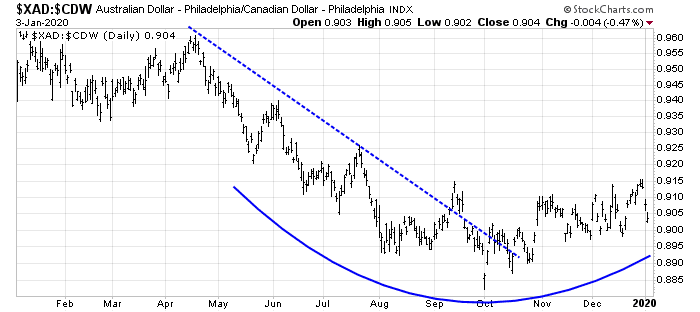
Both Australia and Canada are similar sized economies that are commodity exporters. Australia is more sensitive to Chinese demand, while Canada is more levered to the US. The AUDCAD exchange rate is tracing out a bottoming pattern, which is another market signal of Chinese economic revival.
In addition, the PBOC announced a reserve requirement (RRR) cut last week. Even before news of the RRR cut hit the tape, the relative performance of the cyclical sensitive Chinese property developers and banks has been turning up, which is additional confirmation of another upleg in Chinese growth. The strength of Chinese financial stocks is especially remarkable in the face of the news of rising bond defaults, which I interpret to be a sign that the authorities believe the economy is strong enough to tolerate failures.

As well, the USD has been showing signs of weakness. This should provide a boost to the earnings of US large cap multi-nationals, and create a tailwind for EM economies.

The cyclical rebound is still alive.
Investment implications
What does all this mean for investors and traders?
I interpret current market conditions as highly extended in the short-term, and equity prices can correct at any time. However, any pullback should be viewed as a pause in the context of a long-term bull.
The market’s knee jerk risk-off reaction to rising geopolitical risk in the Middle East is a test for both the bulls and bears. While fears of a Middle East conflict are spiking, they are unlikely to amount to much in the very short run. Iran has declared a three day period of mourning for Soleimani. Tehran is likely to play the news of the assassination as an opportunity to whip up nationalism and rally public support for its regional military campaigns. Beyond any “lone wolf” attacks inspired by Iranian rhetoric, any significant reprisal operation will takes weeks, if not months, to plan and execute. As the markets have the attention span of a 10 year-old, any geopolitical risk premium is likely to fade if there is no immediate evidence of escalation.
Traders should take steps to either reduce risk, or maintain tight trailing stops. Investment oriented accounts could take steps to rotate into non-US markets. If accounts are restricted by mandate from investing outside the US, consider either reducing equity weights, or selling covered call positions against existing long positions to reduce risk.
The week ahead
Looking to the week ahead, there is no question that sentiment has reached bullish extremes, but it is unclear whether the geopolitical shock experienced on Friday represented the bearish break that signals a correction.
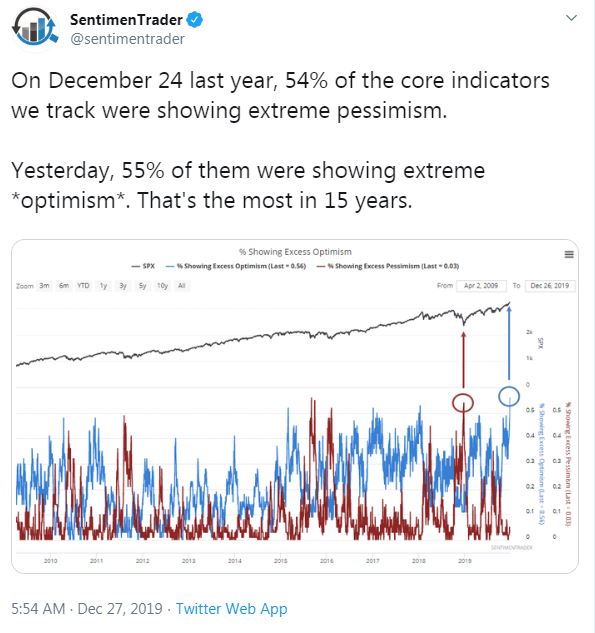
SentimenTrader documented how his sentiment models had reached historically high levels that even exceeded the melt-up high of January 2018.
On the other hand, the technical structure of the market does not support an immediate pullback. Both the melt-up top of early 2018 and the top of 2019 were accompanied by negative NYSI divergences. So far, we have only seen NYSI reach an overbought level, but no negative divergence as the market moved high and NYSI failed to reach new highs.
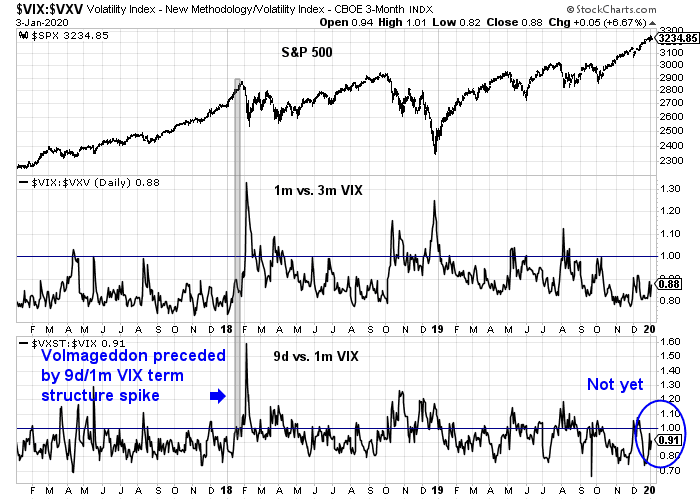
Friday’s market reaction to the Soleimani news was also a little anomalous. Rising geopolitical tensions should see risk premiums spike, and the VIX term structure invert. Even the Volmageddon of February 2018 saw the 9-day to 1-month VIX term structure (bottom panel) invert, followed by the inversion of the 1-month to 3-month VIX ratio (middle panel). Today, the 9-day to 1-month VIX spiked but did not invert, and the 1-month to 3-month VIX barely budged from levels that can be best described as market complacency.
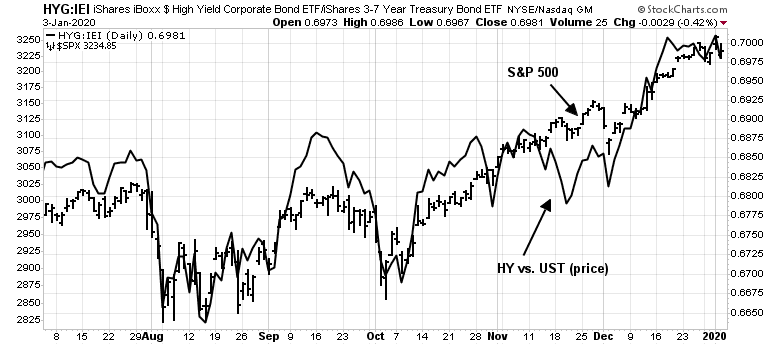
Cross-asset signals presents a mixed picture. The relative performance of high yield (junk) bonds to duration-equivalent Treasuries are not showing neither positive nor negative divergences.
On the other hand, the USDJPY exchange rate, which has been highly correlated to stock prices, has broken down badly. Will the stock market follow?

I interpret these conditions as the short-term bias to be still bullish. My base case scenario is the melt-up is not over. The geopolitical shock represents a welcome test for both the bulls and the bears. Watch for a minor pause in the market, followed by further gains marked by negative divergences and an inverting VIX term structure. Those will be the signals for traders to sell. Assuming my bullish thesis is intact, the market is sufficiently oversold levels for prices to bounce.
To be sure, my base case scenario is only a scenario. The market action in the coming week will be highly informative of market psychology and the market’s technical structure.
In the meantime, my inner investor remains bullishly positioned, though he may opportunistically sell some call options against existing positions in the coming days. My inner trader is also bullish positioned, but he is watching his trailing stops carefully.
Disclosure: Long SPXL
I can’t accept your thesis that the Iran crisis is a trivial event that will be quickly forgotten. With an overbought market,the Iranian situation will be an excuse for “prudent ” profit taking. Risk managers will not be ready to commit new funds until the present situation is resolved. I am long term bullish and short term bearish.
Imagine that Iran decided to bomb an embassy, in the manner of the Beirut or Nairobi attacks. Such an operation would take time to plan. They would have to assemble a team, source the materials, scout the location, and so on. It would take months for this to happen. Meanwhile, do you really think that the market would get spooked for months if there is no visible action?
They may have the infrastructure to cause severe damage in place.This week will most likely reveal a tentative market with a downside bias.We shall see.
1. Soleimani’s demise is more complicated than seen on the surface. This is US’s response to the CCP’s covert operation which killed Taiwan’s military chief of staff and other high ranking officers in a Blackhawk chopper crash just a day earlier. Basically a warning to CCP. Let’s see how deep China wants to get involved in the Iran affairs. That will determine how Iran will respond.
2. Looks like it is open season for assassination from now on. Market might be more volatile than usual. There is no resolution. It is likely to be a new normal. Market will be repriced. Should be a very profitable year for traders, but not for investors.
just wondering if you have any proof of the so-called “covert operation” by the CCP.
I am in Taiwan and even the pro-independence politicians I know of did not have the audacity to make such accusations so I am just curious as to where you got this information from.
Yes, I agree Ching-Yao, I would also like to see some source links, at minimum.
In the meantime, looking ahead in what will be a volatile news year, this is a useful resource to assess the veracity of extraordinary claims…the fun is finding which one it is 😉 https://yourlogicalfallacyis.com/shop
With an impeachment proceeding round the corner, why does one not think that the Iran skirmish is a smoke screen that distracts the news media and the countries’ attention from the real issue (impeachment)?
There is no shame in saying one doesn’t know what’s going to happen and then plan around the uncertainty.
If one expects a high possibility or probability that significant differing outcomes may occur, then a moving average trading strategy will not be perfect strategy but just good. I always remember, ‘Perfect is the enemy of the good.’
Adding a moving average trading strategy for gold bullion (GLD ETF for conservative hedging or gold miners (GDX or juniors GDXJ) for more speculation may be a hedge to think about.
The biggest mistakes I’ve made in investing were when I was confidently positioned when certainty was unknowable.
Well said. The markets are unpredictable, and while there are ways to heighten the odds of a positive outcome our main focus should be to manage risk.
As they say, there’s nothing wrong with being wrong (which usually translates into stopping out for a loss) – but remaining in a position that moves against us to the point of no return is a mistake that shouldn’t be allowed to occur more than the one or two times it takes to learn the most valuable lesson the market has to offer.