Preface: Explaining our market timing models
We maintain several market timing models, each with differing time horizons. The “Ultimate Market Timing Model” is a long-term market timing model based on the research outlined in our post, Building the ultimate market timing model. This model tends to generate only a handful of signals each decade.
The Trend Asset Allocation Model is an asset allocation model which applies trend following principles based on the inputs of global stock and commodity price. This model has a shorter time horizon and tends to turn over about 4-6 times a year. In essence, it seeks to answer the question, “Is the trend in the global economy expansion (bullish) or contraction (bearish)?”
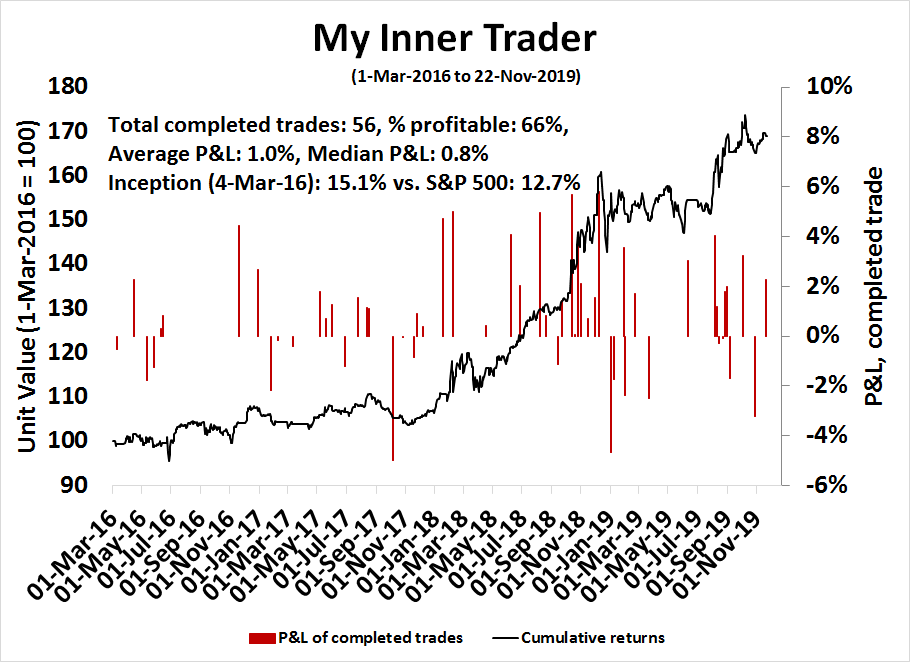
My inner trader uses a trading model, which is a blend of price momentum (is the Trend Model becoming more bullish, or bearish?) and overbought/oversold extremes (don’t buy if the trend is overbought, and vice versa). Subscribers receive real-time alerts of model changes, and a hypothetical trading record of the those email alerts are updated weekly here. The hypothetical trading record of the trading model of the real-time alerts that began in March 2016 is shown below.
The latest signals of each model are as follows:
- Ultimate market timing model: Buy equities*
- Trend Model signal: Bullish*
- Trading model: Neutral*
Update schedule: I generally update model readings on my site on weekends and tweet mid-week observations at @humblestudent. Subscribers receive real-time alerts of trading model changes, and a hypothetical trading record of the those email alerts is shown here.
Cyclical recovery losing steam?
About a month ago, I had suggested that investors position themselves for a global cyclical rebound (see An upcoming seismic shift in factor returns). Since then, the stock market has rallied to fresh highs, and more and more investors have jumped on the cyclical rebound bandwagon, such as Goldman Sachs (via CNBC):
“The equity market is anticipating an acceleration in US economic growth during the coming months,” David Kostin, Goldman’s chief U.S. equity strategist, said in a note Friday. “Investors who want to capture further cyclical upside can improve risk-reward by narrowing their focus to select cyclical stocks.”
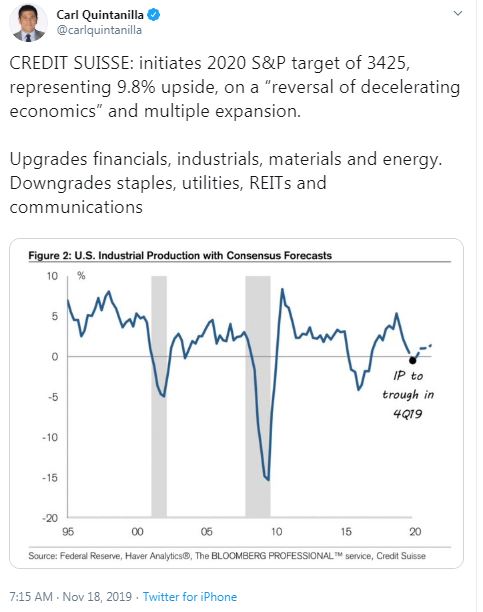
Credit Suisse came out with a similar bullish equity market forecast based on a “reversal of decelerating economics”:
Jim Paulsen at the Leuthold Group is also tilting towards more cyclical exposure.

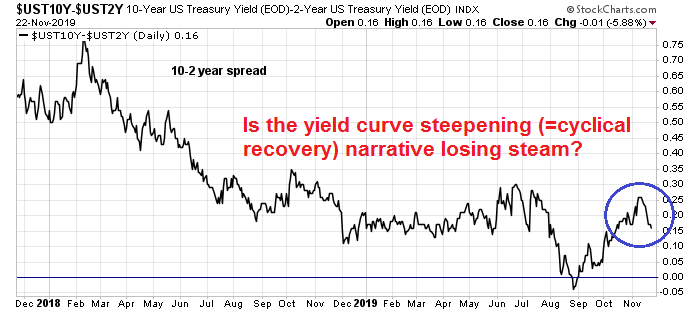
Just as everyone starts climbing on the bandwagon, the yield curve steepened, which is a signal that the bond market expects better growth, but flattened again back to roughly where it started.
It is therefore useful to issue an interim report card on the cyclical recovery thesis, and see how things are going.
To make a long story short, a review of the real-time market-based signals shows that the cyclical recovery investment theme is alive and well. A deeper analysis by region reveals more nuanced details of risks and opportunities.
Of the three major regions, Europe is the most attractive. Market-based signs of a cyclical revival and the reduction of tail-risk are becoming evident. As well, valuations are highly attractive by historical standards. The combination of cheap valuation and a reflationary catalyst gives European equities the greatest appreciation potential.
US equities are more richly valued, but US economic growth is strong and recession risk is low. Trade war risk is asymmetric. Things can’t become much worse and there is far more room for improvement.
China and Asia present a mixed picture of growth. While Chinese data and policy indicate slowing growth, selected Asian data and real-time market-based indicators are suggestive of stabilization and rebound. As long as the tail-risk of a disorderly unwind of China’s debt problems do not appear, I am inclined to give the cyclical bull case the benefit of the doubt.
Global outlook: So far, so good
Our review will start with a big picture global perspective, then shift its focus on the three major trading blocs of the world economy, the US, Europe, and China and Asia. A month ago, I had highlighted the analysis of Sean Maher, who suggested that two catalysts for a cyclical turnaround could be a shift and replacement cycle in autos as Europeans shift from diesel to electric vehicles, and the 5G smartphone upgrade, led primarily by China.
Consider how some real-time market based indicators are performing. These are especially useful because they do not depend on reported economic statistics, which can be backward looking, but adjust instantaneously to new information as they arrive in real-time.
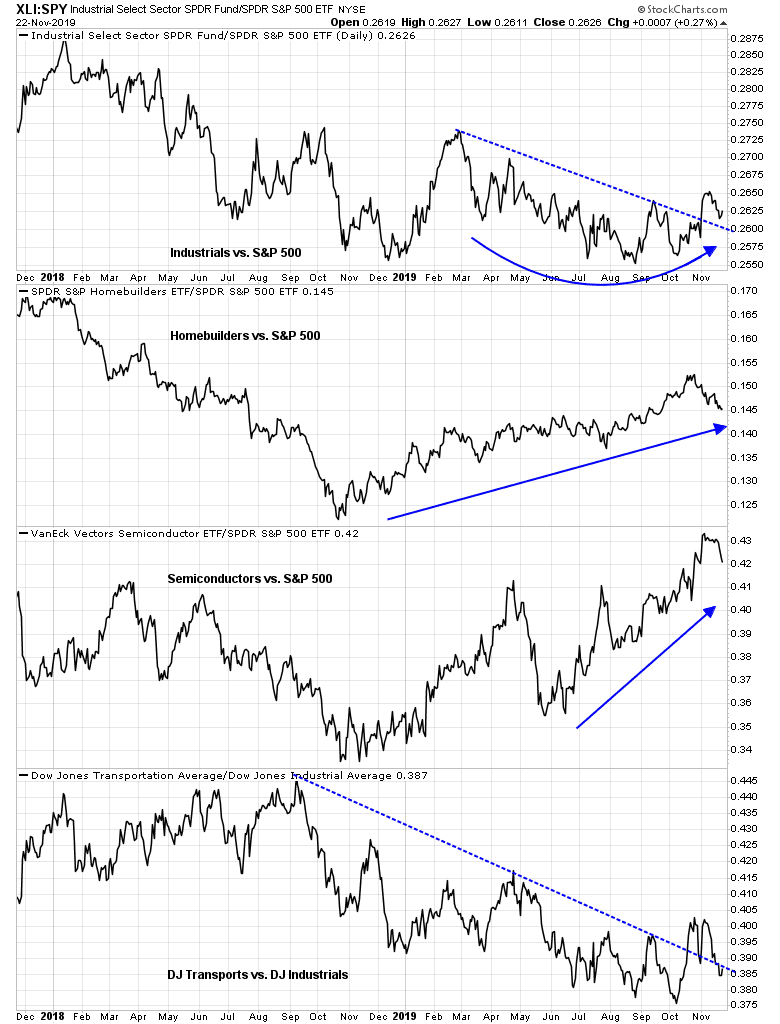
The chart below shows how cyclical sectors have performed relative to the MSCI All-Country World Index (ACWI). Global industrial stocks have staged a relative return rally, and they rose above a relative downtrend line, which is a signal of global recovery. Global auto stocks also rallied through a relative downtrend. While their performance has not been as strong, their technical behavior nevertheless signals the start of a rebound and possible consolidation period. Lastly, semiconductor stocks, which are the most exposed to the 5G infrastructure theme, have been on fire.

Another way of measuring the strength of the global cycle is the copper/gold ratio. Both are commodities, and therefore sensitive to the reflation factor. Copper is more economically sensitive than gold, therefore the copper/gold ratio is a filtered indicator of global cycle. As well, the copper/gold ratio has shown itself to be highly correlated to the 10-year Treasury yield, which is a proxy for growth and inflationary expectations, and the stock/bond ratio, which is an indicator of investor risk appetite. As the chart below shows, the copper/gold ratio is bottoming and in the process of turning up, which is a sign of global recovery.

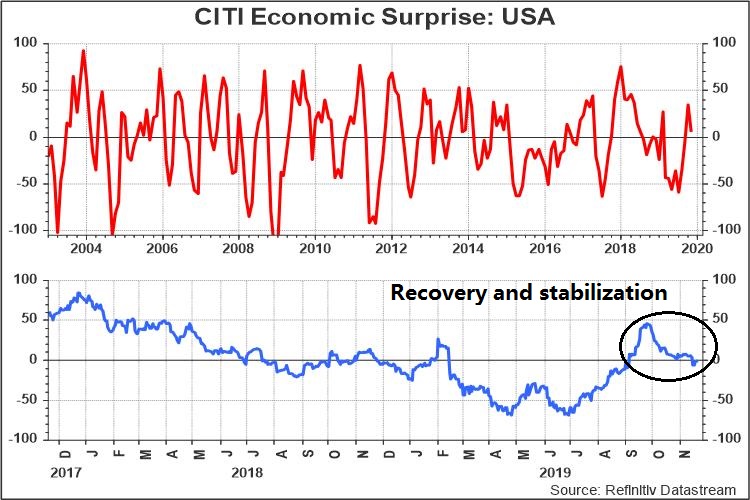
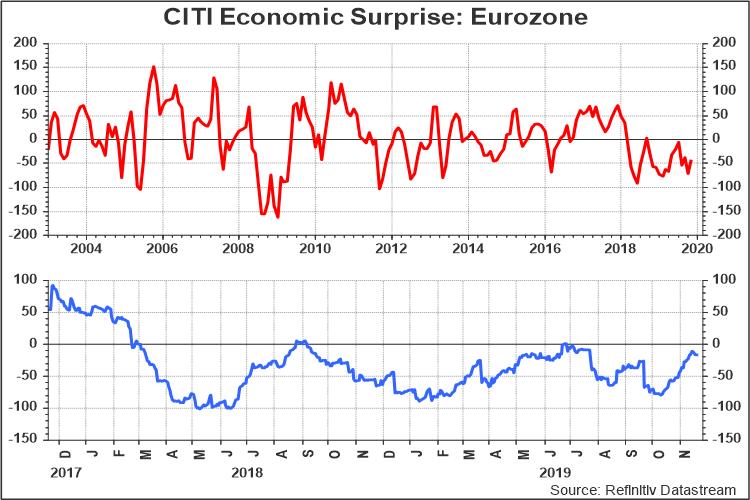
So far, so good, at least from a global perspective. The global outlook can be summarized by the Citi Global Economic Surprise Index (ESI), which measures whether economic releases are beating or missing expectations. The ESI chart is shown from longer term (top panel) and shorter term (bottom panel) perspectives. The global growth outlook has stabilized and it is recovering, but it is not showing any signs of acceleration yet.

US: Recovery and stabilization
Turning to the US, the pattern of real-time price signals parallels the 2s10s yield curve, which can be best described as recovery and stabilization. In virtually all cases, the behavior of cyclical factors have recovered indicating the early signs of recovery, but they have also fallen back, but back not so far as to negate the reflation signal. These are all signs of recovery, and stabilization, but no signs of growth acceleration.
The ESI chart also tells a similar story of recovery and stabilization. Economic data has improved, but the pace of surprise has fallen back to the zero line, indicating that releases have been coming in roughly in line with market expectations.
One of the headwinds to a US cyclical recovery is the trade war. A recent Fed study quantified the effects of uncertainty on business investment. It concluded that this could reduce GDP growth by as much as 1% by 2020. However, these effects are probably already discounted by the market. As long as there is no further escalation, I consider trade war risks to be asymmetric. They can’t get much worse, and they can only get better.

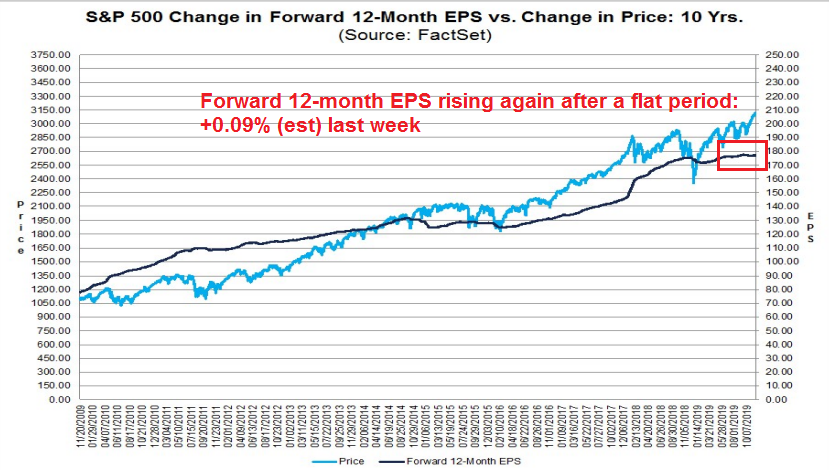
We can see that in the evolution of forward 12-month EPS estimates, which are beginning to rise again after a period of stagnation.
Europe: The global bright spot
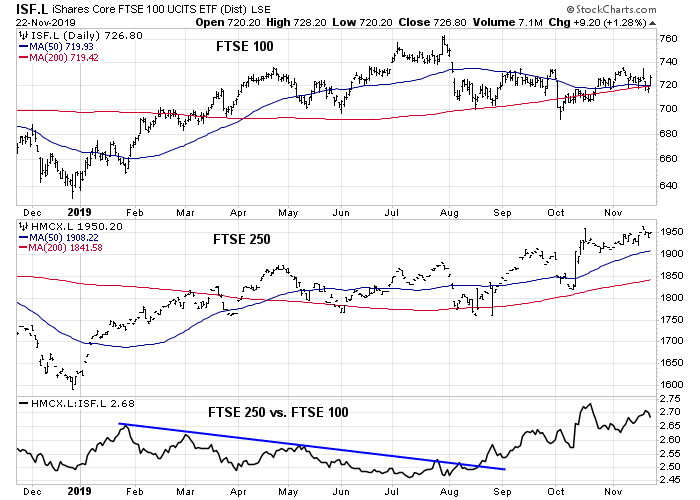
Turning to Europe, this region is becoming the bright spot of global risk appetite. In the UK, the risk of a disorderly no-deal Brexit is rapidly fading. We can see the Brexit risk premium fading in the chart of the FTSE 100, which is composed of large cap and global companies, and the smaller cap and more domestically sensitive FTSE 250. The bottom panel shows the ratio of the FTSE 250 to FTSE 100, which broke out of a relative downtrend in August and it has been rising ever since. This is a signal that it expects an improvement in outlook for companies sensitive to the domestic UK economy.
The real-time cyclical factor charts for Europe also appear to be bullish. European industrial stocks staged a relative upside breakout, indicating strength. European financial stocks are also recovering, and the relative strength of the defensive consumer goods sector is in retreat.

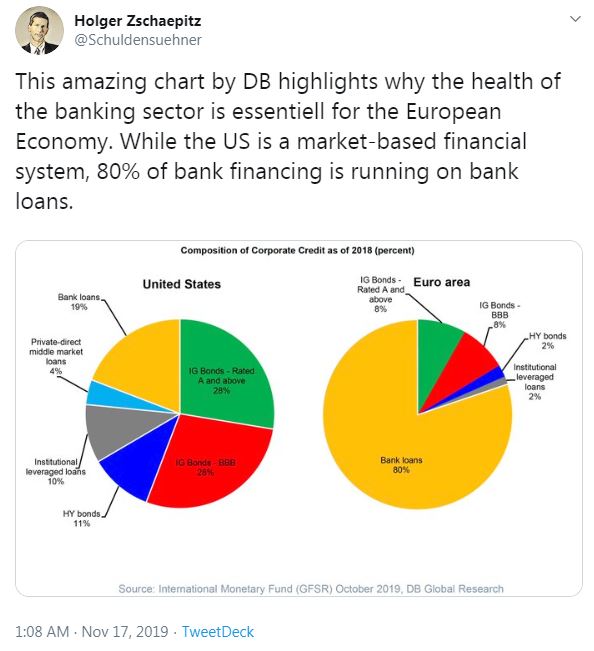
Here is why Europe depends on the fate of the banking sector. This tweet from Holger Zschaepitz of Die Welt reveals that the European economy is far more dependent on bank financing than the US economy, which has undergone a period of financial disintermediation.
Another bright spot on the eurozone horizon is the prospective of fiscal stimulus. There are signs that German reluctance for fiscal stimulus may be changing because of a shift in the political winds. John Authers at Bloomberg documented the rise of the Greens in Germany, who may provide the impetus for more spending – on green initiatives:
There is an argument that Germany’s economy has become the Achilles’ heel of the world economy. Certainly its negative interest rates have rippled far beyond the eurozone, while many are exasperated by the dogged German insistence on a heavy trade surplus, combined with a conservative fiscal policy. But now the best chance of changing that appears to lie in adopting radical environmental politics, and allowing a share of power for Germany’s Greens.
According to a long-running German opinion survey, the environment has recently surged to become the top issue among voters. It has displaced immigration, and is now deemed even more important than the eurozone crisis was at its height,
To compare and contrast the political environment between Europe and the US, RWE, which has been one of the worst CO2 emitters in Europe and user of lignite coal for power generation, has begun pivoting to offshore wind generation and pledges to be net carbon neutral by 2040. Imagine the same thing happening in America?
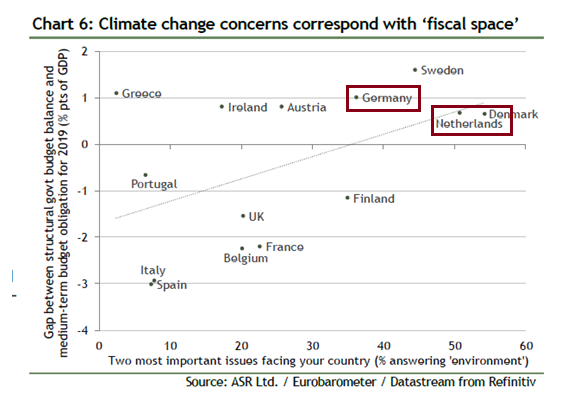
The chart below of European climate change concerns and fiscal space shows that two big northern countries, Germany and the Netherlands, have both the fiscal space and political backing for spending on green projects. This green trend may provide the opening for Christine Lagarde, the new head of the ECB, to lobby for more fiscal spending.
Even without the prospect of more fiscal stimulus, which would be long-term positive, ESI for the euro area has been improving for depressed levels. From a cyclical recovery perspective,
In short, Europe is the global bright spot from a cyclical recovery perspective.
China and Asia: Sputtering a little
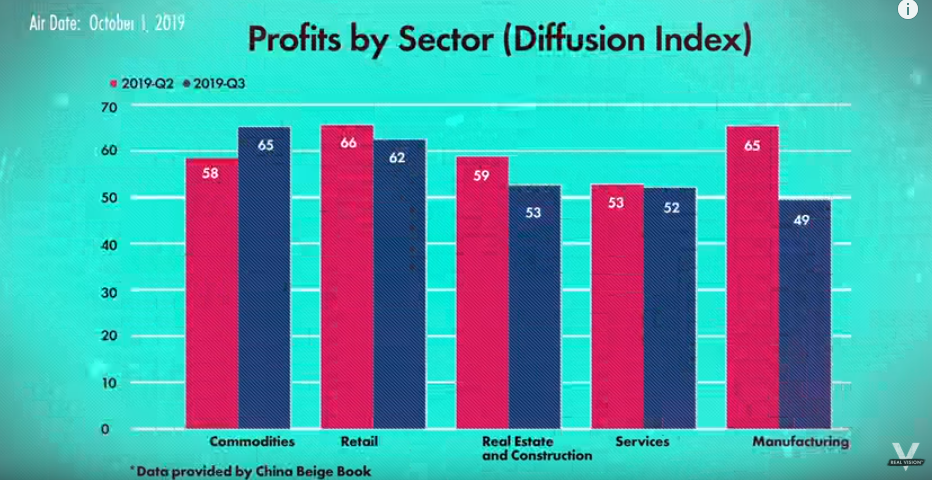
Turning to China and Asia, the picture is more mixed. Leland Miller of China Beige Book revealed in a recent interview with Real Vision that Q3 bottom-up surveys of Chinese businesses showed a high level of weakness. While the diffusion estimates for revenues were up sequentially in two of five sector surveyed:

profit estimates were far weaker, indicating economic weakness.
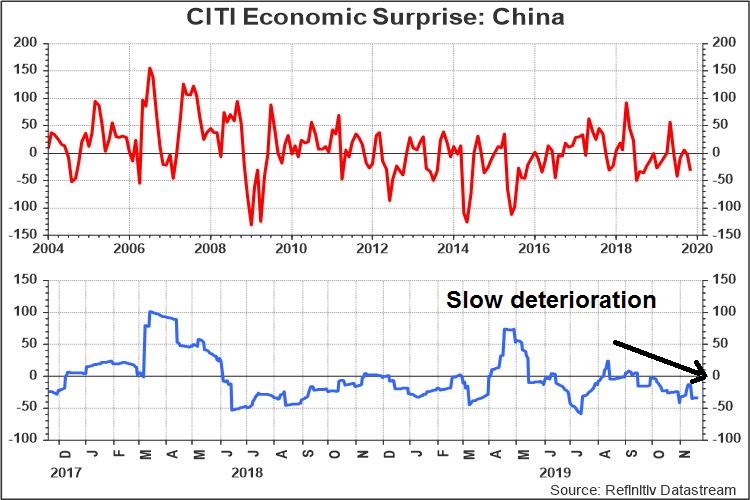
The weakness in China is confirmed by the slow deterioration in ESI.
Where’s the cyclical rebound? China is a major engine of global economic growth. Can the world recover if China is weak?
Here is where data interpretation gets a little tricky. While economic statistics tell a story of deceleration, the real-time market-based indicators are more constructive. China accounts for the lion’s share of global commodity consumption, which makes measuring the health of the commodity markets a useful metric of Chinese economic growth. While the CRB Index has been flat to down, internal breadth, as measured by Pring Commodity New Highs, has been strengthening.

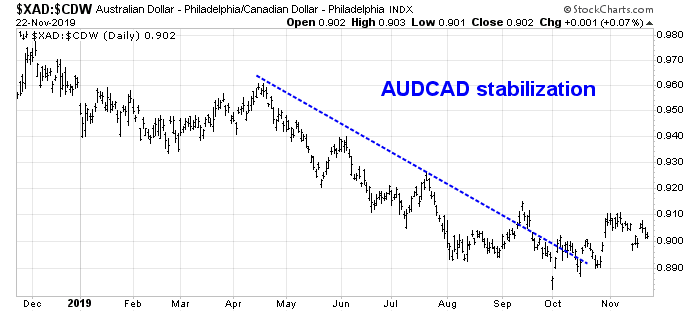
In addition, the AUDCAD exchange rate has stopped falling and it is moving sideways. Both Australia and Canada are global commodity exporters, but Australia is more sensitive to Chinese demand, while Canada is more levered to the American economy. The sideways movement in the AUDCAD exchange rate can be interpreted as a sign of stabilization in Chinese growth.
Even the nearby Hong Kong market, which has been battered by stories of unrest and recession, remains in an uptrend. The resiliency of a market in the face of bad news has to be considered bullish.

Last week, the much watched flash November figures for South Korean exports printed both good news and bad news. South Korean exports are important because they represent an important barometer of the global economy due to their cyclical sensitivity. The bad news is Korea exports were down again, the good news is they are improving.

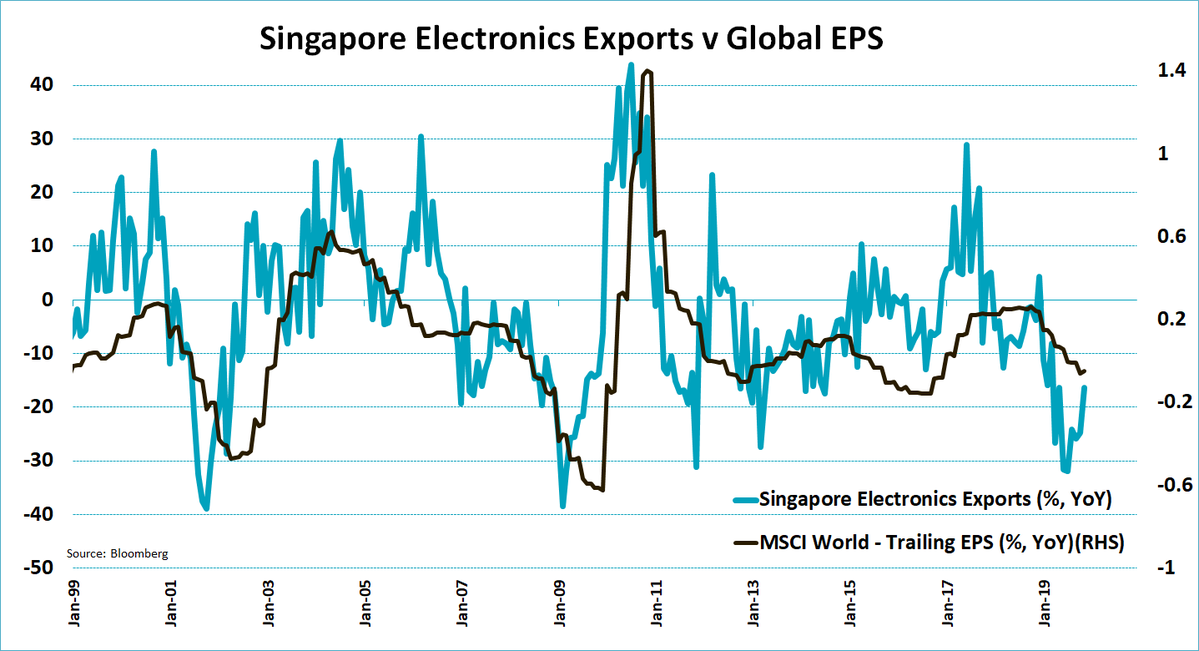
Jeroen Bolkand provided a similar update of the similarly cyclically sensitive of Singapore electronic exports earlier this month. Exports are down, but they are rebounding.
In light of these mixed messages, does the Chinese growth deceleration matter? Beijing appears to have the slowdown under control, and the authorities are trying to glide the economy into a soft landing. As long as it doesn’t crash, the global cyclical rebound may still be in decent shape.
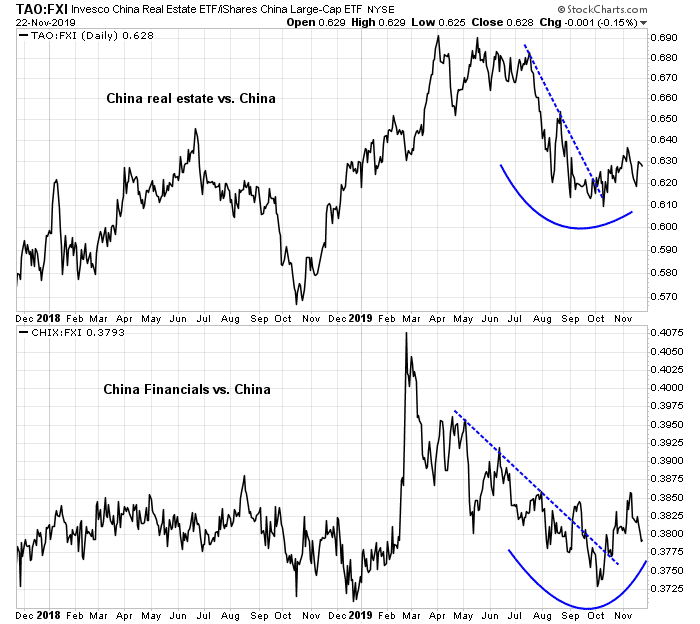
The key indicator to watch is the health of China’s property market because of the massive size of its real estate market (via Plan Maestro).

The size of the property market is explained by the fact that Chinese households have poured their savings into real estate. Mike Bird of the WSJ highlighted this chart, which showed the evolution of home buyer profiles in China. Bird pointed out that at least 80% of mortgage lending goes to buyers who already have one home, which is double the rate in 2015.

Obviously this raises the degree of risk in the financial system. However, the real-time relative performance of property developers and financial stocks in China are all showing signs of stabilization. As long as these canaries in the financial coalmine remain healthy, tail-risk should remain contained.
Still bullish
In conclusion, a review of the real-time market based signals shows that the cyclical recovery investment theme is alive and well. A deeper analysis by region reveals more nuanced details of risks and opportunities.
Of the three major regions, Europe is the most attractive. Market-based signs of a cyclical revival and the reduction of tail-risk, are becoming evident. As well, valuations are highly attractive by historical standards. Asset manager Rick Kleinbauer pointed out that dividend yields are significantly above bond yields, and the spread is starting to improve. The combination of cheap valuation and a reflationary catalyst gives European equities the greatest appreciation potential.

US equities are more richly valued, but US economic growth is strong and recession risk is low. Trade war risk is asymmetric. Things can’t become very much worse, and there is far more room for improvement. Ed Yardeni’s Rule of 20, which sounds a warning if the sum of the forward P/E ratio and the CPI inflation rate exceeds 20, is still in neutral territory. This leaves more upside potential for equity prices.

China and Asia present mixed picture of growth. While Chinese data and policy indicate slowing growth, selected Asian data and real-time market based indicators are suggestive of stabilization and rebound. As long as the tail-risk of a disorderly unwind of China’s debt problems do not appear, I am inclined to give the cyclical bull case the benefit of the doubt.
Bottom line: Stay long the cyclical rebound theme, but keep an eye out for a rapid deterioration in China’s growth outlook.
The week ahead
I have been warning about a minor market stall in these pages, and the market finally cooperated with my call last week. The SPX traded sideways through a rising trend line, and the sell signal was confirmed by a bearish recycle of the daily stochastic and the 14-day RSI from overbought to neutral. Further, the advance was accompanied by a negative divergence in net NYSE new highs (bottom panel). The first logical downside objective is the price gap just below 3050, with further support at the breakout level of 3025-3030.

What now?
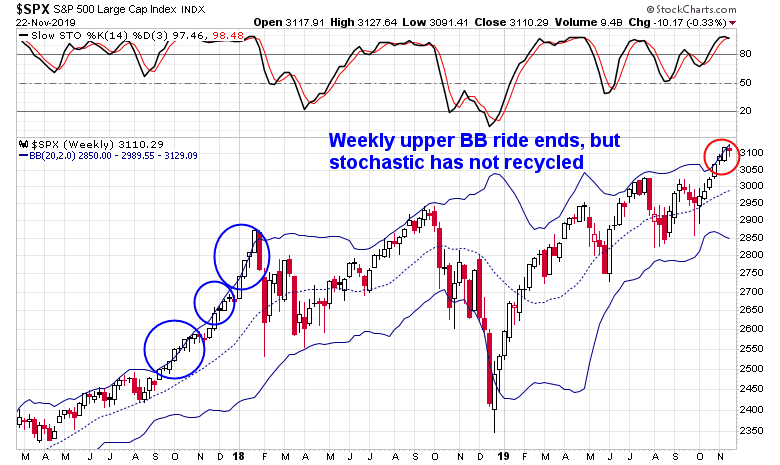
I remain constructive on the stock market on intermediate and longer term. The latest round of consolidation is consistent with the pattern exhibited in the market melt-up of late 2017. As stock prices sprinted upwards in that period, the index went on an upper Bollinger Band ride on the weekly chart. Pauses were relatively minor and shallow. The weekly stochastic remained overbought, as it has today, and never recycled below the overbought level during that advance.
Seasonal and historical patterns are also supportive of the intermediate bull case. Jeff Hirsch at Almanac Trader found that strong YTD returns to November were typically followed by strong December markets.
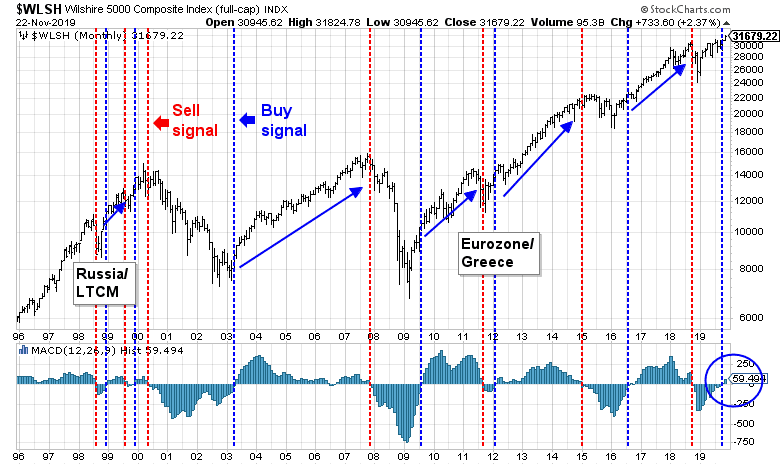
The even longer term outlook continues to be bullish. I had highlighted the monthly MACD buy signal flashed by the Wilshire 5000 at the end of October. That buy signal remains in force, and if history is any guide, this should resolve itself in a multi-year bull phase.
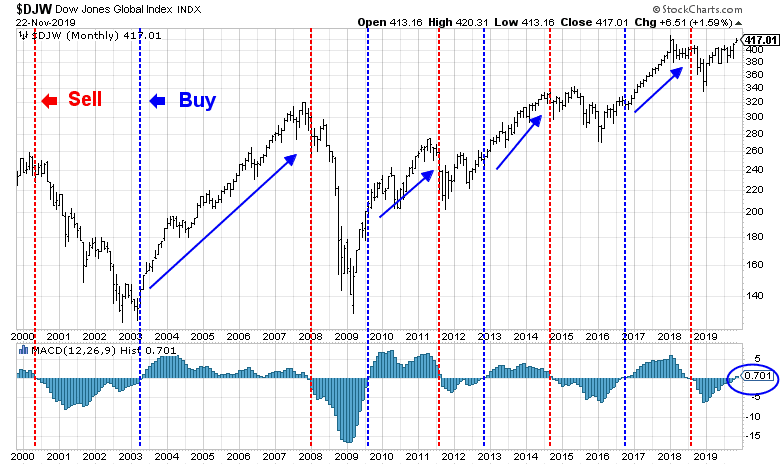
The monthly MACD buy signal is becoming global in scope. Unless world markets totally fall apart in the upcoming week, global stocks should also flash a buy signal at the end of November.
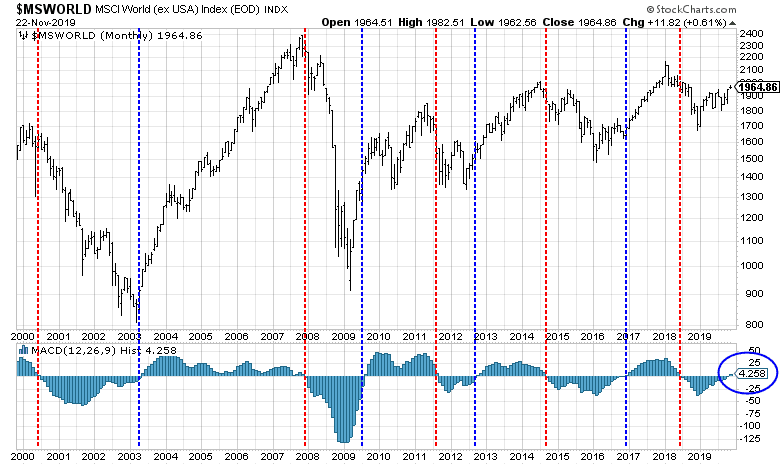
A similar pattern can be found in the MSCI World xUS Index, which is also on the verge of a monthly buy signal.
Viewed from the context of the start of a long-term bull, this funds flow analysis is particularly revealing (h/t @chigrl). Investors have been pouring money into cash and fixed income securities for most of this year, and the reversal into equities is only starting, indicating strong upside potential longer term.

In an ideal world, here is what I am tactically watching for. My working hypothesis calls for a period of consolidation and shallow pullback. I am watching for the market to become oversold on short-term (1-2 day horizon) momentum indicators.
Slightly longer term momentum has been tracing out a pattern of lower highs. I would prefer to see this indicator zigzag its way downwards into an oversold level. That would be the ideal trading buy signal.
In life and trading, nothing ever goes exactly to plan, but we all observe and react accordingly. My inner investor remains bullishly positioned, though he sold call options on selected long positions to pick up some premium income. My inner trader sold last week and went to 100% cash, and he is waiting for an opportune time to re-enter on the long side.