Preface: Explaining our market timing models
We maintain several market timing models, each with differing time horizons. The “Ultimate Market Timing Model” is a long-term market timing model based on the research outlined in our post, Building the ultimate market timing model. This model tends to generate only a handful of signals each decade.
The Trend Model is an asset allocation model which applies trend following principles based on the inputs of global stock and commodity price. This model has a shorter time horizon and tends to turn over about 4-6 times a year. In essence, it seeks to answer the question, “Is the trend in the global economy expansion (bullish) or contraction (bearish)?”
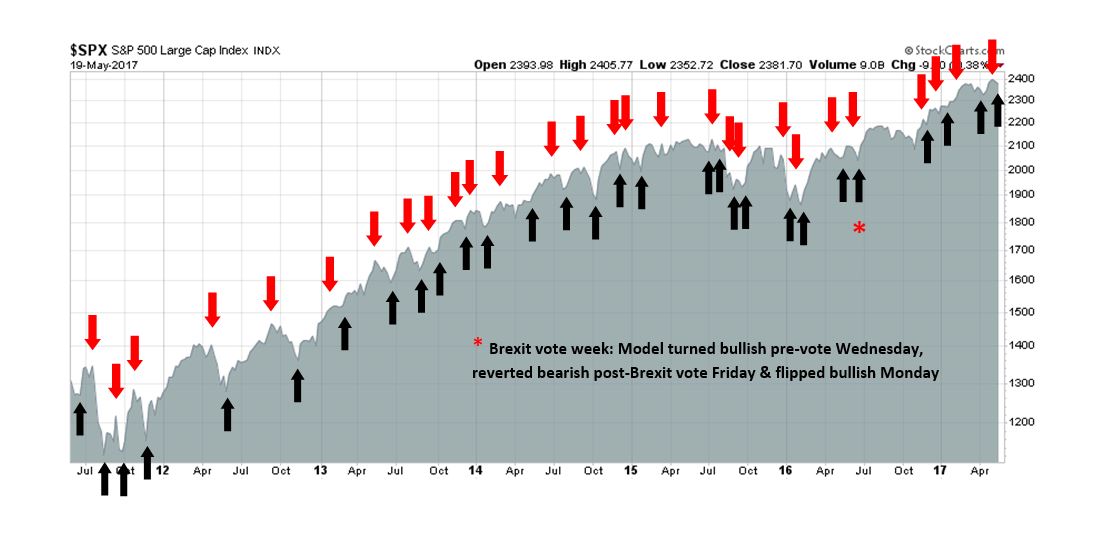
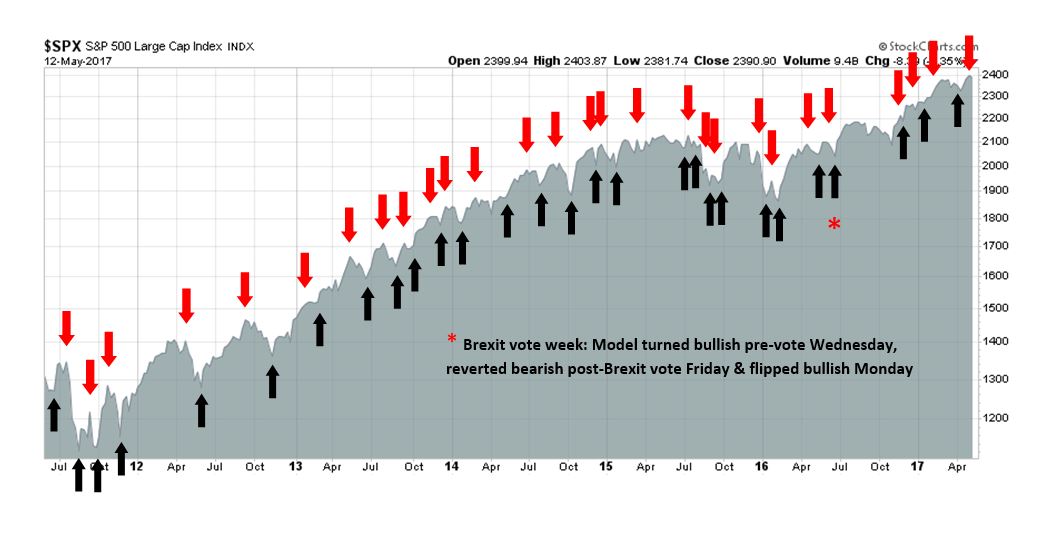
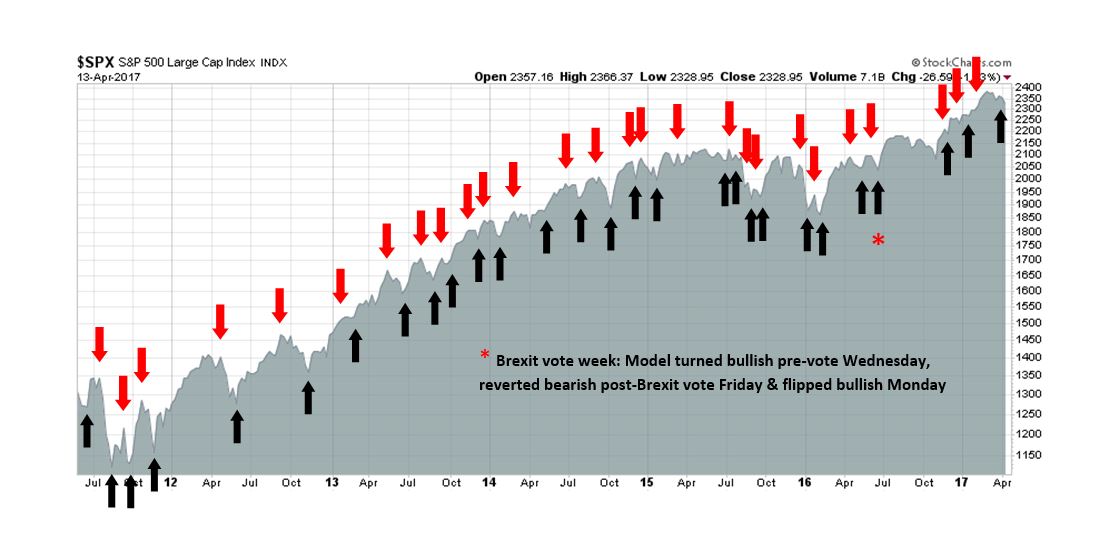
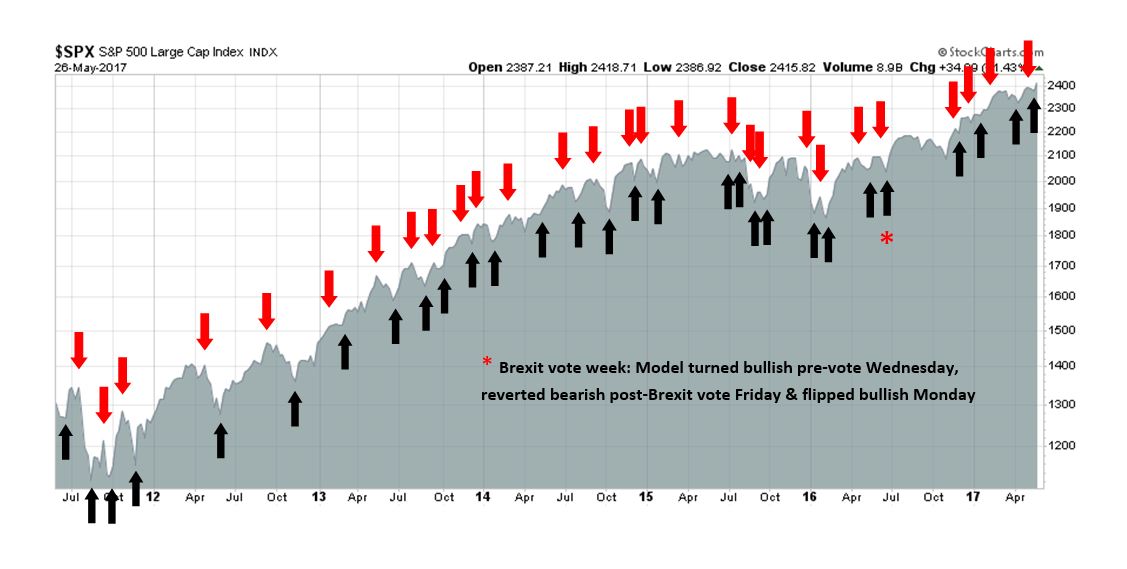
My inner trader uses the trading component of the Trend Model to look for changes in the direction of the main Trend Model signal. A bullish Trend Model signal that gets less bullish is a trading “sell” signal. Conversely, a bearish Trend Model signal that gets less bearish is a trading “buy” signal. The history of actual out-of-sample (not backtested) signals of the trading model are shown by the arrows in the chart below. Past trading of the trading model has shown turnover rates of about 200% per month.
The latest signals of each model are as follows:
- Ultimate market timing model: Buy equities
- Trend Model signal: Risk-on
- Trading model: Bullish
Update schedule: I generally update model readings on my site on weekends and tweet mid-week observations at @humblestudent. Subscribers will also receive email notices of any changes in my trading portfolio.
History rhymes
Last week’s post (see A market top checklist) generated many questions and much discussion. While there was general acceptance of my thesis that an intermediate top is not imminent, most of the questions revolved around how far away the market top is. As well, there were some queries about equity downside risk in the next bear market.
The respected Jesse Livermore, who writes at Philosophical Economics, recently chimed in on the topic:
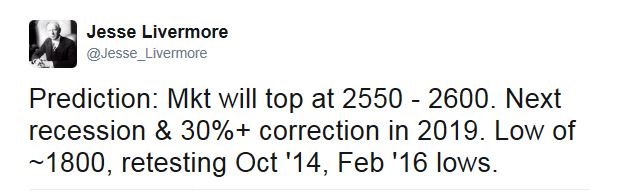
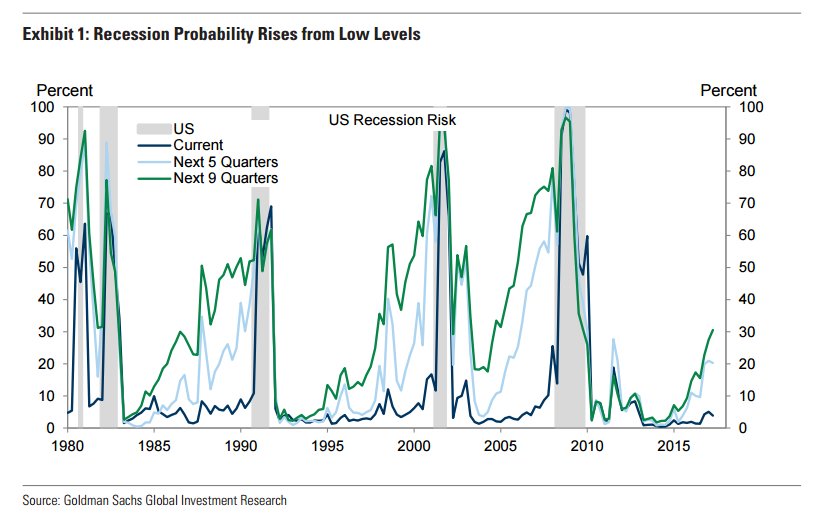
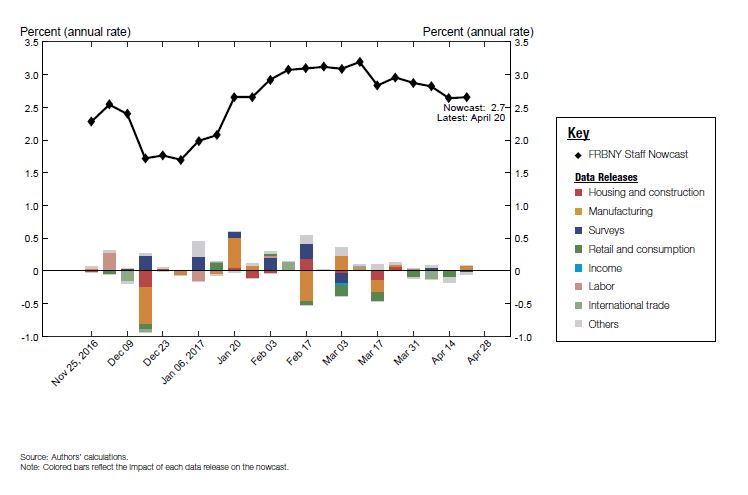
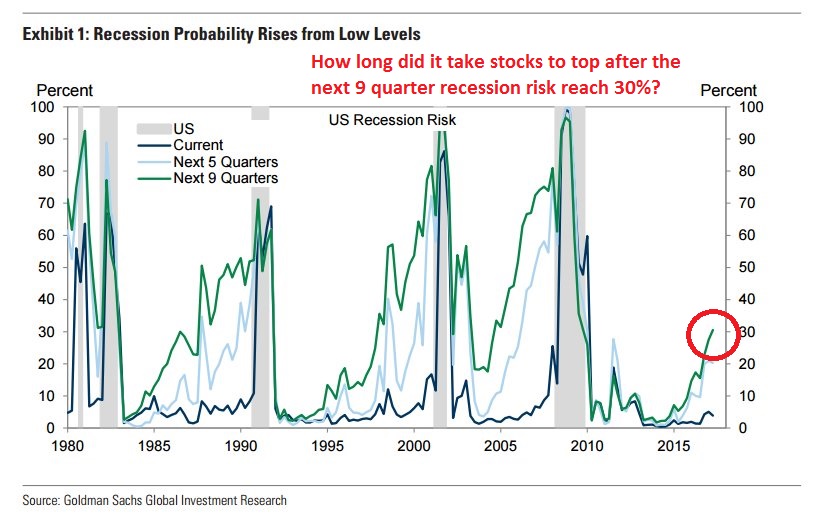
I believe that those questions could be answered in a number of ways. Consider this chart from Jan Hatzius of Goldman Sachs that I showed several weeks ago (see Are the Fed and PBoC taking away the punch bowl?). One reasonable approach might be, “Since major bear market episodes are caused by economic recessions, how far away were previous market tops when the 9 quarter recession risk reached 30%, which is the current reading today?”
The answer is somewhat surprising, and a closer examination of the data shows that a simplistic application of historical studies can lead investors astray. In other words, history doesn’t repeat itself, but rhymes.
Recessions and bear markets
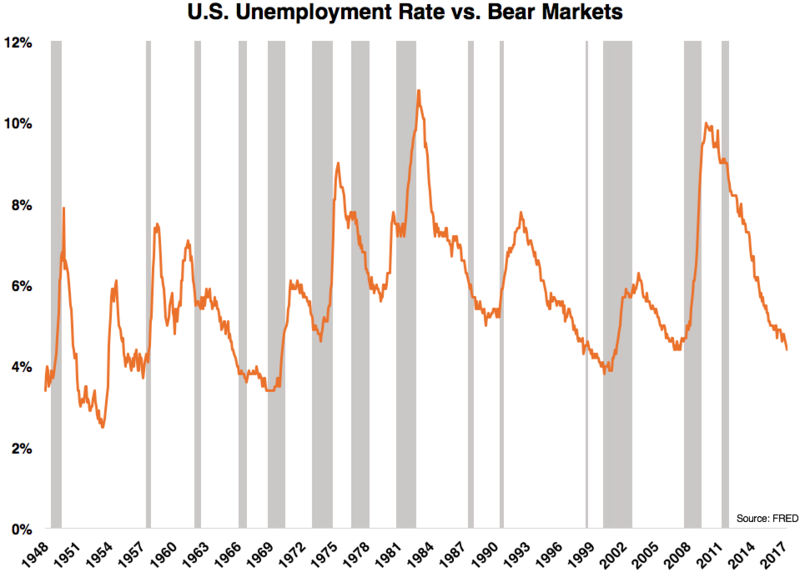
Here are the numbers. Though the sample size is small (N=3), the arrows in the chart below marks the past instances when 9 quarter recession risk rose to 30%. If we were to discount the Crash of 1987, which did not result in a recession, the stock market topped out about 2.5 to 3 years after recession risk reach the 30% level.

So can the bulls rejoice and hang on for another 2.5-3 year? Not so fast! This exercise shows how simple analogues can create false conclusions.
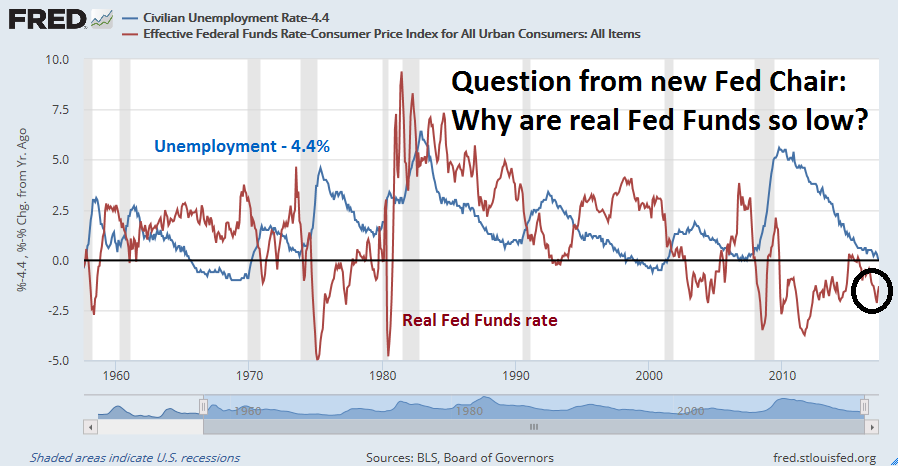
In the chart, I have also shown the Fed Funds rate (blue line) and unemployment rate (red line) to illustrate the macro conditions at the time of the 30% recession probability signals. As the current unemployment rate stands at 4.4%, I subtracted 4.4 from the unemployment rate as an easy way of comparing past unemployment rate levels to today.
The chart shows how different each of the bear market episodes were from each other. When recession risk first reached 30% in the 1980’s, unemployment had been declining since the recession of 1982, but were well above current levels, and the Fed had begun to raise rates. Monetary policy had become overly aggressive, which contributed to the 1987 crash. The economy, however, remained resilient and did not fall into recession, and the stock market did not see a recession induced bear market until about 2.5 years after the 30% recession risk signal.
The 1990’s episode was completely different. Unemployment had been falling but was still well above today’s 4.4% level. Interest rates were stable. The dot-com bubble followed and the market did not top out until 2.75 years after that signal.
During the 2000s, the signal occurred when the unemployment rate was also higher than it is today, and the Fed had just begun a tightening cycle. It took a full 3 years before the stock market reached a top.
Passing the sanity test
Based on this analysis, we could simplistically conclude that the equity bull has a minimum of 2.5 years to run. Such a conclusion would be based on monetary policy assumptions that are highly improbable.
Consider the unemployment rate. If we were to make the assumption that the economic expansion were to continue and unemployment were to improve at the current pace, it would reach somewhere between 2.9% and 3.4% before the stock market tops out.
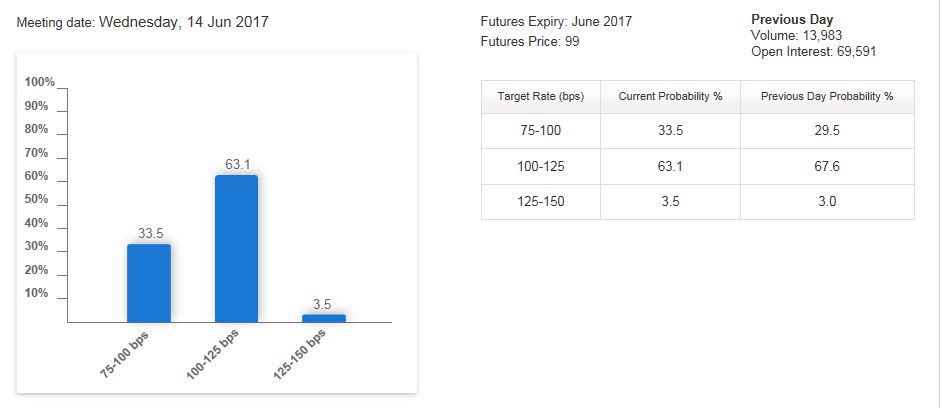
Can anyone imagine such a dovish Federal Reserve? The minutes of the May 2017 FOMC meeting stated that the (then) unemployment rate of 4.5% was below the natural rate, which the Fed believes would create inflationary pressures:
Labor market conditions strengthened further in recent months. At 4.5 percent, the unemployment rate had reached or fallen below levels that participants judged likely to be normal over the longer run.
And then there was this more hawkish possibility:
Several participants, however, pointed to conditions under which the Committee might need to consider a somewhat more rapid removal of monetary accommodation–for instance, if the unemployment rate fell appreciably further than currently projected, if wages increased more rapidly than expected, or if highly stimulative fiscal policy changes were to be enacted.
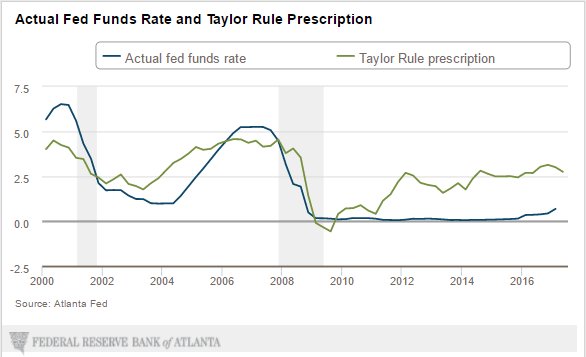
The idea that the Fed would stand idly and allow the economy to continue on its current expansionary course while unemployment is already at 4.4% simply doesn’t pass the sanity test. I have made the case that the main risk to stock prices is tighter monetary policy (see How the bull will die). Arguably, the Yellen Fed has been extremely accommodative by historical standards. Imagine a new Fed chair taking over next year and asking the following uncomfortable question, “Unemployment is already very low by historical standards, why are real Fed Funds so low?”
Even if Janet Yellen were to be re-appointed as Fed chair, it is difficult to envisage a scenario where the Fed stays accommodative for such a long time. Sooner or later, rising interest rates is going to kill this bull market, and it won’t be 2-3 years from now.
When does the market actually top?
So if a market top in 2.5-3 years is an unrealistic projection, what is a better estimate?
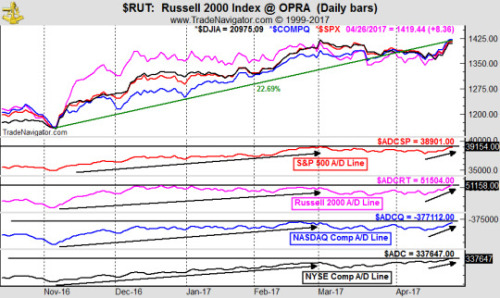
Last August, I highlighted analysis by Chris Ciovacco that applied a trend following model of crossing moving averages to the NYSE Composite to generate a buy signal (see The roadmap to a 2017 market top). Ciovacco’s trend model buy signal has worked out well, as stock prices have advanced strongly since then.

In that post, I also analyzed the length of past Ciovacco buy signals and found the length bull runs tended to cluster. If the bull last more than 1 1/2 years, it had the potential to last another 3-5 years.
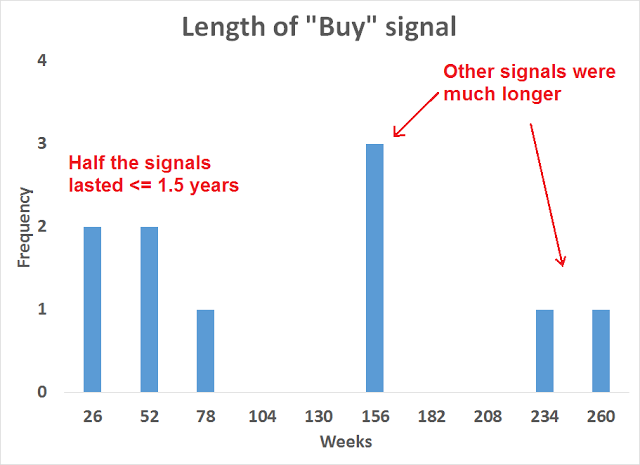
When I consider the combination of macro and technical conditions today, the current bull phase is likely to be of the shorter variety. While I had postulated a market top in 2017 last August, I am inclined to revise that forecast and allow that the market could top out up to a year from now. The trajectory of stock prices is dependent on how economic conditions develop, and the Fed’s reaction function to those conditions.
In short, expect a market top in the next 6-12 months.
How far down from here?
When I turn to the issue of downside risk, the best way to estimate a bear market objective is to see what excesses need to be unwound in the next recession, defined as excess valuation and leverage, which can magnify downside risk as bad debt gets resolved. The chart below shows equity holdings + real estate as a % of total household assets (black line), as a rough guide to asset valuation, and household debt to assets (red line), as a guide to leverage.
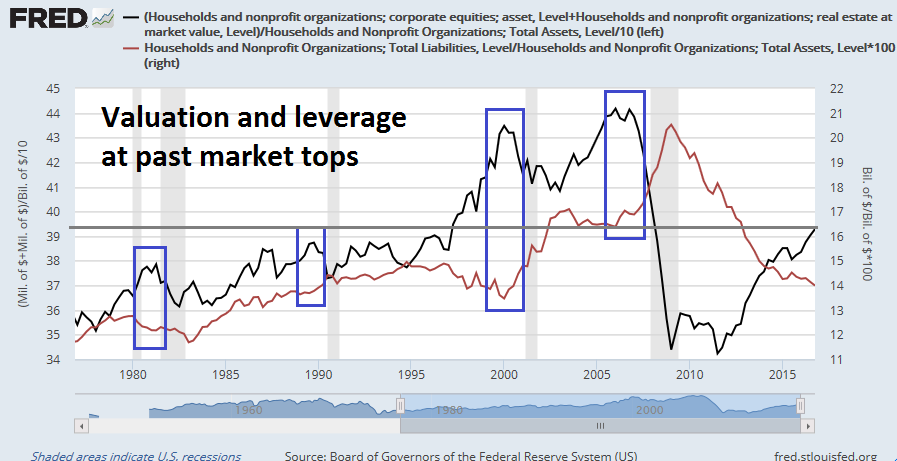
As the chart shows, valuations got very bubbly at the last two cycle tops. The dot-com bubble of the late 1990’s moved the valuation line to historical highs, and the subsequent real estate reflation bubble saw valuation recover to NASDAQ bubble peaks and leverage to elevated levels. By contrast, current valuation and leverage readings are more similar to the tops seen in the early and late 1980’s. This analysis indicates that the next equity bear will see downside risk similar to the 1980-82 and 1990 bear markets, which saw prices fall 20-30%.
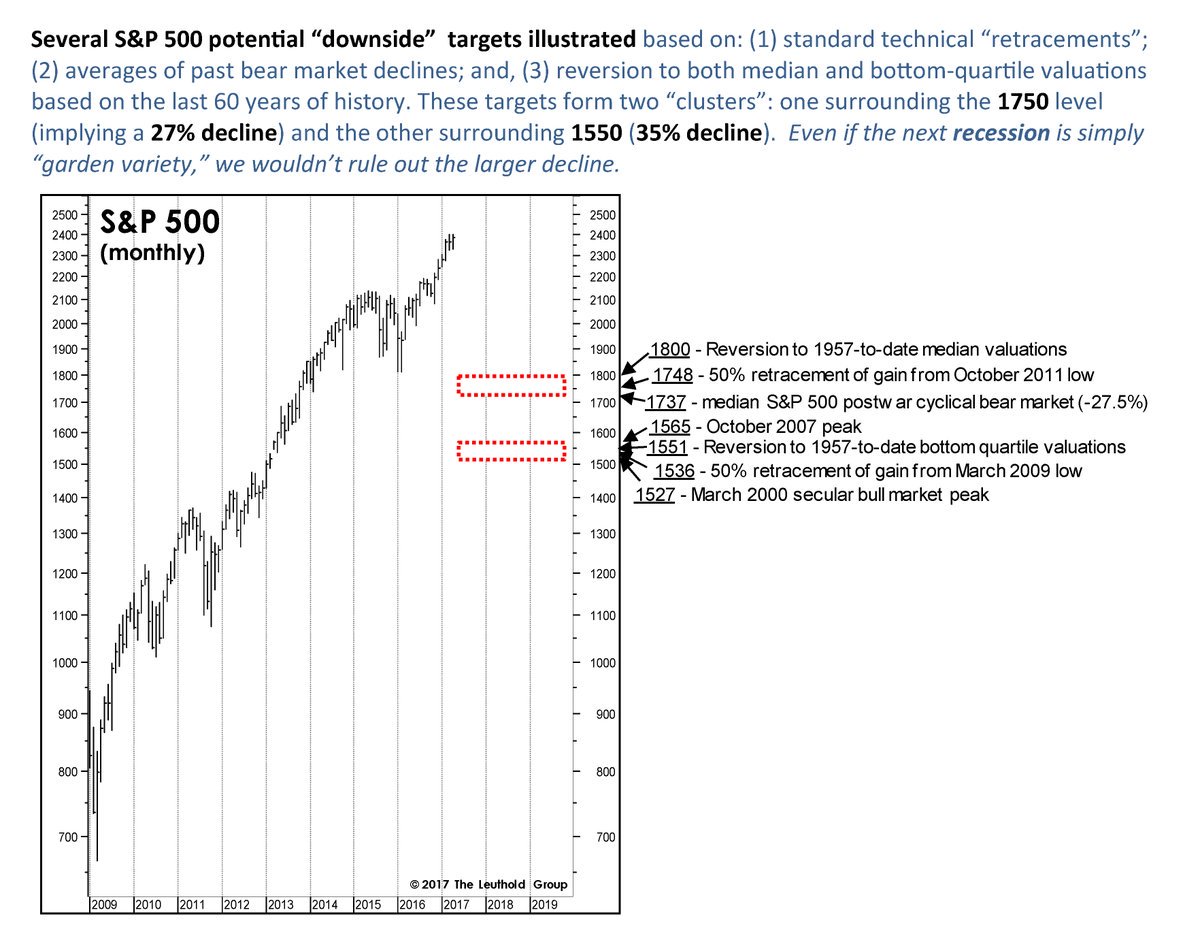
For a different perspective, analysis from the Leuthold Group (via Callum Thomas) a downside SPX potential of 27-35% from current levels.
The risks from abroad
This conclusion of downside risk of about 30% is correct if viewed strictly from an US-centric context. There are few excesses to be unwound in the US, except for perhaps a few too many unicorns in Silicon Valley. This cycle, however, the sources of risk are global in scope.
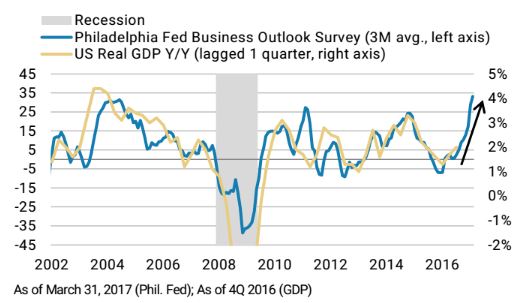
In a recent article, Lakshman Achuthan of ECRI showed that global inflation cycles have become far more synchronized in the 21st Century when compared to the 20th Century. By implication, the synchronization of inflation cycles indicates a synchronization of economic cycles.

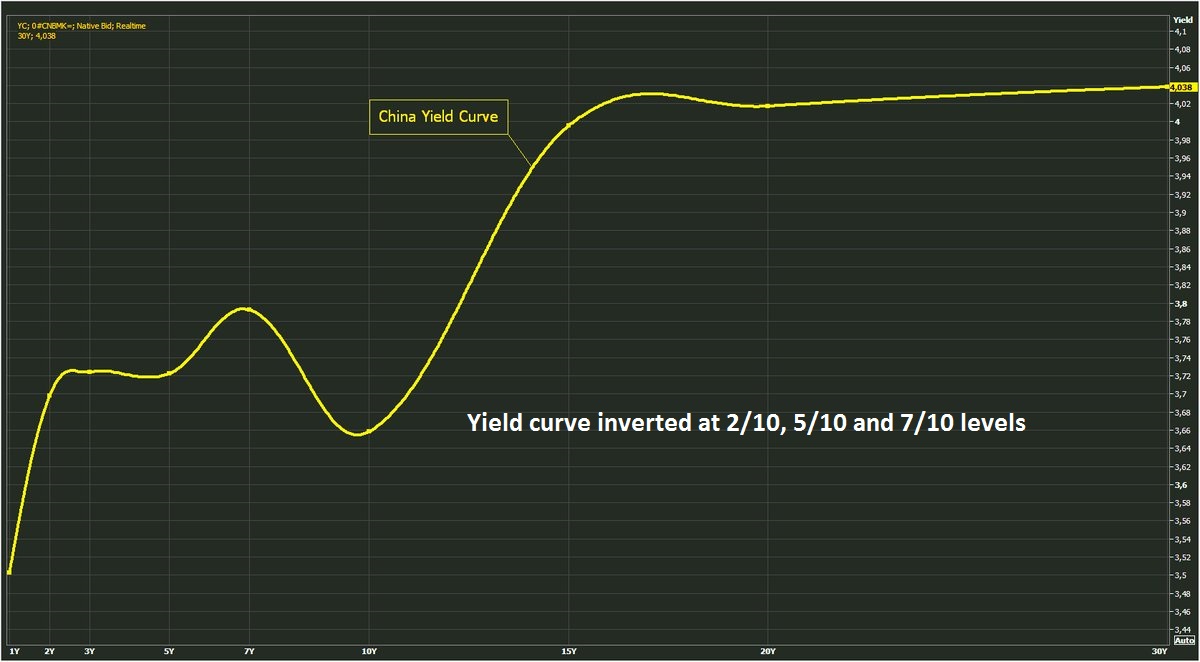
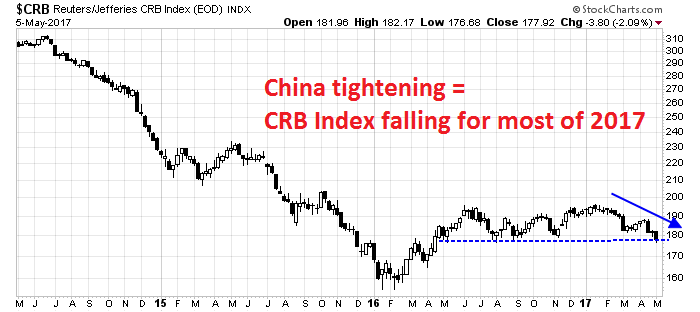
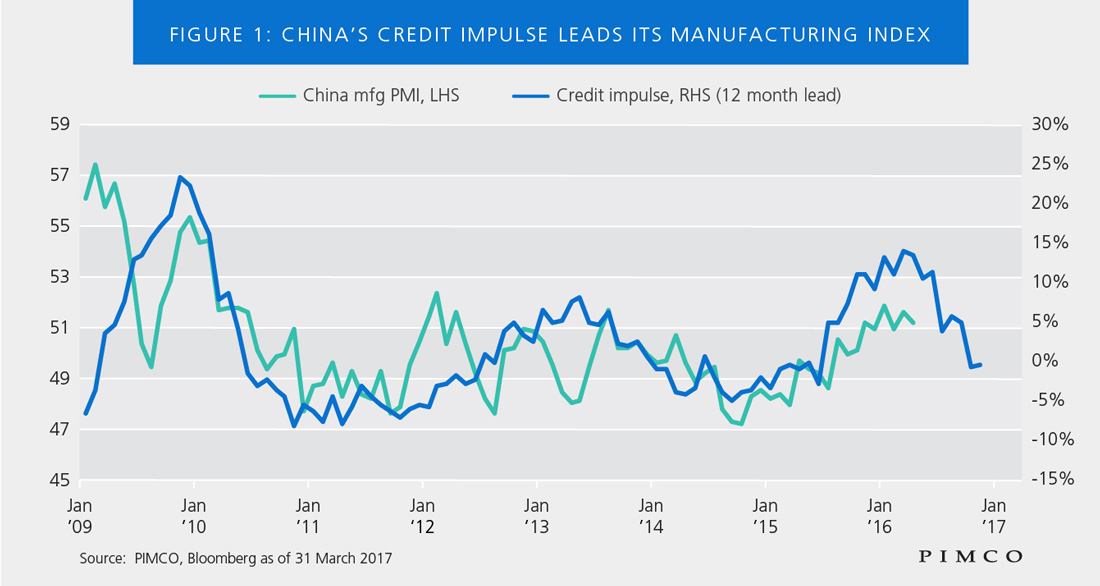
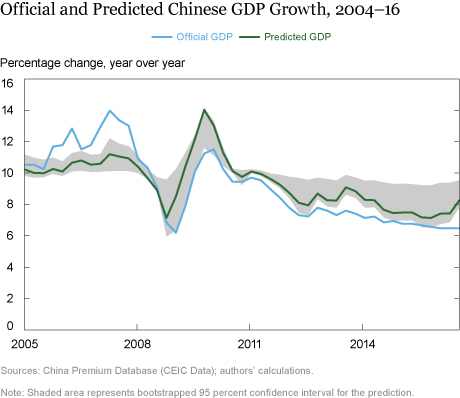
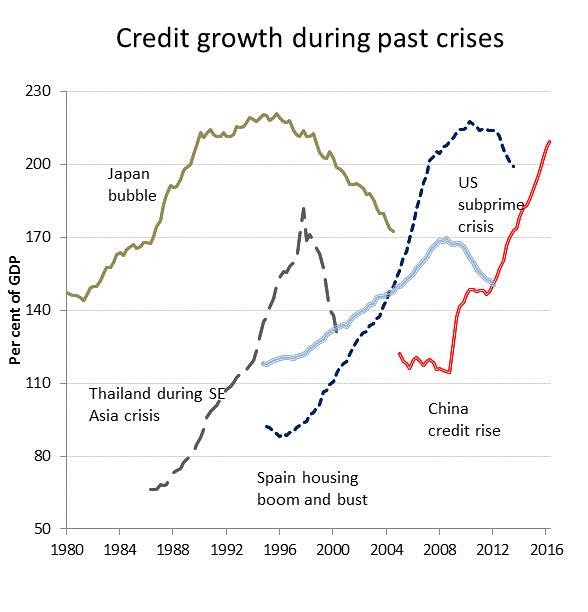
If the Fed were to induce an economic slowdown in the US, what are the effects on other major economies in this era of globalization? In particular, the biggest global macro risk is a Fed induced downturn that drives China into a hard landing. The sequence would go something like this. The US would falls into a mild recession, which craters the exports of Chinese goods in the US. The Chinese economy then slows, which stresses its already over-levered balance sheet, which is a ripe environment for an economic crash.
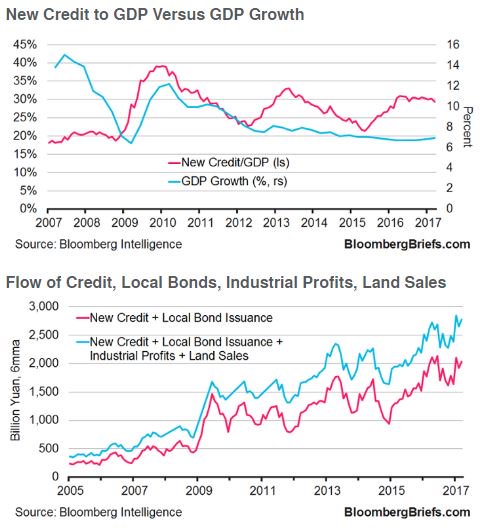
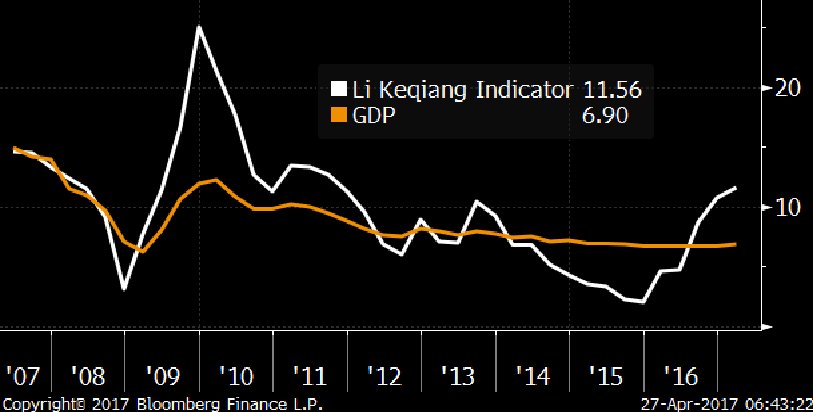
Moody’s downgrade of Chinese debt last week highlighted the growing financial risks in China. By now, virtually everyone knows about the ticking time bomb in China, it’s just a question of how the problem gets resolved.
To be sure, virtually all Chinese debt is held domestically. Should China slow into a hard landing, this will not be your typical emerging market crisis.

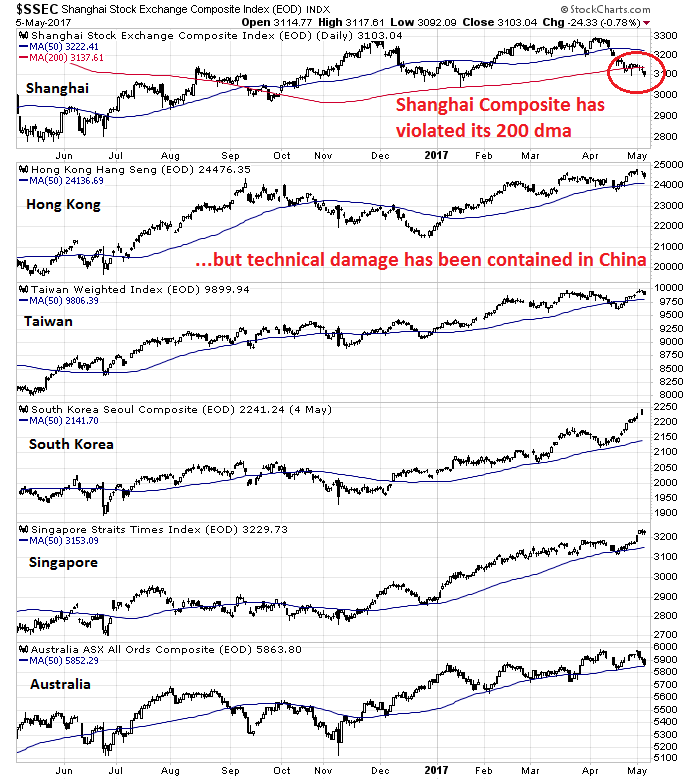
Just because a potential debt crisis could be contained in China doesn’t mean that the rest of the world gets off scot-free (see How a China crash might unfold). It would begin with the collapse of selected over-levered SMEs. Contagion seeps into SOEs and the local government bond market. While Beijing has plenty of ways to mitigate the damage, someone still has to pay for the fallout. In the end, the socialization of losses means that the household sector will have to pay. The price is a period slower economic growth.
As China has relatively low levels of external debt, financial contagion risk is limited. However, global growth is likely to be affected through the trade channel. Most of Asia, as well as the resource based economies, such as Australia, Canada, Brazil, and South Africa, would fall into recession. Bloomberg highlighted that Hong Kong is already experiencing a property bubble that could end very badly. Undoubtedly, the rise in property prices was the result of excess liquidity sloshing in from China.

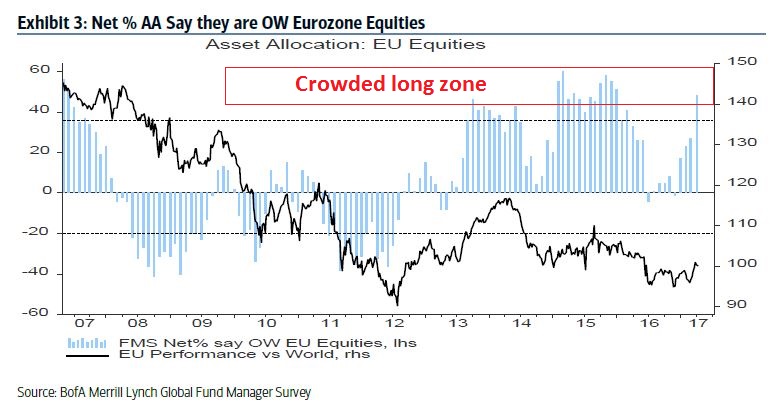
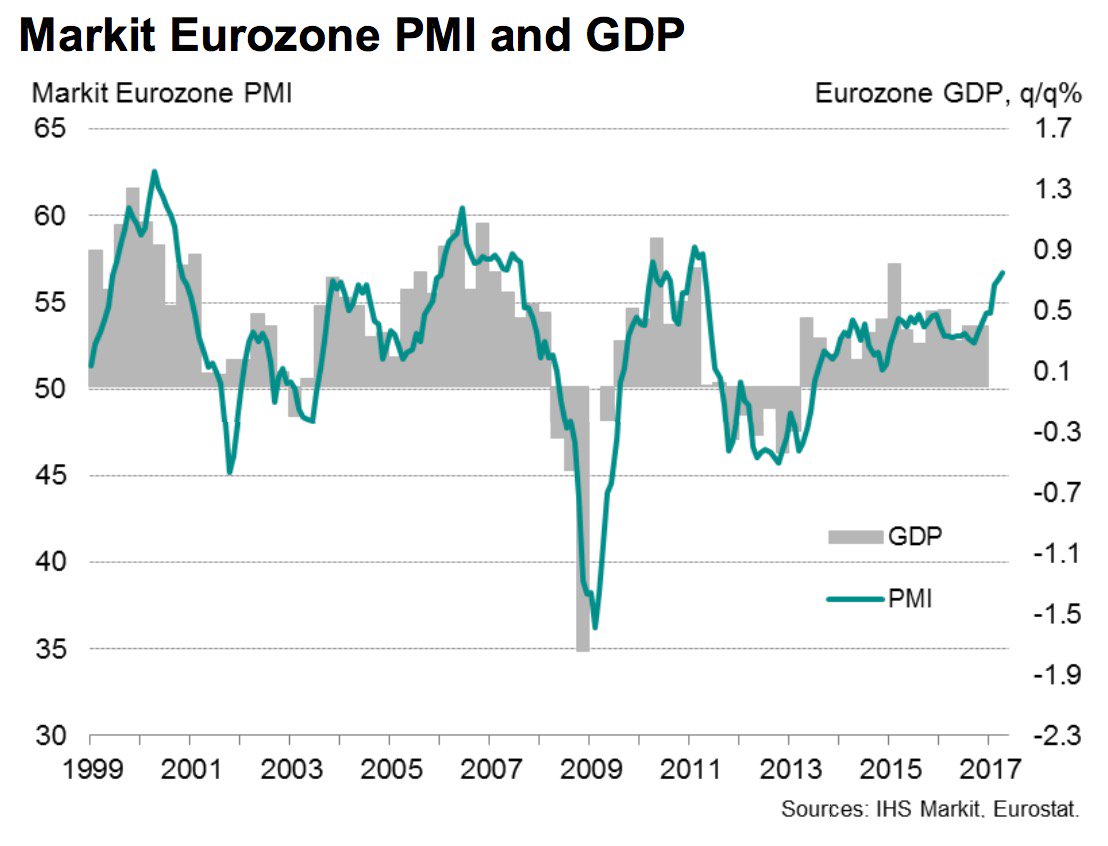
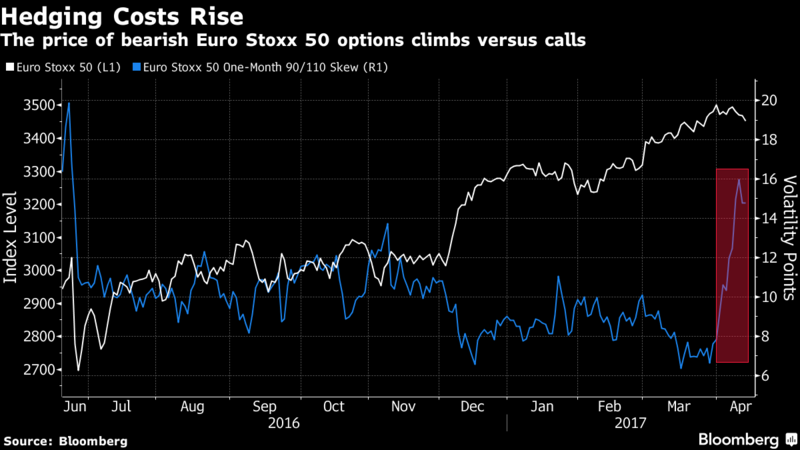
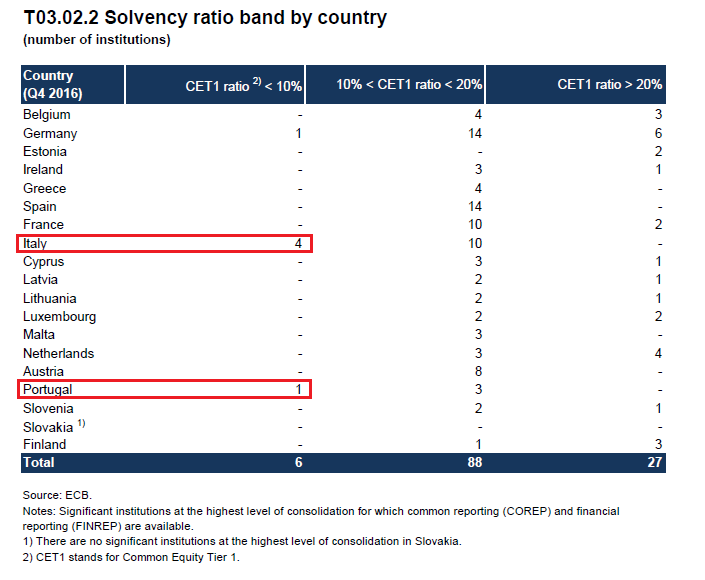
Should Chinese growth start to wobble, another source of global vulnerability is the European banking system. This ECB Q4 2016 report shows that the most exposed banks are in Italy and Portugal, indicating that peripheral Europe credit risk really hasn’t gone away. European bank exposures are exacerbated by the practice of eurozone banks to load up on the debt of their own sovereigns. Should a banking crisis occur, it would be the responsibility of each member state to rescue their banks, which is stuffed full of paper of their own countries. (Wait a minute, how do you rescue yourself?)
This is another illustration of how history doesn’t repeat, but rhymes. A repeat of history would indicate that stock prices would fall no more than 20-30% in the next recession induced bear market. However, downside risk could be exacerbated by the unwind of excesses in China, as well as financial contagion from the eurozone banking system.
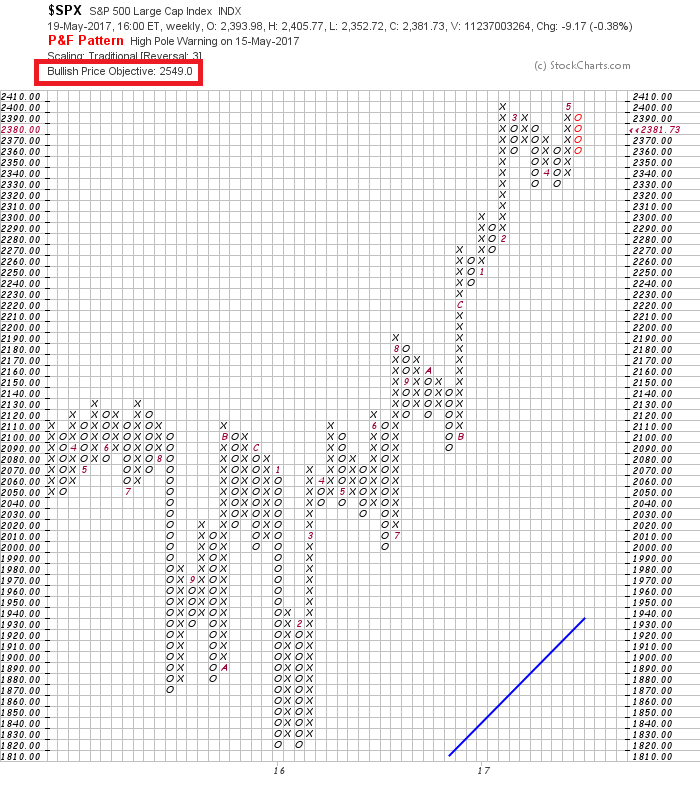
In conclusion, my forecast is a market top at 2500-2550 in the next 6-12 months. The subsequent decline would be in the 30-50% range, depending on the triggering event, and the nature of the global contagion.
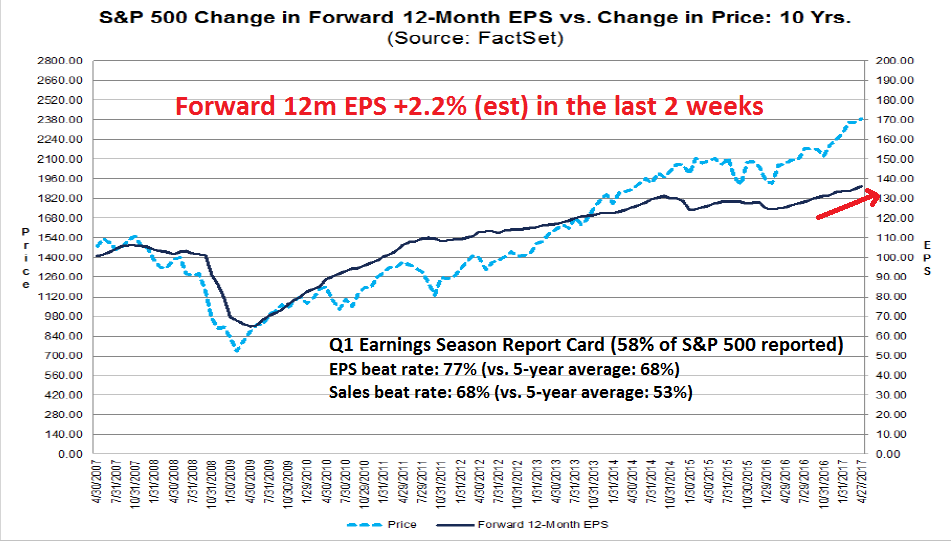
Intermediate term bullish
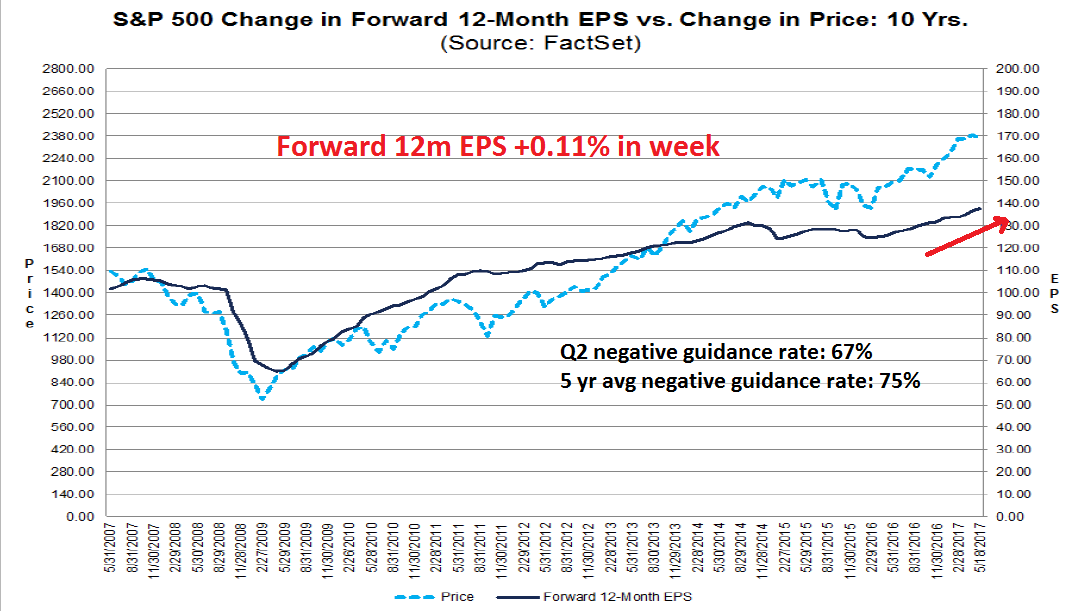
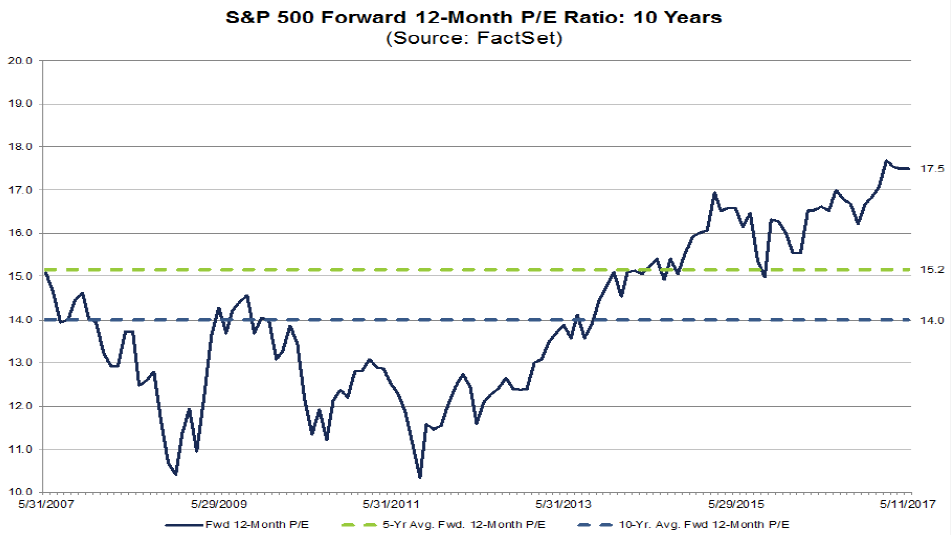
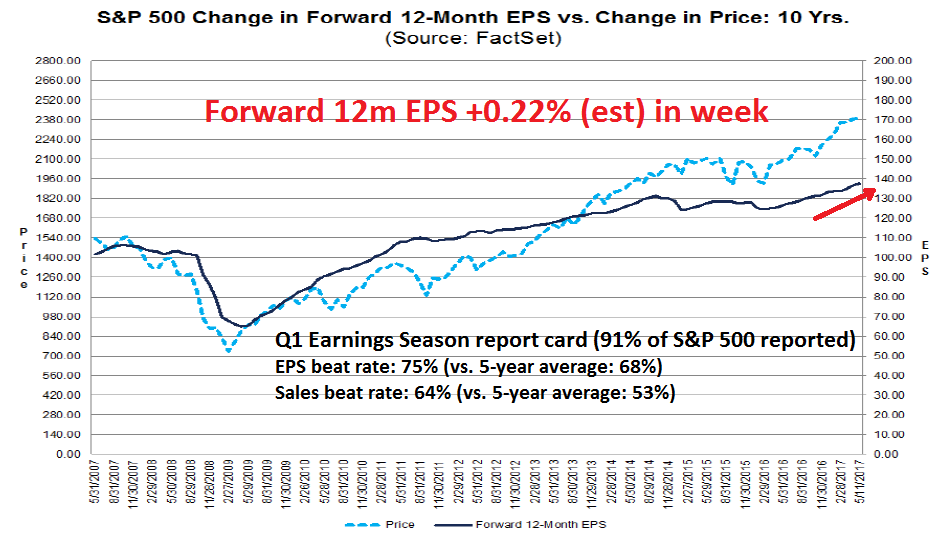
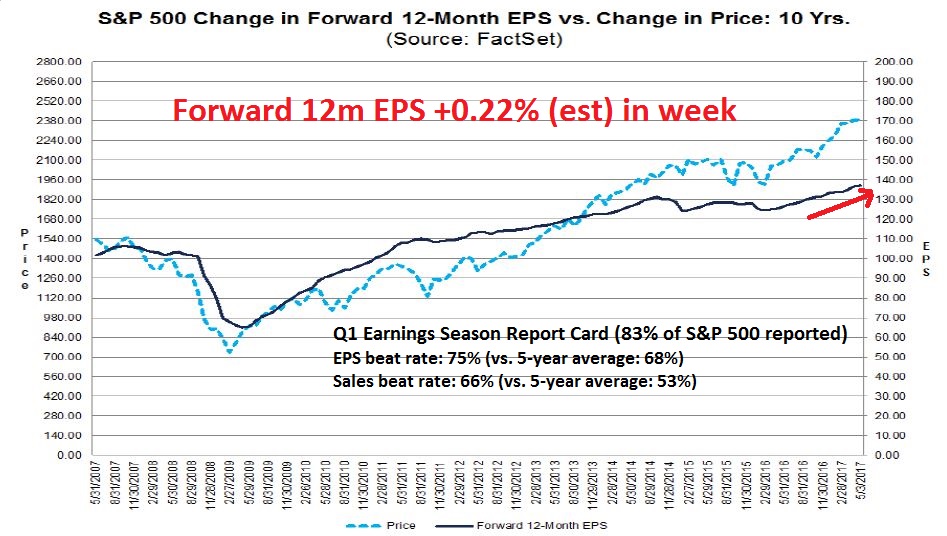
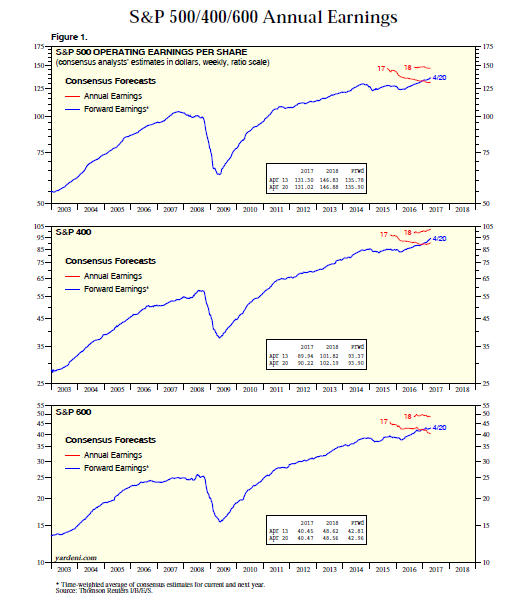
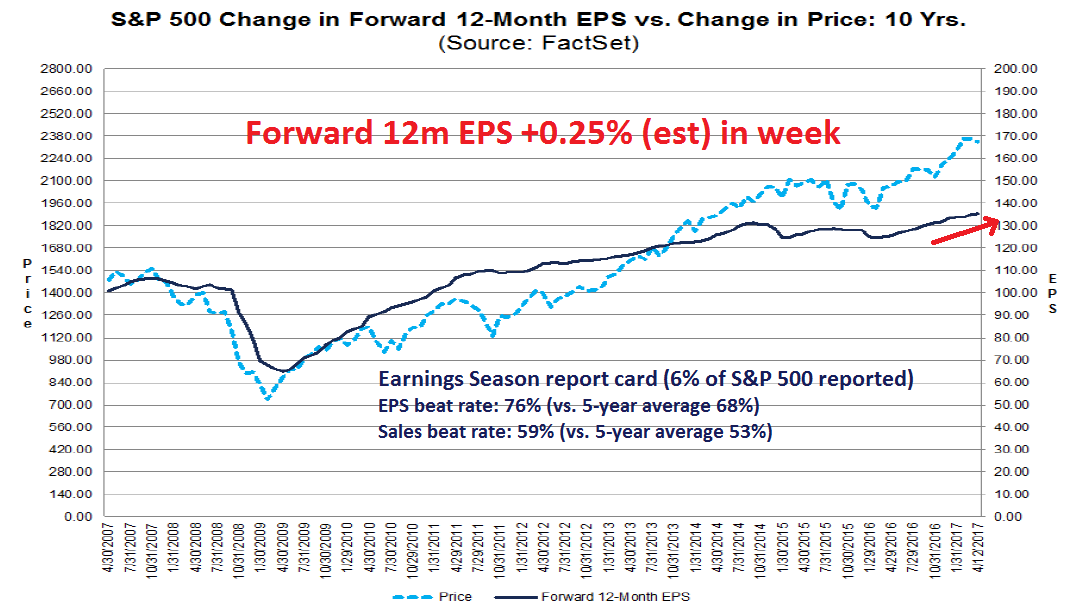
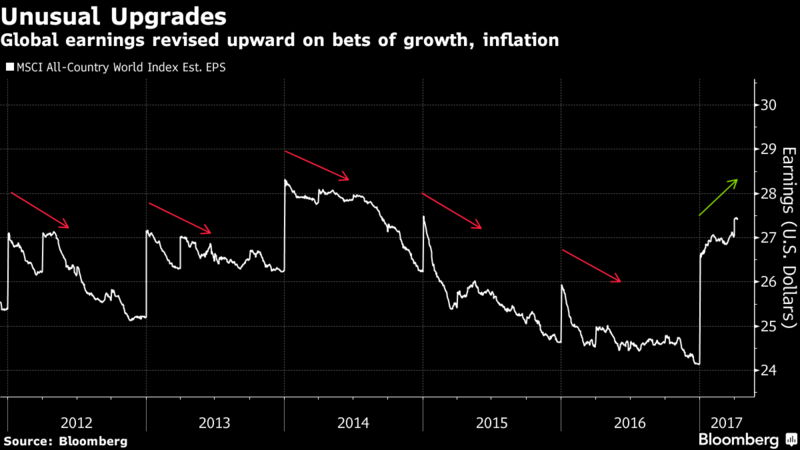
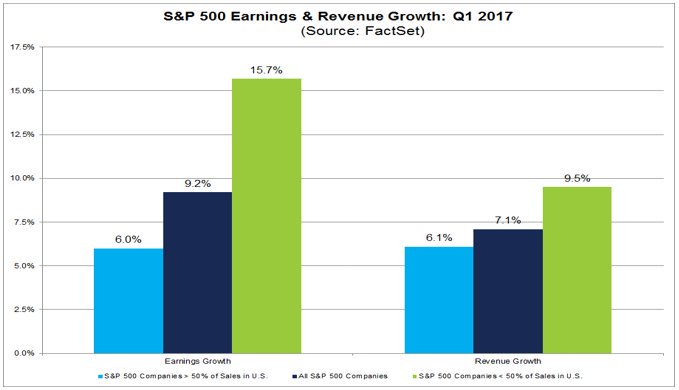
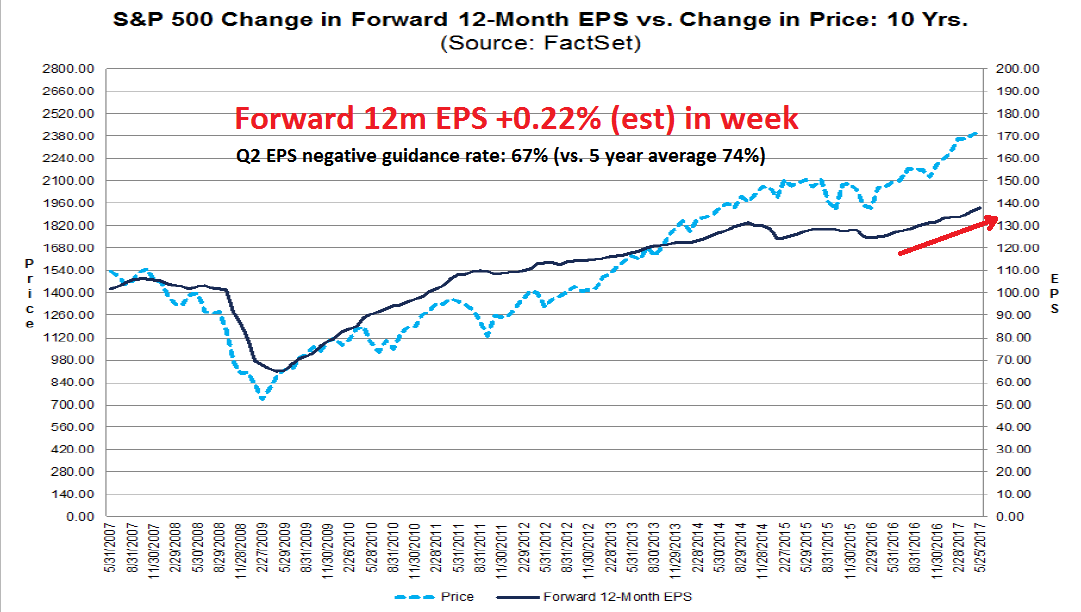
For now, the risk of a major near-term downdraft in equity prices is low. The latest update from FactSet shows that forward 12-month EPS estimates are rising, and Q2 earnings guidance is upbeat by historical standards.
As well, Barron’s report of insider activity shows that these “smart investors” are buying.
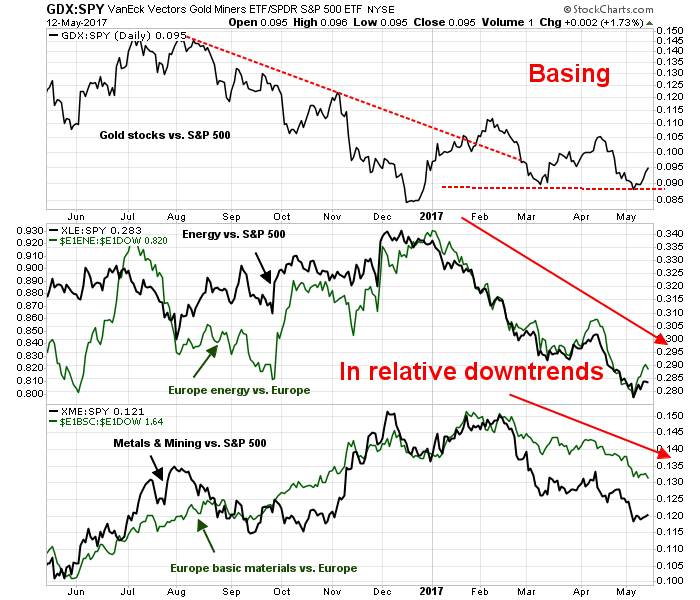
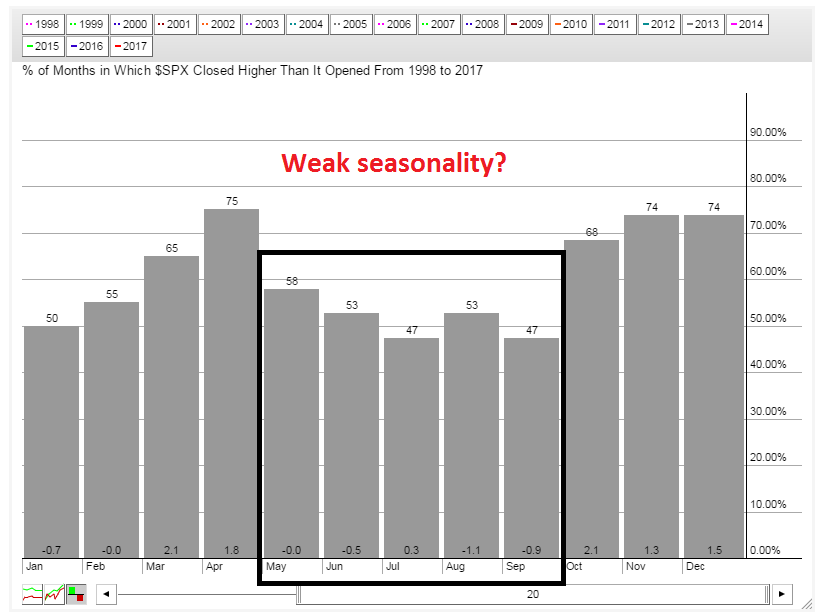
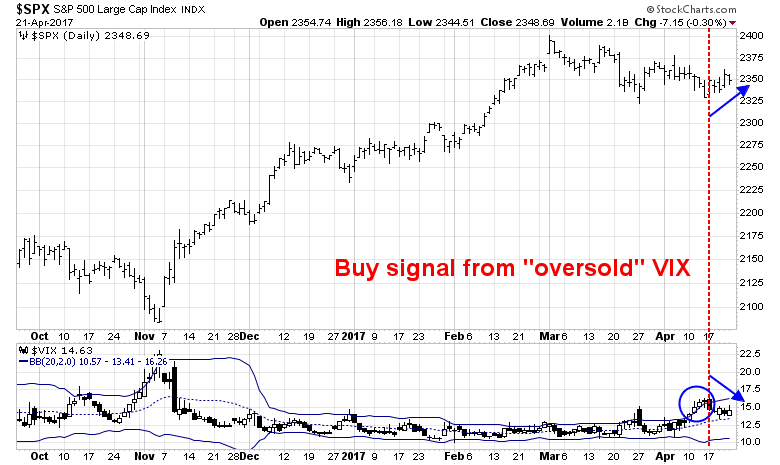
The week ahead
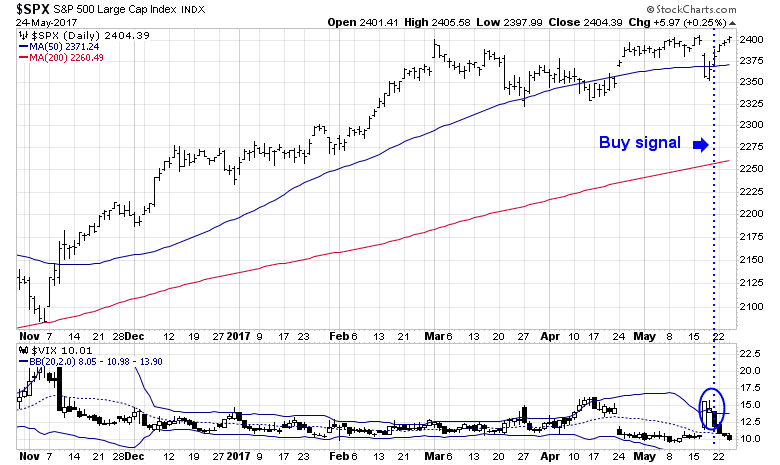
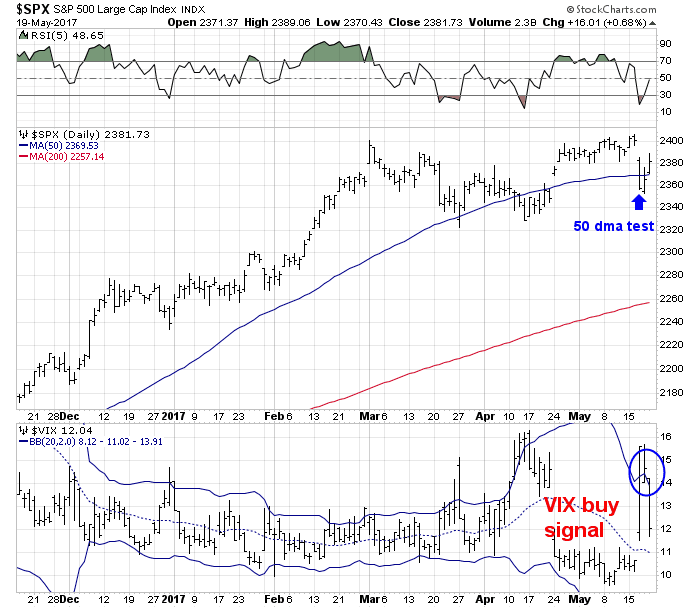
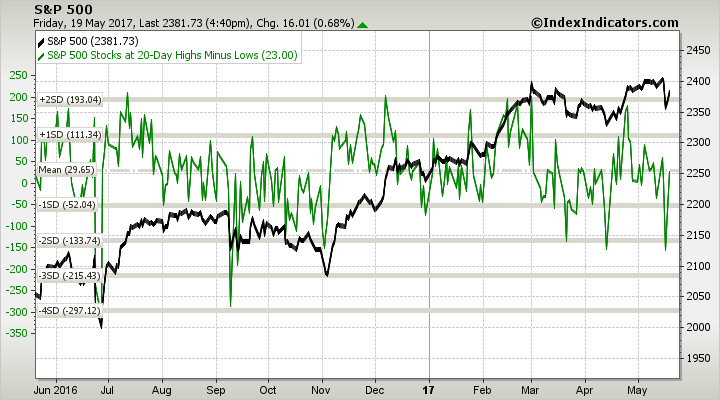
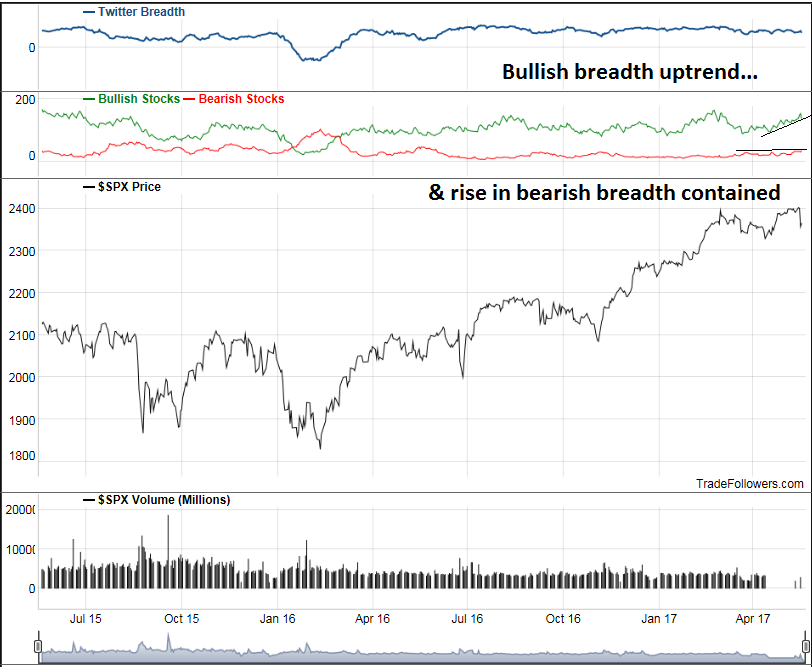
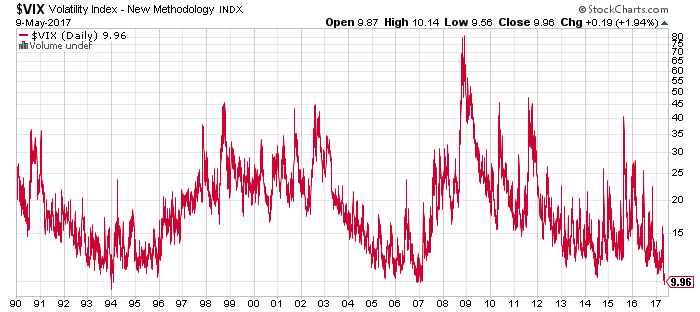
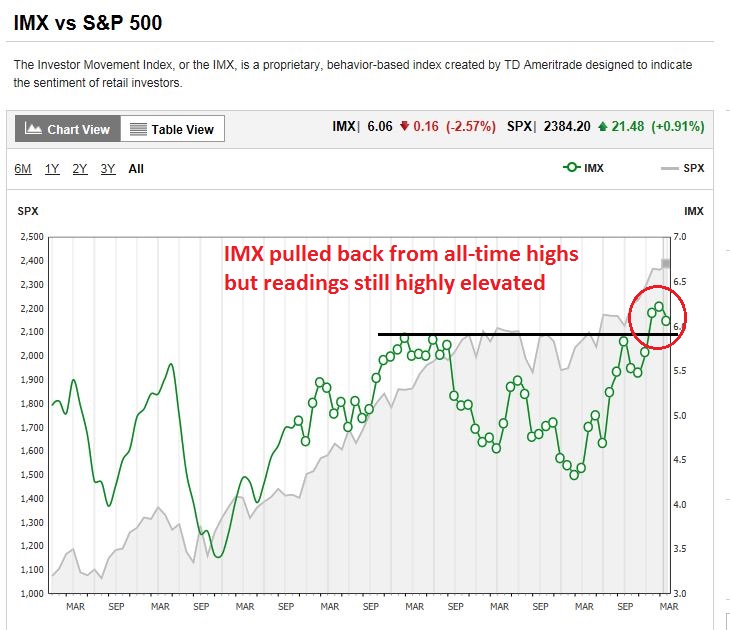
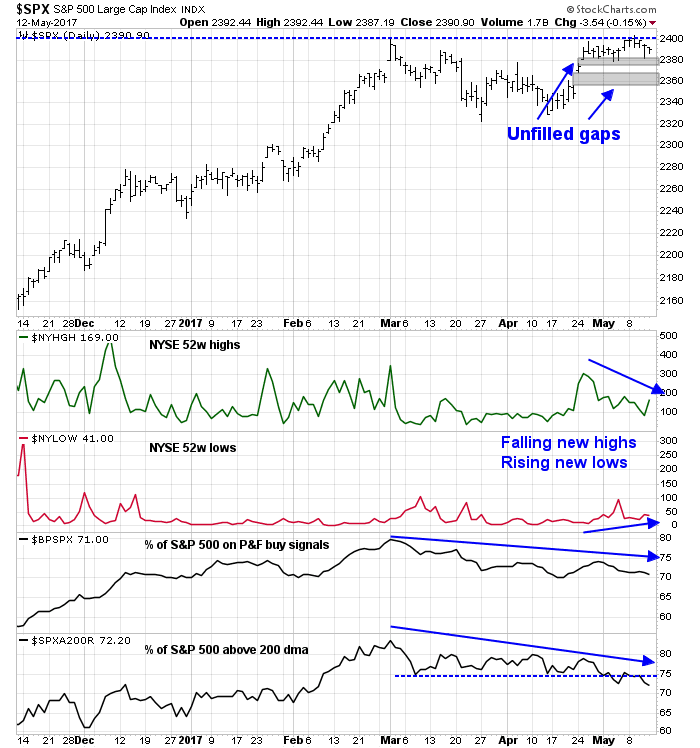
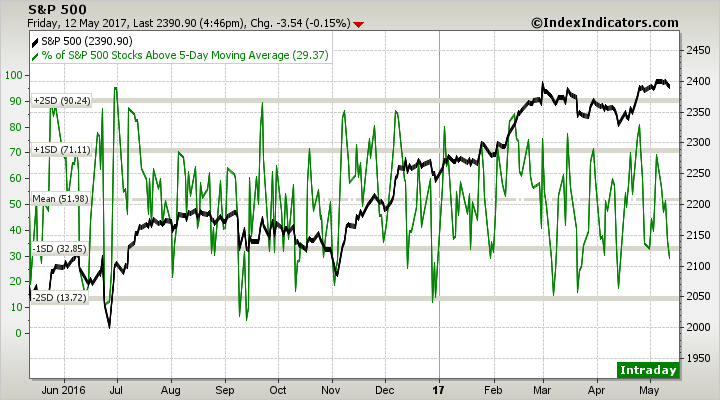
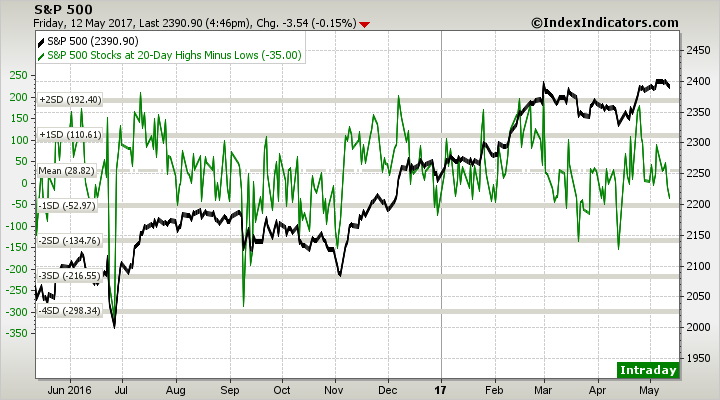
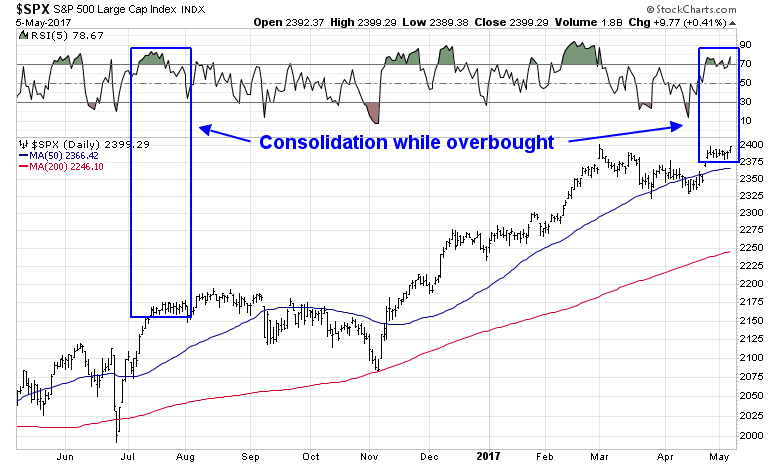
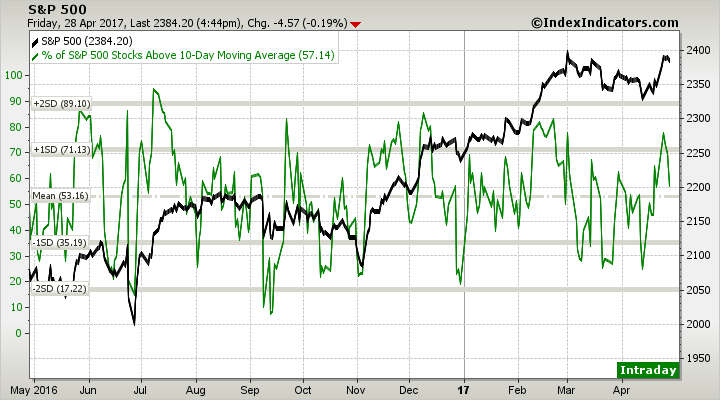
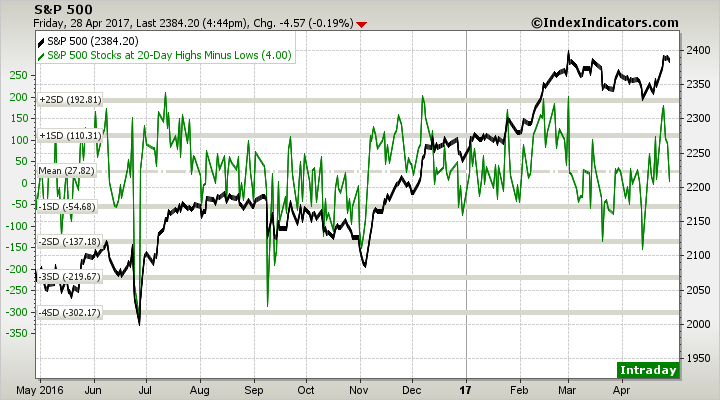
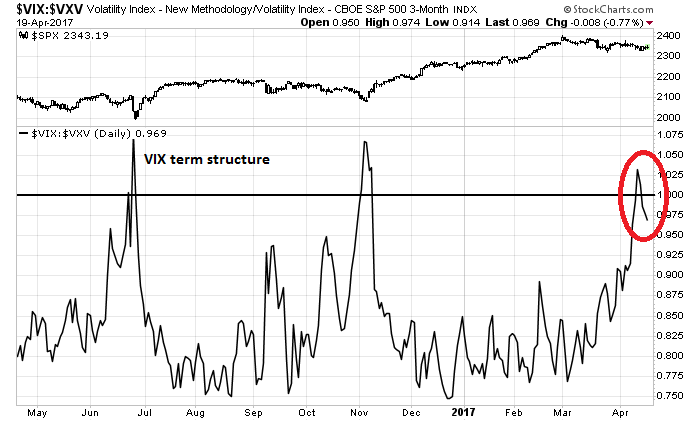
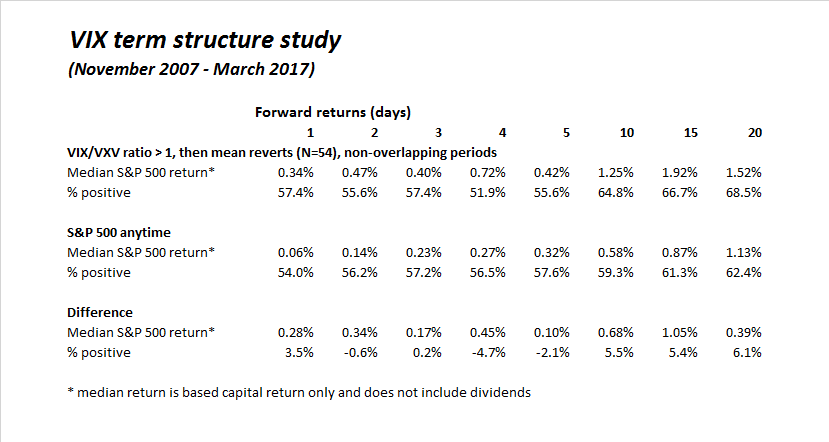
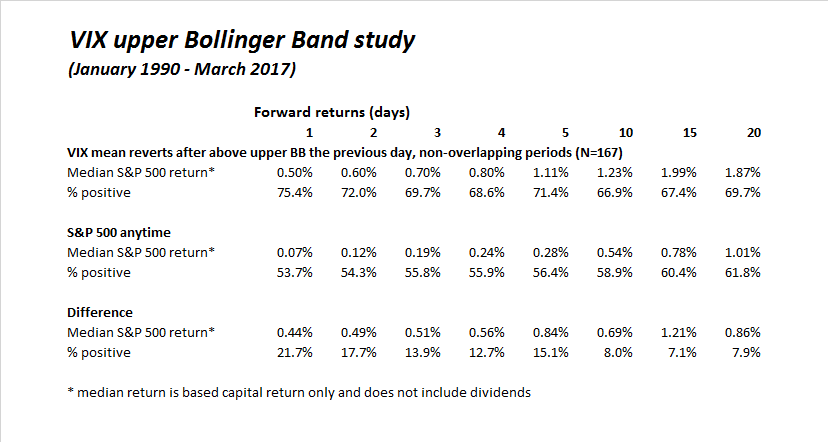
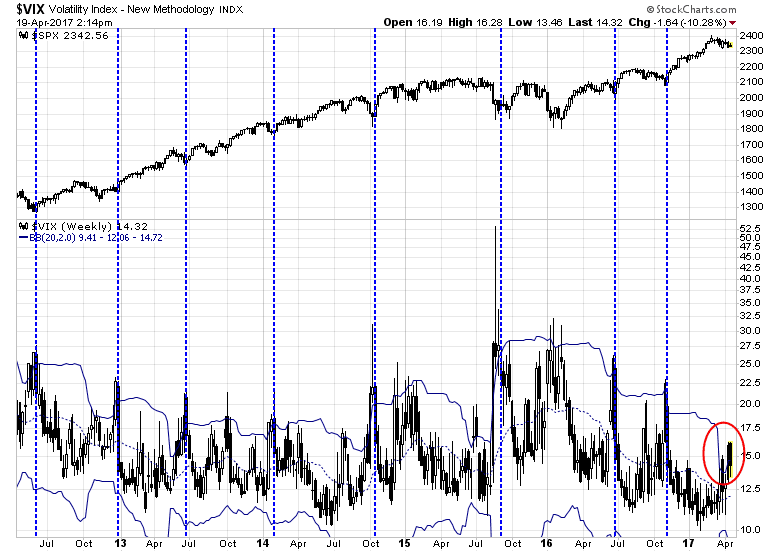
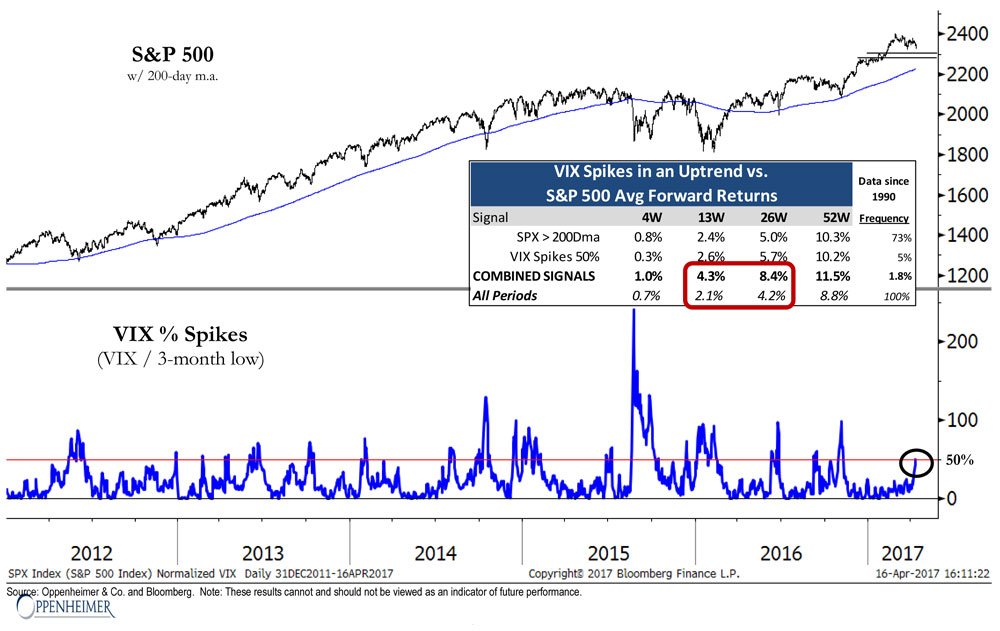
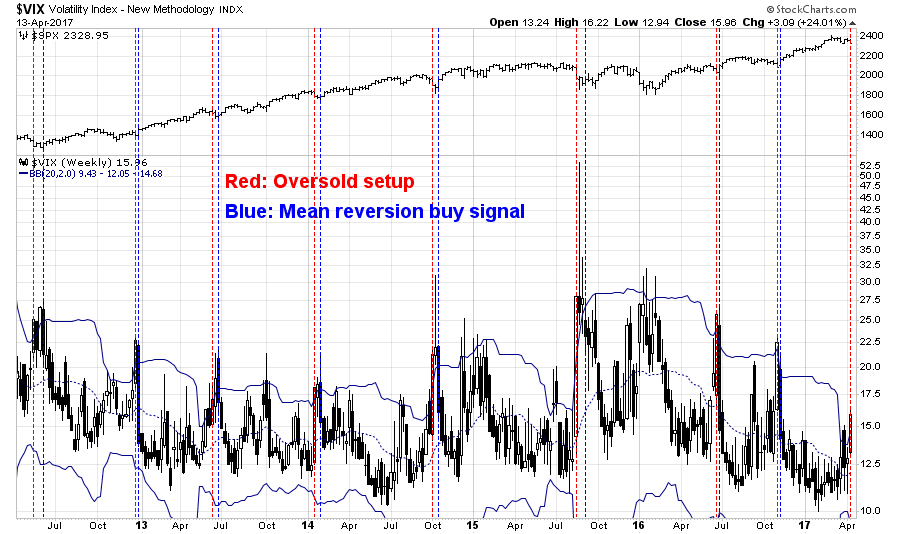
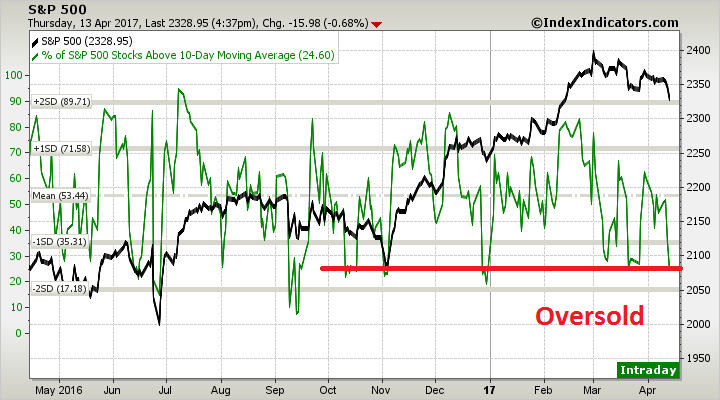
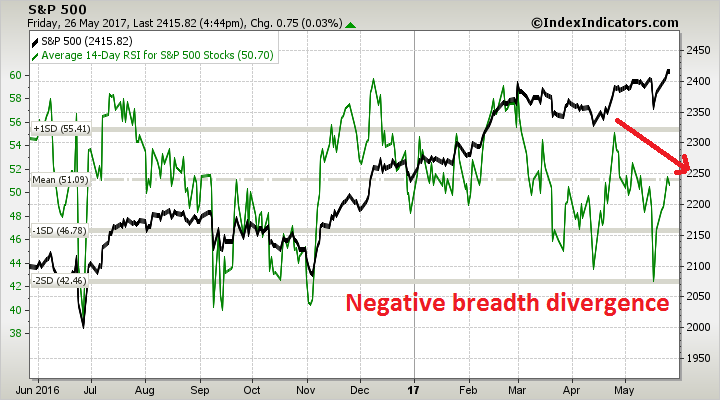
Looking to the week ahead, I recently detailed the headwinds that the market faced after the recent VIX based trading buy signal (see The market’s hurdle to sustainable new highs). The latest readings from Index Indicators suggest that the market is due for a breather, either in the form of sideways consolidation or mild pullback. Short-term (1-2 day) breadth indicators rose to an overbought reading and began reversing, indicating possible weakness early in the week.

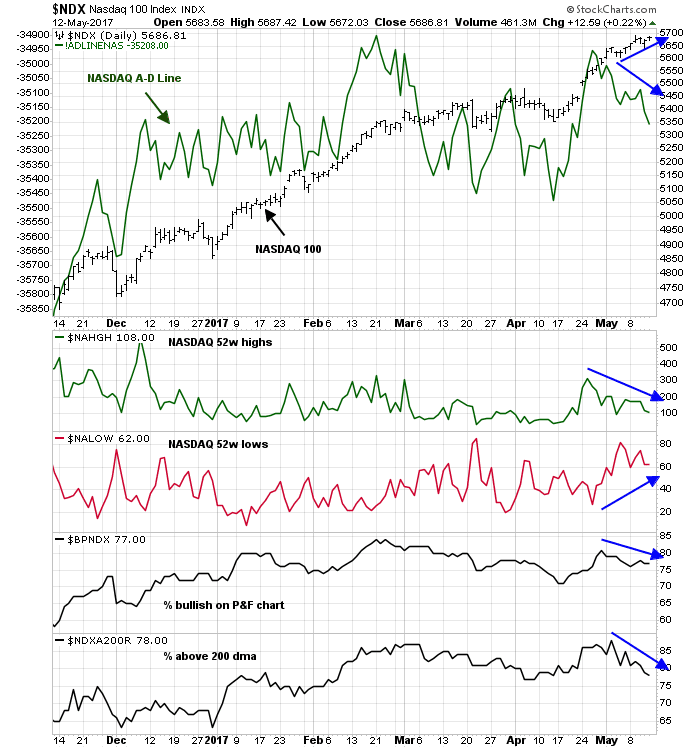
Longer term (1-2 week) breadth indicators is showing disturbing signs of a negative divergence, which is also not good news for the bulls.
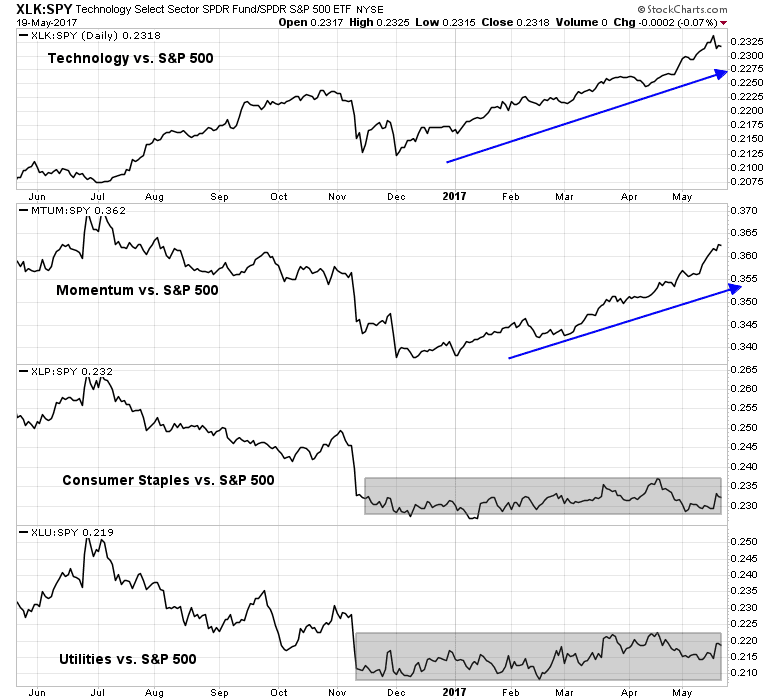
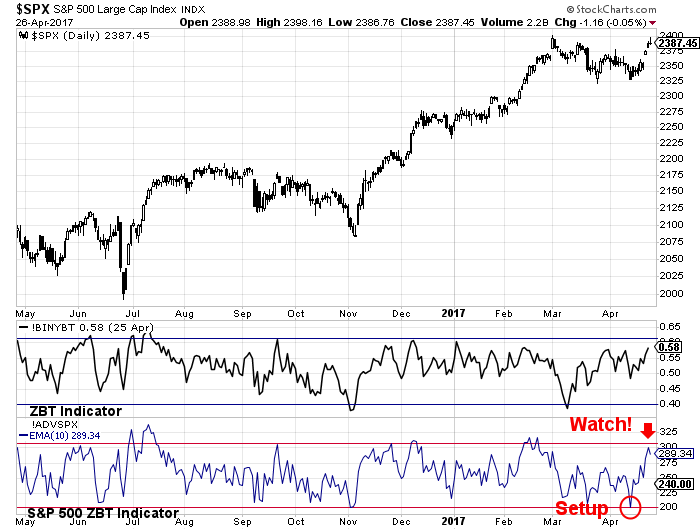
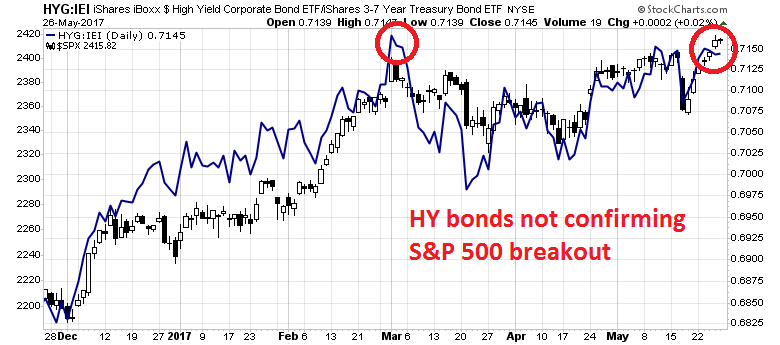
Similarly, risk appetite in the high yield bond market is also flashing cautionary signals. The relative price performance of high yield, or junk bonds, against equivalent duration Treasuries failed to make a new high even as stock prices staged an upside breakout.
My inner investor remains bullishly positioned. My inner trader is giving the bull case the benefit of the doubt for now, but he is tightening up the stops on his long positions.
Disclosure: Long SPXL