Preface: Explaining our market timing models
We maintain several market timing models, each with differing time horizons. The “Ultimate Market Timing Model” is a long-term market timing model based on the research outlined in our post, Building the ultimate market timing model. This model tends to generate only a handful of signals each decade.
The Trend Model is an asset allocation model which applies trend following principles based on the inputs of global stock and commodity price. This model has a shorter time horizon and tends to turn over about 4-6 times a year. In essence, it seeks to answer the question, “Is the trend in the global economy expansion (bullish) or contraction (bearish)?”
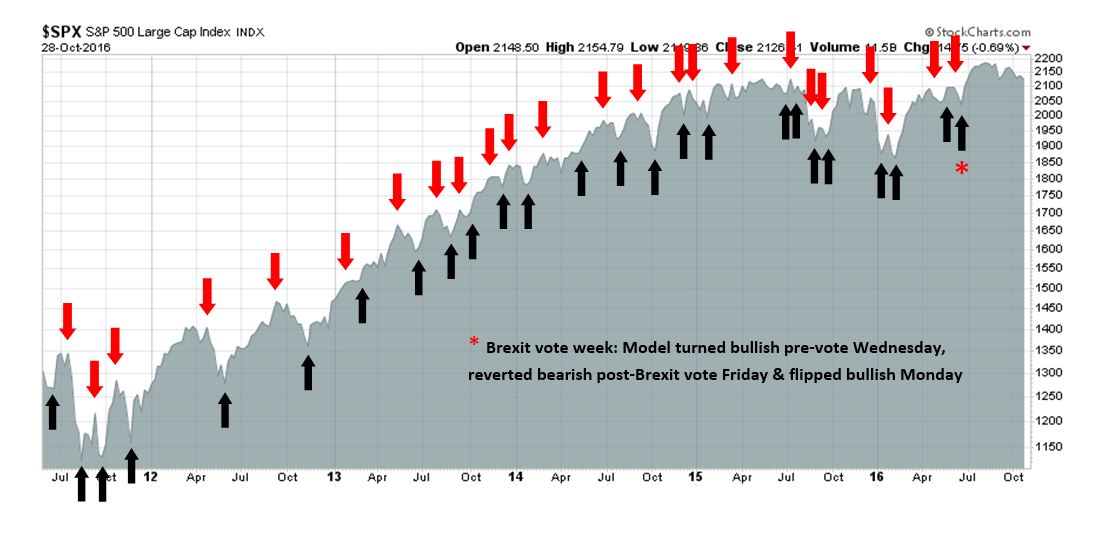
My inner trader uses the trading component of the Trend Model to look for changes in direction of the main Trend Model signal. A bullish Trend Model signal that gets less bullish is a trading “sell” signal. Conversely, a bearish Trend Model signal that gets less bearish is a trading “buy” signal. The history of actual out-of-sample (not backtested) signals of the trading model are shown by the arrows in the chart below. Past trading of the trading model has shown turnover rates of about 200% per month.
The latest signals of each model are as follows:
- Ultimate market timing model: Buy equities
- Trend Model signal: Risk-on
- Trading model: Bullish
Update schedule: I generally update model readings on my site on weekends and tweet any changes during the week at @humblestudent. Subscribers will also receive email notices of any changes in my trading portfolio.
In the absence of political tail-risk…
Up until Friday, the big story of last week was the bond market’s shellacking in the face of rising inflationary expectations. I had been planning to discuss whether the rout in bonds is likely to take down stock prices.
Then the news hit the tape that the FBI was investigation new Clinton emails that were discovered in the course of the Anthony Weiner sexting investigation. Stock prices, which were up modestly, tanked on the news. At the height of the sell-off, the SPX fell and tested the key support level at 2120, and the market flashed oversold warnings on selected indicators. By the close, the bears were unable to gain the upper hand and 2120 support held.

As the market has been trading sideways since the upside breakout in July, the question is whether this news is enough to signal the start of a bear phase (see my last post The bulls and bears wait for Godot). The bulls had been unable to push stock prices to new highs despite the emergence of renewed growth (see Q3 earnings season: Stud or dud?), can the bears take advantage of the news of a new FBI probe of Hillary Clinton`s email to weaken stock prices?
I begin this week’s market analysis with an examination of the stock market’s macro and fundamental backdrop. and then consider the ramifications of Friday’s political bombshell.
The bond market rout
Until Friday, the biggest market headlines related to the rout in the bond market. As the chart below shows, the increase in interest rates was global in scope, It wasn’t just about anticipation of Fed rates in the US, nor was it just about Brexit jitters and falling Sterling in the UK, German Bund yields rose as well.

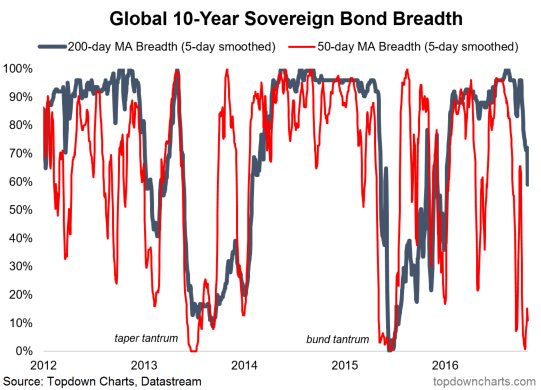
As an illustration of the universal carnage in bond prices, Callum Thomas at Topdown Charts showed the negative breadth of global sovereign bond prices in the chart below. From a technical perspective, bond prices may be oversold enough to see a bounce.
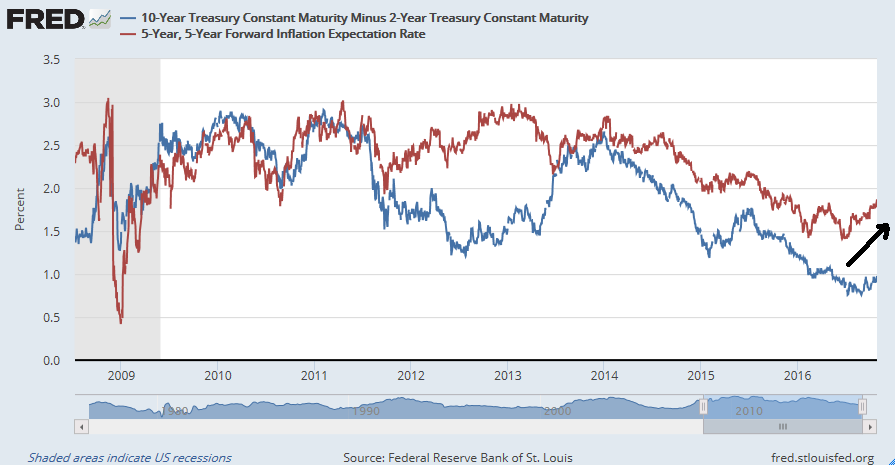
The main cause of the backup in interest rates was rising inflationary expectations. As the chart below shows, global inflationary expectations have bottomed and started to rise, which eventually fed through to higher bond yields.

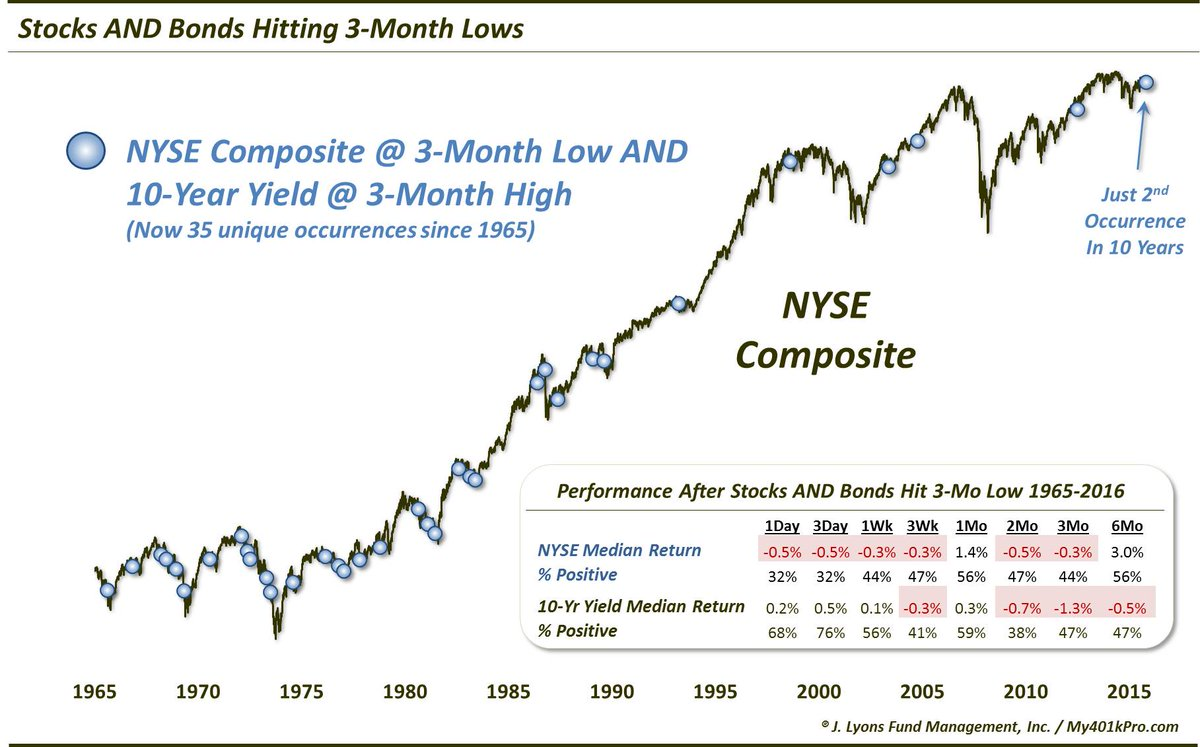
Will the sell-off in bond prices also spook the stock market too? Dana Lyon highlighted a historical study of rising rates and weakish stock prices. The prognosis doesn’t look too good for equities.
What about growth?
All is not lost. I have made the point repeatedly that stock prices tend to rise during the initial phase of an interest rate hike cycle. That’s because the market focuses more on the bullish effects of improving growth, rather than the bearish effects of higher interest rates.
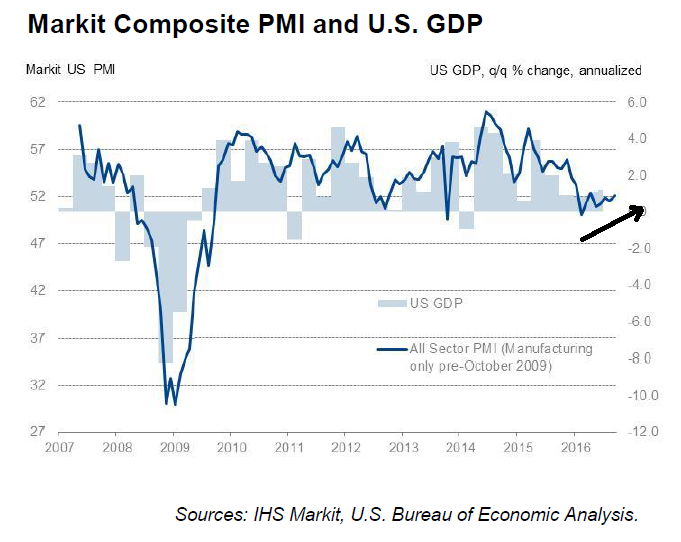
We are also starting to see the signs of a cyclical recovery in growth. It began early last week with the upbeat Manufacturing and Services PMIs, and ended with the 2.7% Q3 GDP growth, which beat expectations.
Other signs of cyclical recovery were also in evidence. Industrial commodities rose to test a key resistance area. The strength in industrial metals is particularly remarkable in light of the strong Dollar. Historically, the USD has been inversely correlated with commodity prices.
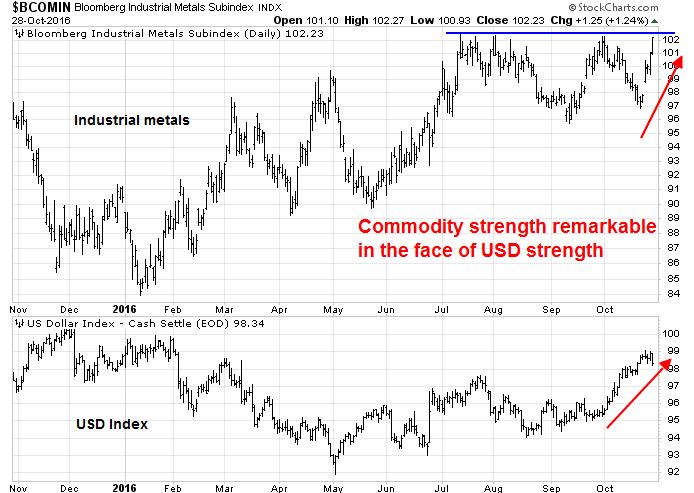
An analysis of the Commitment of Traders data from Hedgopia reveals that large speculators (hedge funds) are in a crowded long position in the USD. When you combine that with a technical test of overhead channel resistance and an overbought reading in the USD Index, the Dollar is likely to weaken in the short-term. A weaker greenback could therefore provide tailwinds for higher commodity prices.

Even though inflationary expectations from the bond market were rising, the yield curve was also steepening, which is a signal that it expected higher growth. This confirms my belief that the fixed income market expects the positive effects of better economic growth to overcome the negative effects of monetary tightening.
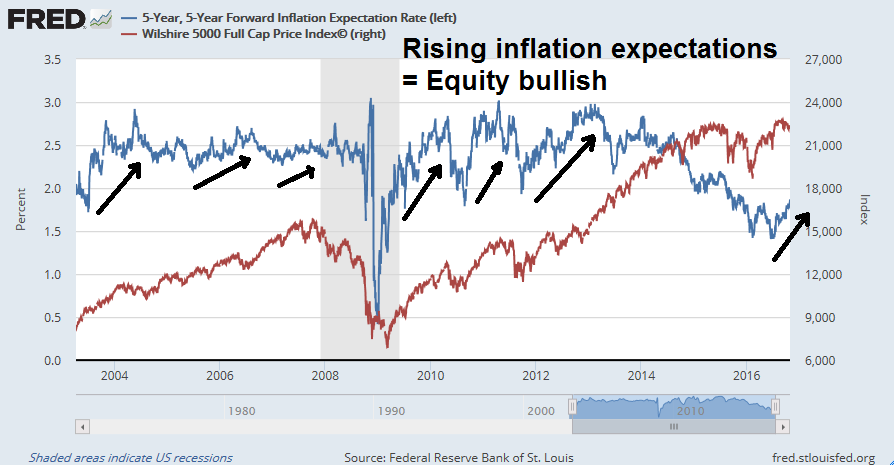
Rising inflationary expectations is equity bullish. In the past higher inflationary expectations have provided a cyclical lift to equity prices.
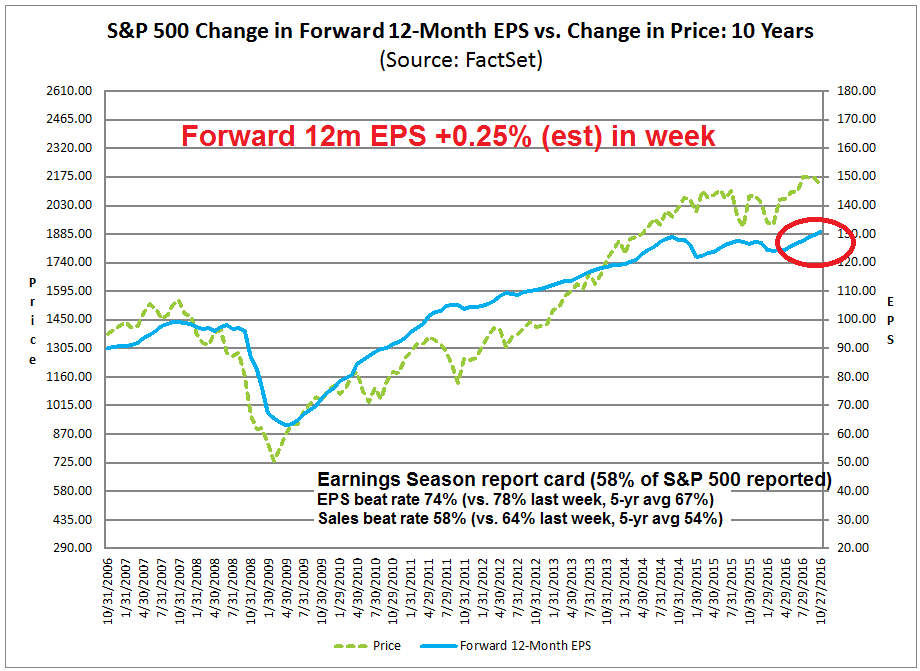
Along with inflationary expectations, growth expectations are also on the rise. The latest update from John Butters of Factset shows that forward 12-month EPS continues to march upward. Last week’s earnings reports were not as strong as the previous week’s and therefore some of the sloppy market action last week could be attributable to earnings disappointment. However, the overall Q3 interim report card still points to a strong quarter.
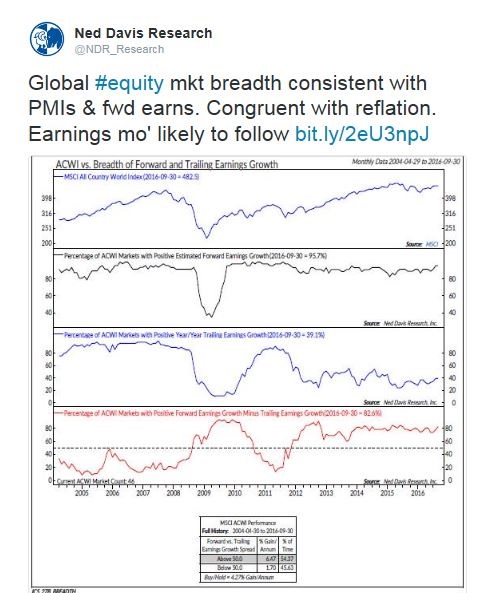
Ned Davis Research believes that earnings growth is likely and consistent with the reflation theme.
Sentiment analysis also favors equities. As the chart below from JPM shows, individual investors have been selling equity funds in favor of bond funds for most of 2016, and relative flow levels are consistent with panic bottoms during the Lehman Crisis in 2009 and the eurozone debt crisis in 2012.
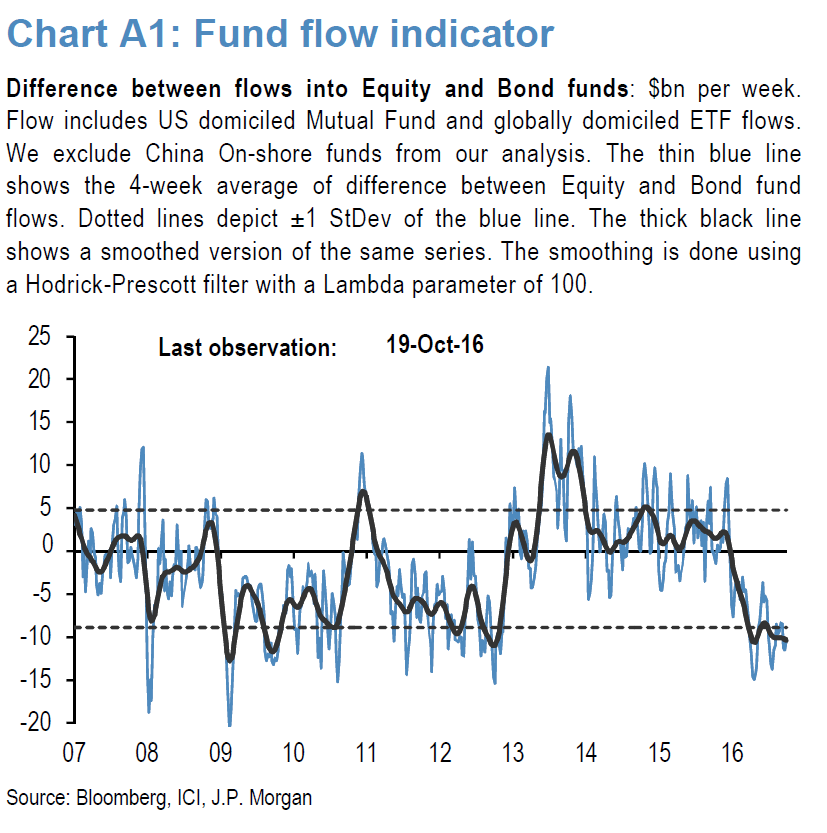
As I pointed out before, institutions had been underweight bonds, roughly neutral weight stocks, and overweight cash (see A sentimental embrace of risk). They have been slowly buying into equities because of the reflation thesis. The fund flow laggards, in this case, are retail investors. The potential for a FOMO rally into stocks is high as the retail money joins the institutional rush into equities.
Stay bullish on stocks
To summarize, the macro and fundamental equity market outlook continues to be bullish on an intermediate term basis. The economy is in the late stages of an expansion where it is starting to overheat. Market participants are starting to shift their focus from safety to growth.
In light of the cyclical recovery and steepening yield curve, a couple of leadership groups that maybe be of interest would be financials and technology. Brian Gilmartin observed:
This requires a separate blog post later this weekend, but for Q4 ’16, Technology and Financial’s are the two sectors seeing higher upward revisions, versus the current Q3 ’16 results. Again, it bears repeating many times for readers, but the trend in revisions at this time for forward quarters is usually downward, so to see upward revisions for a sector is an important tell.
Last week’s equity weakness from a less than robust earnings reports was likely just a hiccup. Gilmartin concluded: “The takeaway today is that Q3 ’16 earnings look very healthy.”
The top panel of the chart below shows that the relative performance of financial stocks is highly correlated with the shape of the yield curve, which is currently steepening. In addition, semiconductors and technology have also displayed leadership within the cyclical group and has potential for further gains.

The fundamental outlook for equities looks bright (in the absence of political tail-risk).
The FBI investigation effect
How do we assess the political tail-risk? For traders and investors, the FBI probe of more Clinton emails could be a game-changer.
As an analytical framework, I am making a key assumption that a Clinton presidency represents the status quo, which is equity bullish, and a Trump presidency represents the unknown, which is bearish. So rather than indulge in instant knee-jerk reaction, let’s take a deep breath and consider what has happened so far.
FBI director Comey sent a letter to Congress on Friday indicating the FBI had “learned of the existence of emails that appear to be pertinent to the investigation” of Hillary Clinton’s personal email server during her time as Secretary of State. The results of any FBI investigation is unlikely to be concluded before the election.
Right now, we know little. Business Insider pointed out that there are wildly conflicting accounts of what is in the emails. Moreover, the DoJ has astonishingly filed a complaint against FBI director Comey.
Benjamin Wittes at Lawfare blog has a more reasoned analysis of the Comey letter to Congress. He believes that it amounts to a CYA exercise by the FBI:
When the FBI wants to say it is reopening an investigation, it knows perfectly well how to say that. In this case, the investigation was actually never formally closed, so it doesn’t need to be reopened. The relevance of this letter is thus likely not that some explosive new evidence of Clinton criminality has suddenly emerged.
It is, rather, that Comey made a set of representations to Congress that have been complicated by new information, apparently from the Anthony Weiner sexting case. So he’s informing Congress of that fact before the election.
Comey represented to Congress that the Clinton email investigation was “complete.” But as the letter relates, new emails have now come to the bureau’s attention that appears relevant to the email investigation. (Weiner’s estranged wife is one Clinton’s top aides.) Comey has okayed a review of that new information to determine whether the emails contain classified material and also whether they are, in fact, relevant. And this fact renders his prior statement to Congress no longer true.
The key point here, in other words, is not that Comey is “reopening” a closed matter because of some bombshell. It is that he is amending his public testimony to Congress that the FBI is done while the bureau examines new material that may or may not have implications for investigative conclusions previously reached.
What about the political fallout from this latest revelation? Polls are useless in cases like these as the data is stale. We do have some clues to the reaction from the analysis of social media (via CNBC):
The headlines about the FBI investigation of Clinton’s emails and Trump’s comments about women spread like wildfire on social media as political commentators from both sides of the aisle weighed in.
Social media analytics company Spredfast said that while both scandals proliferated on Twitter, there were marked differences in the trends.
“In the case of Clinton, we saw a huge spike when the news first broke this afternoon, but buzz has since been declining,” said Chris Kerns, vice president of research and insights at Spredfast. “Conversely, with the Trump tapes, the news built throughout the day and didn’t peak until almost nine hours later with 5.7K tweets per minute.”
Should no further news come out over the weekend, the FBI investigation story is likely to just blow over. Analysis from FiveThirtyEight shows that prior to the news, Clinton held such a commanding lead that Trump has to win virtually every swing state in order to win the election. If there was to be political fallout, the more likely damage would be weakness for the Democrats in down ballot races. The latest update from PredictWise shows that the Clinton odds in the presidential race have edged down slightly, and a diminished probability that the Democrats would take control of the Senate. Since the Senate race margin in many states is only 1-2% points, a minor swing at the last week could dramatically alter the outcome. The Republicans are likely to retain control of the House. Arguably, such an outcome where the race tightens would be slightly equity bullish, as the market tends to prefer gridlock over the takeover of both the Presidency and Congress by any single party.
The stock market reaction on Friday was relatively muted. This chart from IndexIndicators shows that the index has been tested the bottom of a wedge and support held at 2120. In addition, breadth indicators show a mild oversold condition where the market has bounced in the past.

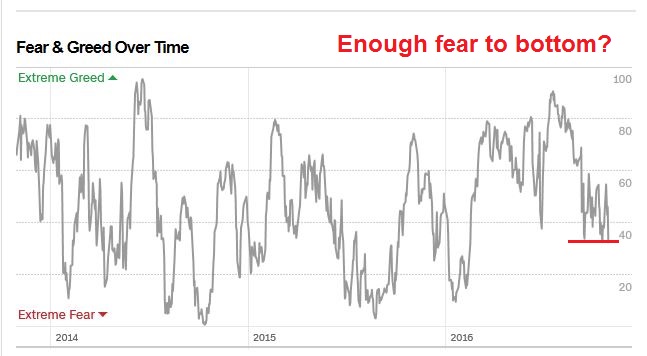
Similarly, the Fear and Greed Index has fallen to a level where the market has bottomed in the past, but could fall further.
In summary, the stock market weakened last week, first in response to higher interest rates, weaker than expected earnings results, and heightened political tail-risk from an FBI investigation of Clinton emails. I have shown that higher rates translate to higher growth, which is equity bullish, earnings results are still better than historical expectations, and political tail-risk is likely to diminish. The market fell but the decline was arrested at a key support level.
My inner investor remains constructive on the equity market outlook. My inner trader is bullish, but nervously watching support levels and sentiment readings.
Disclosure: Long SPXL, TNA
That $SPX 2120 support gets weaker with each test, at least that’s what TA says.
One of my favorite intermediate indicators just went positive, the year over year trend of NYSE margin loans just turned from fewer to more loans. I have believed that this bull market will end in big ramp up in margin loans just like before peaks in 2000 and 2007 before the last two bear markets.
Here is a link to a chart of margin loans I constructed and check when the new monthly margin loan data is announced. keep it, it’s dynamically linked and will update automatically. Margin loans lead the market. The bottom chart compares the six month rate of change of margin loans versus the markets six month change. Loans lead the market. Note the blow-off in margin loan growth in 2000 and 2007 that warned of extreme speculation before the coming bear market.
http://product.datastream.com/dscharting/gateway.aspx?guid=73351b5d-9d28-4193-a706-3fc089933e7a&action=REFRESH
The stage is being set for a big run up both in margin loans and in stock markets. First a Clinton win, second, the Fed raises the overnight rate in December and bond yields fall rather than go up (just like the surprise last January), third, the American dollar surprises and falls (again like last January), fourth, commodity prices are stable as is inflation, fifth, China is tranquil as their leadership summit approaches, lastly, yields on cash will stay microscopic and people will shift to stocks for yield.
When? It could start sooner (election day?) or by year end at the latest, after a December 14 Fed rate increase sees no follow through to higher bond yields or strong dollar.
In all my previous posts I have been consistent in stating that the low in yields were seen on July 8th of this year. That the Central Banks of the world cannot control the long end of interest rates. So far that has come to pass with the latest drubbing of the Bond Market as Cam has pointed out. I felt, also the rise of the dollar would have a meaningful impact on the investment climate. Both events have stalled any rally in the stock market. High dividend paying stocks have seen a substantial decline. After all getting a 3-5% dividend and seeing a 10% decline does not cover the dividend.
Therefore to all the moonies looking for moonless nights in the spirit of Halloween I offer a little gallows humor: Bad moon rising :https://www.youtube.com/watch?v=NL8exUOzkxE
On a more serious note 9/7, 9/22, 9/30 and 10/10 saw the S&P 500 make a series of lower lows. As Thomas has correctly pointed out this in technical terms would be called a declining triangle. If and when the market breaks the decline should find support at the 200 day moving average which is around 2060 on the S&P 500.
On the political front Clinton’s misfortune opens an interesting investment opportunity. Bio-Technology has been decimated because the market felt that the Democrats would control both the Houses. Now that seems unlikely. I am long the index. The risk reward is good and worth a review.
To Ken’s scenario I can only say that only certainty in life is death and taxes. If he is right, that would be a tremendous opportunity which should be exploited. I am ready. Lets all vote for a melt up!!!!!!!!!!!!!!!
From a tactical viewpoint, I am keeping an open mind as to what is likely to happen. I have no idea of whether 2120 will break as support. Next support will be at 2100 and then further support will be the 200 dma.
Already I am seeing short-term bearishness as the market weakens and it wouldn’t take much for sentiment to get to such an extreme that the sentiment models would scream “buy”. Therefore I remain bullish on an intermediate term basis – unless the fundamentals start to turn seriously south.
Good one Rajiv!
Speaking of Creedence Clearwater Revival, I saw John Fogerty in concert a few weeks ago. He puts on a great show. Hey, everybody, if you get a chance, see him. It’s a feel good, fun night.
So your take on a Brexit election in the US of a Trump victory would be a breaking of the 2120 level and a bearish market? Isn’t that getting baked in somewhat already with a reaction like we saw on Friday. It seems like any break of this 2120 level would cause all of the indicators to flash an extremely oversold condition and thus a buy. I can’t see an election result having any immediate or intermediate economic effect. It may long term but so much would be unknown at that point time would have to tell.
The best analogy for you short term traders is those car rallies where high performance small cars go fish-tailing through the country-side at breakneck speeds with a driver and a navigator frantically trying to stay on the road while going insanely fast. I see Cam as the navigator, cool and calm reading maps and calling out turns ahead, while short term trading subscribers are the drivers, eyes locked on every small zig and larger zag, adrenaline pumping and skills tested constantly.
All fun and exciting, but us intermediate traders are just wanting a sweet drive in the country with the family on a nice day. Here is the weatherman’s report for 2017, sunny with little chance of rain. That’s what we like.:
http://www.forbes.com/sites/daniellemarceau/2016/10/31/2017-economic-forecast-better-than-2016/#44389fdc408a
2017 Economic Forecast: Better Than 2016 – Forbes
Don’t fret, my short term trading friends. There will be plenty of curves to keep your attention, just less dangerous ones. And we might see long stretches of boring straight road where you can get the pedal to the floor.