Mid-week market update: When traders refer to “institutions” in the context of sentiment analysis, often the impression is that institutions represent some monolithic entity. Nothing could be further from the truth. I tend to analyze institutional sentiment by segmenting them into four distinct groups, each with their own data sources:
- US institutions, whose sentiment can be measured by Barron’s semi-annual Big Money Poll
- Foreign and global institutions, as measured by the BAML Fund Manager Survey (FMS), which is conducted on a monthly basis;
- RIAs, as measured by the NAAIM survey, conducted weekly; and
- Hedge funds, as measured by option data and the CFTC futures Commitment of Traders data, though hedge funds are partly represented in the BAML FMS sample.
Each group is different and they can behave differently. The first three tend to represent slow but big money, while hedge funds represent the fast and high turnover money.
The differing groups of institutions don’t always agree. Today, however, the US and global institutions all seem to have formed similar views. Institutional investors are bearish on bonds and they are becoming increasingly bullish on stocks, based on a belief that growth is improving.
Under these circumstances, the key question for traders and investors is whether they should jump on bullish equity bandwagon or be contrarian and fade the institutional purchases.
How the surveys are different
Before answer that question, I would first like to examine the data and discuss the pros and cons of each data set. Barron`s Big Money Poll is conducted every six months and the survey is done on a sample of US-based managers. While the survey frequency may not necessarily be to our liking, institutional money is slow money and therefore a semi-annual survey is not necessarily a problem because of the relatively low turnover of this investor group. The main shortcoming of the Barron’s poll is it provides only a snapshot of respondent attitudes, with little history of responses. As an example, we can see that managers are tilted bullishly, but how does that compare to its own history?

The BAML FMS is conducted monthly and the sample size is broader and it is composed of managers with a global outlook. There are many non-US managers in that survey. The questions tend to cover global issues and not just US domestic ones. A comparison of the responses between the Barron’s Big Money Poll and the BAML FMS can be revealing as foreign and US managers don’t always agree. Unlike the Barron’s poll, the BAML FMS does provide a history of responses, which can be useful as it gives us an idea of whether managers are in a crowded long or short position. However, the published questions are not always consistent from one month to the next. As an example, the September report showed the equity positioning of hedge funds was an extreme. What happened next? The October report gives no details.
By contrast, the NAAIM survey is conducted on a weekly basis and the sample are RIAs who manage retail accounts. The NAAIM survey only asks a single bull vs. bear question and lacks the depth of the other surveys, which asks questions about macro-economic issues and asset and sector preferences. As the chart below shows, the NAAIM data (bottom panel) has tended to be more useful as a buy signal when RIAs are panicked (vertical blues lines) than as sell signals when RIAs are complacent (grey areas). Currently, RIAs have been ramping up their equity exposure from the January market bottom but readings are not extreme yet.

Bond bears
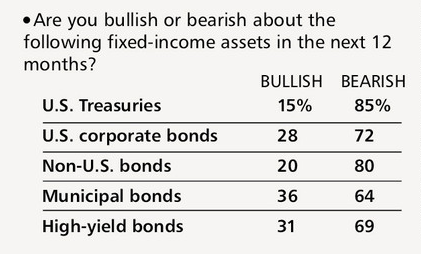
The one characteristic that stands out from both the Barron’s and BAML surveys is a high degree of bond market bearishness. I have seen some analysts point to the high level of cash from the BAML FMS as a sign of cash on the sidelines waiting to go into the stock market, but that is a misinterpretation of the data.
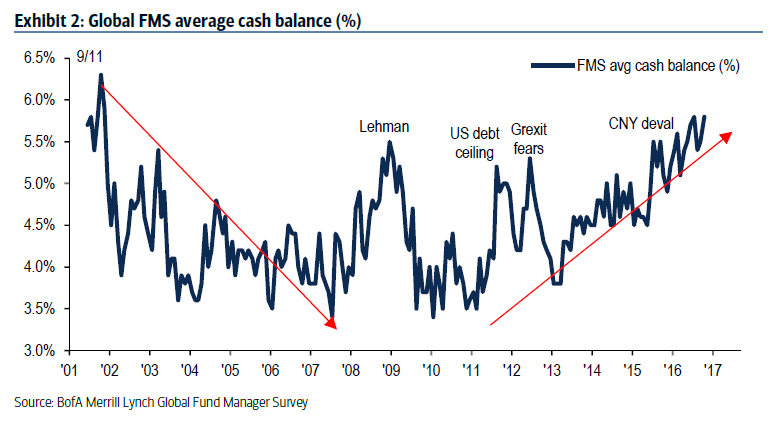
Even though cash levels are high, equities are roughly at neutral weight.

Cash is high because funds have come out of the bond market.

We are seeing a similar level of caution in the Barron’s Big Money Poll.
Better growth ahead
In effect, institutions are becoming more cautious on the bond market in anticipation of Fed action to raise rates because of a better growth outlook,
Barron’s is showing a similar response.

Rising risk appetite
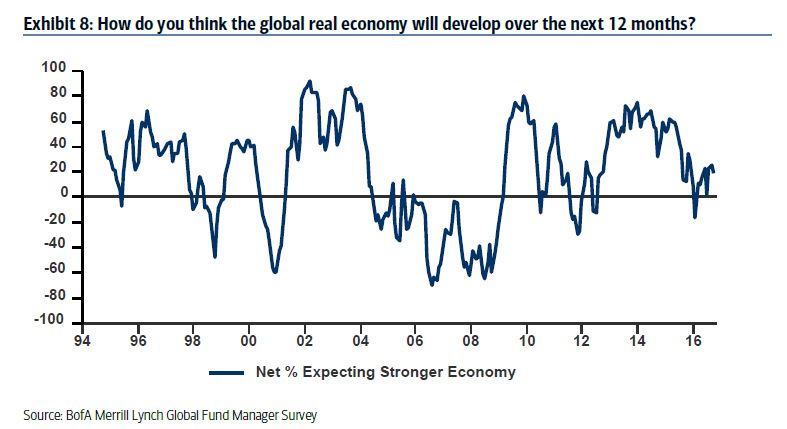
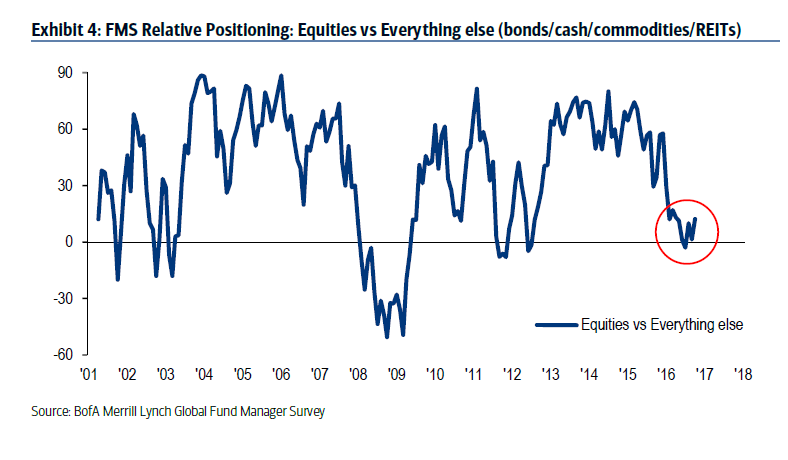
Managers are starting to raise their risk appetite because of their better growth outlook. Overall positioning shows an underweight in risky assets.
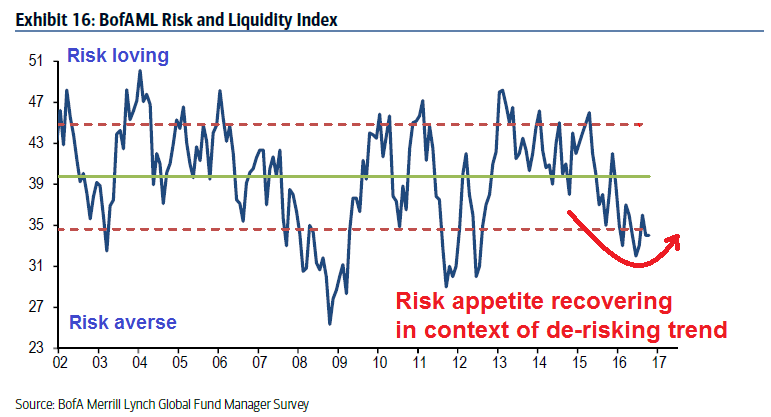
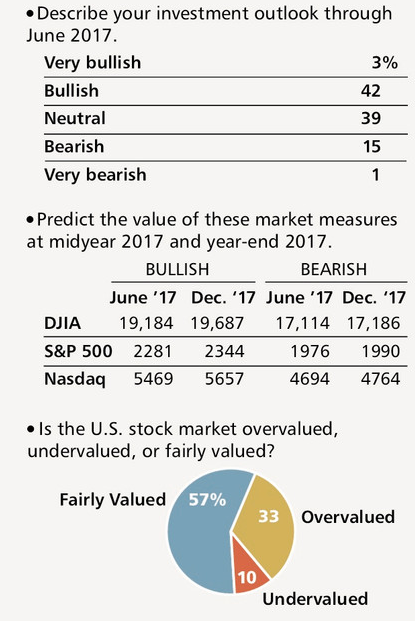
We can see similar hints of rising risk appetite from the Barron’s Big Money Poll. Barron’s reported that bullishness increased from record low levels, which suggests that managers are far from a crowded long position [emphasis added]: “Our latest poll finds 45% of respondents bullish or very bullish about the market’s outlook through the middle of 2017, up from the spring poll’s record-low tally of 38%.”
The BAML FMS shows that managers are slightly underweight in US equities.

The magnitude of the bullishness in the Barron’s survey appears to be relatively modest. Managers believe that the SPX will only appreciate 7% to June 2017 and a further 3% to December 2017. A one-year expected return of 10% on the stock market doesn’t seem like wild bullishness.
If we get an upside growth surprise, the potential for a FOMO melt-up is high (see Q3 earnings season: Stud or dud?). Equity weights within balanced portfolios are still low by historical standards.
Hedge funds and individuals
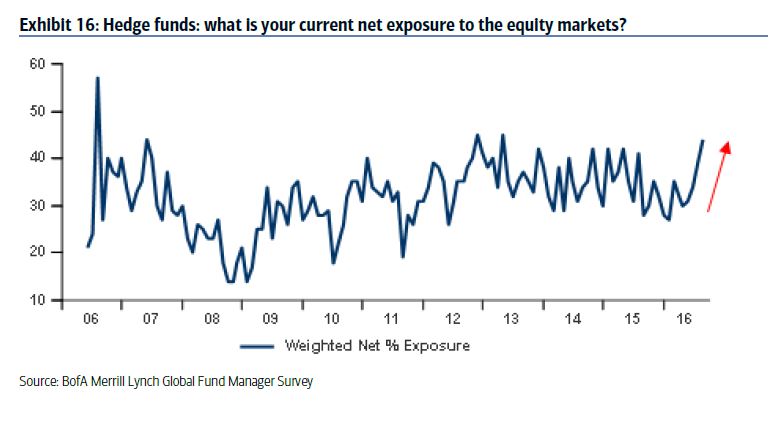
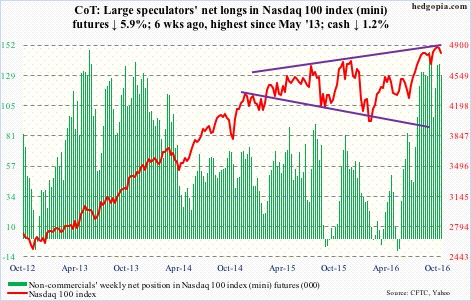
No review of sentiment models would be complete without an understanding of hedge fund and individual investor positioning. The picture on the fast money is mixed. On one hand, COT data from Hedgopia shows that large speculators, or hedge funds, have moved from a net long to net short position in SPX futures.
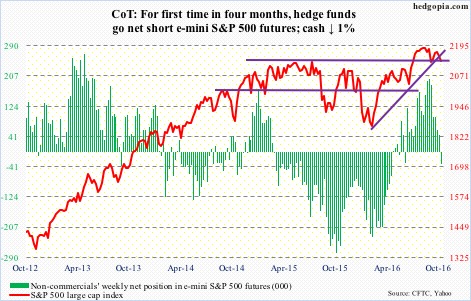
On the other hand, large speculators remain in a crowded long in high-beta NASDAQ futures.
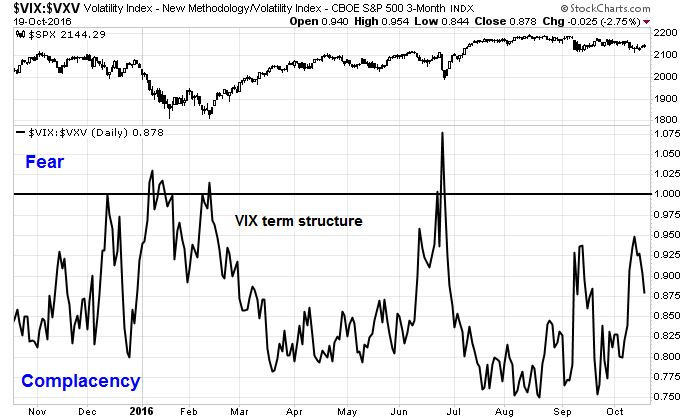
Option sentiment isn’t giving a clear picture either. The term structure of the VIX is showing a neutral reading, somewhere between extreme fear and complacency.
Individual investors and traders appear to be similarly confused. Both the AAII and Rydex are in neutral, with a slight bearish tilt, which is contrarian bullish. These readings could be interpreted bullishly given the market is very close to its all-time highs.

The TD-Ameritrade Investor Movement Index, which surveys the aggregate actions of its account holders, shows a pattern similar to NAAIM. Individual investors have been buying the market since the January bottom, but readings are not at an extreme level yet.

Investment conclusions
Sentiment analysis is showing that investors of all stripes are starting to embrace the idea of renewed growth. Risk appetite is growing, but portfolio positioning are nowhere near crowded long extremes yet. The fast money traders have been quick to jump on the developing bullishness, but have pulled back their exposure a bit as the market has consolidated sideways.
We are in a holding pattern, but if the positive macro momentum were to continue, there is plenty of room on the bullish bandwagon.
Disclosure: Long SPXL, TNA
Still long SPXL, TNA??
Yes, sorry I have added that disclosure
Hi Cam, I am missing recommendation for the rest of this week. Can you pls add two three lines about this? Thx in advance. P
Please forgive me for the length of this post. I admit I’m using you folks to organize my thinking. Cam’s incredible detailed work on indicators helps me understand how the macro backdrop is playing out. The macro is where I live and it has been good for me and my portfolio clients. Over the last year to the end of the third quarter my clients have outperformed the S&P 500 by over 10%. That was due to recognizing and taking advantage of an incredibly important macro shift on January 20, 2016 that I believe will go down in financial history as the most significant financial event since Lehman in 2008. This will become evident over the next 4 to 6 months. Let me explain why.
That event was the sudden realization of ‘lower for longer’ in interest rate long term forecasts. It broke the ‘reversion to mean’ thinking and the battle between these two concepts has been waged this year. I talked with Charles Gave of Gavekal at the end of his world tour this week of institutional clients. He said this is the major philosophical fight in the investment world.
When you look at all the charts in Cam’s analysis above, you will see a big drop in the fourth quarter of 2015 and a further drop early in 2016. This was totally, in my mind, due to the impending Fed rate hike in December that actually came about on the 16th. It was telegraphed by an over 70% probability futures market expectation so investors were positioning for it ahead of time and reacting to the reality after. Take yourself back to that time. This was going to be the first increase in almost eight years. The world thought (me included) interest rates had been held down artificially by Central Bankers and the December hike was going to the first hike to take off the pressure. Projections of four hikes in 2016 and more beyond were the gospel. This was finally going to be the start of the ‘reversion to mean’ of these artificially low interest rates (long rates as well) back to the norms of inflation plus 2% real or 4%.
Then something totally shocking happened. After bond yields went up a bit in the two weeks after the hike, interest rates on bonds plunged instead of rising. Market projections of further 2016 hikes started melting away. A ‘lower for longer’ idea started to take hold. I don’t think people are fully appreciating the significance of this new change of thinking. I say again the belief that in future this will rank in importance with the Lehman event in 2008 in financial history.
Let’s look at the effect on market sectors of the reversion to mean before and right after the Fed hike in December 2015;
First, the U.S. was going to be the only country to raise rates. This made the U.S. dollar rise sharply and forecasts had it soaring more when future rate hikes in 2016 would carry U.S. rate spreads versus its trading partners much higher.
Second, since commodities are priced in U.S. dollars, the stronger dollar was causing a crash in all commodities. This put an additional downward pressure on commodity currencies such and the Australian and Canadian dollars that were literally crashing.
Thirdly, higher rates were going to hurt the economic performance of a highly indebted world. Stock markets were falling accordingly. Junk bond yield spreads were exploding and not just the energy junk. Yield oriented stocks were falling and underperforming.
All of these areas on the charts above were plunging before and after the Fed December hike until mid-January. They turned on a dime. Why? Because the bond market took off at the start of the year and bond yield were plunging, totally the opposite of everyone’s expectation. Two weeks of this surprising event later and the panic selling of commodities, commodity currencies, commodity producers, yield stocks turned to aggressive buying. That turn started exactly on January 20th. The next month on February 11th, the non-commodity and growth oriented sectors of the stock market joined in the party.
The ‘lower for longer’ theme that was born on the 20th of January is still not proven to die-hard ‘reversion to mean’ long-term experienced, successful gurus and portfolio managers. Witness that only 15% of them have outperformed the market over the last year, an extremely low number. The hedge fund world is in disarray, I believe for the same reason
We are coming up to the next big test of the lower for longer theme. The odds of a Fed hike this December in now over 70%, just like last year. They seemed to have backed themselves into a corner even though some of the economic statistics are suspect (according to David Rosenberg). We are starting to hear the reversion to mean folks talk about higher rates for bonds, a stronger U.S. dollar. Many of the same things as last year before the December rate hike, but without the total buy-in by investors. The big surprise that happened after last years hike has taken away the blind confidence in the reversion to mean story.
I expect we could easily see some of the same action in the next couple of months before the rate hike as last year but more muted. Pressure on bonds, worry about the economy, higher U.S. dollar, pressure on commodities including gold and pressure on high yield stocks.
After they do hike will be the NEXT MOST IMPORTANT TIME IN STOCK MARKET HISTORY. It will be the test as to which viewpoint, ‘lower for longer’ or ‘reversion to mean’ will win out. If bond yields fall again as they did last January and the U.S. dollar falls and future Fed rate hike projections fall, and commodities and gold rally, and yield oriented stocks fly higher, the ‘reversion to mean’ folks will have no leg to stand on and will have to admit that we are in a new world. They will have to start listening to James Bullard at the St. Louis Fed.
If the same things happen in January 2017 as happened last January, the new bull market that started then will have a big leg higher based on the huge attractiveness of stock yields versus bond yields. The focus on valuation will shift from earnings and PE multiples to the rising dividends that yield hungry investors will covet.
Right now the Select Dividend ETF total return, a perfect lower for longer investment has outperformed the S&P 500 ETF total return by 4% since the January 20th turning point. It had been outperforming by 8% in the summer. So as we approach the December 2016 Fed rate hike, this indicates the lower for longer folks are losing a bit of confidence. They could be even more fearful as we get closer to the big day. It’s after the December hike that will tell the tale. Will it outperform or not?
I am a momentum investor. I will go whichever route the market dictates. I believe in today’s world it’s impossible to predict outcomes. I used to be a predictor. I loved using my experience to guess where things were going. But to my dismay, I discovered that experience, no matter how successful in the past, is useless in the strange new world of bizarre monetary policies and the digital revolution. So I watch markets for trends and simply CONFIRM why they are happening with my experience and then jump on the trend or not if I think it’s rational. The lower for longer theme has outperformed since January 20. It makes sense so I’m sticking with it until proven otherwise.
I suggest to my colleagues and that it’s better to confirm rather than predict.
Thanks for letting me organize my thoughts.
All the best! We are in this together!
I agree with Ken that they are important turning points in the markets. However, I would urge him to focus on 07/08/2016 which is more recent then the one he is referring to in January 2016. Libor rates and other world interest rates began to rise for inexplicable reasons. It is possible that the markets sensed that quantitative easing had reached its limits and fiscal policy had to be used to kick the start the economies of the world. Lower for longer even if it is correct does not gurantee sustained growth. You can have a low interest rate environment when corporate earnings are non-existent. The market by any measure is fully valued. I personally feel that we have a high risk of stagflation.
Since 7/08/2016 the US stock market was going into a sideways consolidation. It has now broken to the downside. The first support is around 2100 on the S&P 500. The market is oversold but does not act well. An oversold market that does not rally means something has changed. It might have to drop further to 2050 to find a bottom. We will no the answer in the fullness of time.
I hear you Rajiv. This could be a turning point for Central Bank policy. Maybe negative rates are out. The question then becomes, do Central Bankers control long term rates? Maybe – maybe not. We’ll have to see how the trends go.
The stated reason that LIBOR has risen is that money market funds no longer are market to the buck and can decline in price. This has large buyers switching to government T-Bills.
Lower for longer, for me is not a Central Bank policy, it is an investment theme that says our viewpoint is changing to bond yields staying lower than we used to think and therefore dividend stocks are more attractive.
I will take a guess here, after the 2nd Dec hike this year, the fed’s interest rate policy vs public expectation will be quite inline after such a bumpy year. and 2017 might be in the hards European political fights and China RMB rate volatility.