Preface: Explaining our market timing models
We maintain several market timing models, each with differing time horizons. The “Ultimate Market Timing Model” is a long-term market timing model based on the research outlined in our post, Building the ultimate market timing model. This model tends to generate only a handful of signals each decade.
The Trend Model is an asset allocation model which applies trend following principles based on the inputs of global stock and commodity price. This model has a shorter time horizon and tends to turn over about 4-6 times a year. In essence, it seeks to answer the question, “Is the trend in the global economy expansion (bullish) or contraction (bearish)?”
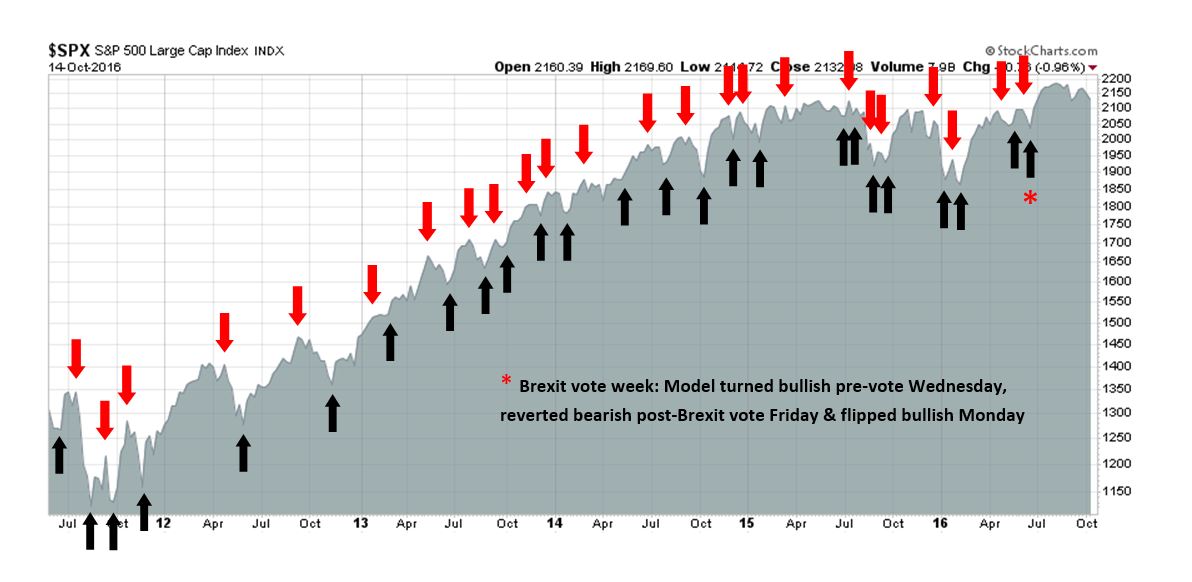
My inner trader uses the trading component of the Trend Model to look for changes in direction of the main Trend Model signal. A bullish Trend Model signal that gets less bullish is a trading “sell” signal. Conversely, a bearish Trend Model signal that gets less bearish is a trading “buy” signal. The history of actual out-of-sample (not backtested) signals of the trading model are shown by the arrows in the chart below. Past trading of the trading model has shown turnover rates of about 200% per month.
The latest signals of each model are as follows:
- Ultimate market timing model: Buy equities
- Trend Model signal: Risk-on
- Trading model: Bullish
Update schedule: I generally update model readings on my site on weekends and tweet any changes during the week at @humblestudent. Subscribers will also receive email notices of any changes in my trading portfolio.
Is the earnings recession over?
Regular readers will know that I have been bullish on stocks for the last few months. My forecast has called for an equity rally into year-end and beyond. Last week, a couple of Street strategists have turned cautious on the stock market. I would therefore like to examine the bear cases that they present.
Bloomberg reported that Goldman Sachs strategist David Kostin set an SPX year-end target of 2100. The main reason for the bearish call is earnings disappointment.
“Variables that determine earnings surprises – changes in U.S. economic growth, interest rates, oil price, the dollar, and EPS [earnings per share] revisions – suggest a below-average share of firms will report positive earnings per share surprises (43 percent vs. 46 percent),” he writes in a note to clients. ” We see a weak third-quarter reporting season coupled with negative fourth-quarter EPS revisions pushing stocks 2 percent lower to our year-end target of 2,100.”

Bloomberg also reported that HSBC strategist Ben Laidler also sounded a cautious note, based on valuation and likely earnings disappointment:
“We think markets are pretty vulnerable. You have earnings expectations which are pretty high, you have valuations which are pretty high,” he said. “You look around the world, the level of economic-policy uncertainty is very, very high — I think that is a dangerous combination right now.”
As I will show, at the core is the bull vs. bear debate is whether the earnings recession ended in Q3 2016.
How expensive are stocks?
First, I would like to address the issue of market valuation, which HSBC analyst Ben Laidler raised. How cheap or expensive is the stock market?
The indirect evidence does not suggest that the market is expensive. The latest update of insider activity from Barron’s shows that this group of “smart investors” have been steadily buying in the last few weeks. While insider trading data is noisy and readings can be volatile from week to week, it’s difficult to reconcile the idea of smart money buying an expensive market.
John Butters at Factset reported this week that the SPX trailing P/E ratio is 19.4. At first glance, that appears to be well above the historical average and that P/E ratio has only been exceeded by the market P/E during the Tech Bubble of the late 1990s. However, inverting the P/E ratio to an earnings yield of 5.2%. With the 10-year Treasury yield at 1.8%, there is a certain element of TINA (There Is No Alternative to stocks) that is supportive of the equity bull case.

What if interest rates were to rise? Wouldn’t that make stocks less attractive? Analysis from JPM Asset Management shows that when 10-year rates are below 5%, stock price movements are positively correlated with changes in interest rates.
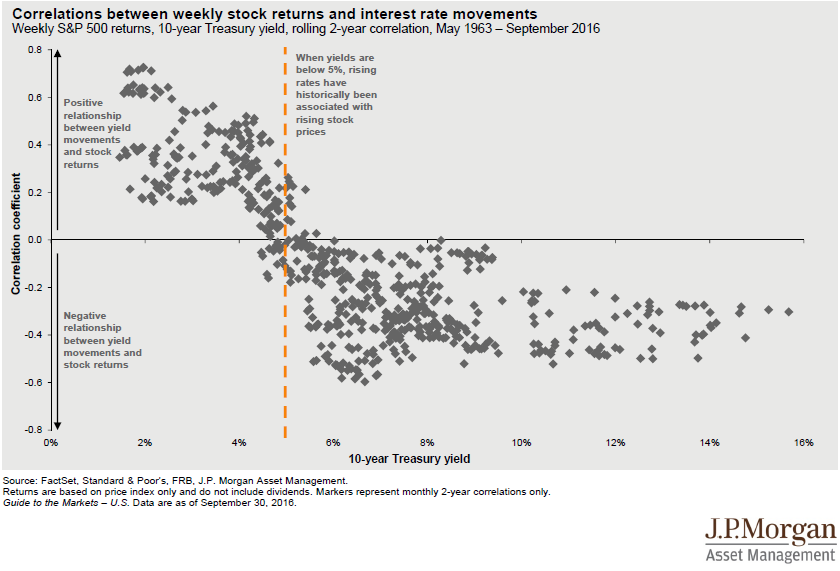
Other historical studies have shown that stock prices tend to rise even when the Fed first starts a rate hike cycle. That’s because the Fed raises interest rates to cool down an economy that’s growing to quickly. The market initially focuses on the positive effects of better growth, rather than the negative effects of higher interest rates.
In the current environment where the Fed is about to raise rates, the equity valuation vulnerability issue becomes a question of whether better earnings growth can overcome the negative effects of a likely December rate hike. Is the earnings recession over? Can stocks continue to rise in anticipation of better earnings?
The earnings recession in context
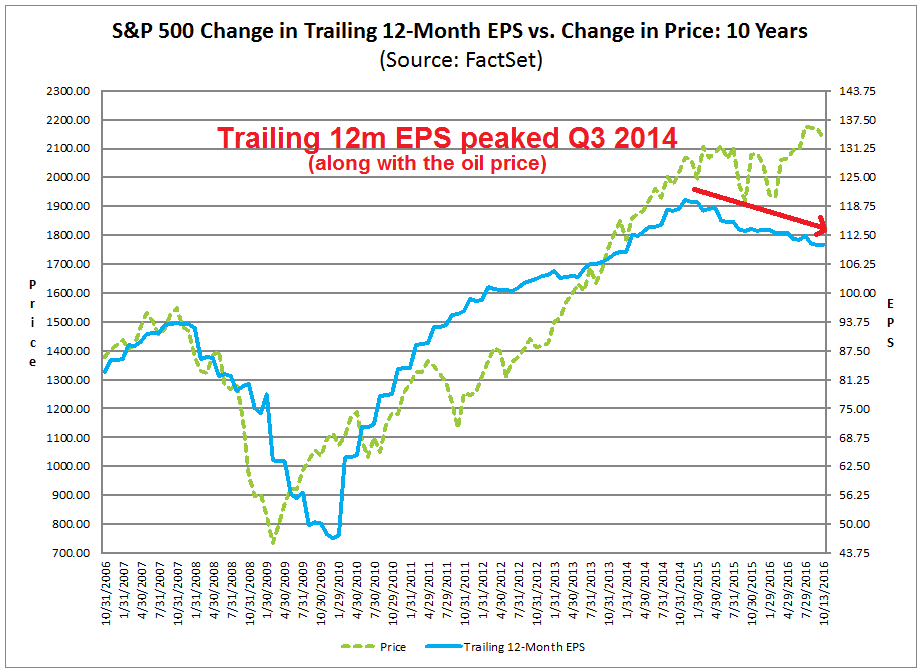
To put the recent earnings recession into context, the latest Factset report shows that trailing 12-month EPS peaked in late 2014, along with the oil price, and they have been falling ever since (annotations in red are mine).
The bear case
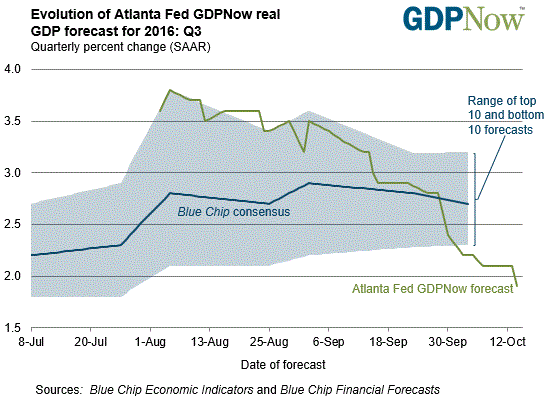
The bear case rests mainly on deceleration macro data. The Atlanta Fed’s nowcast of Q3 GDP growth has fallen to 1.9%. The NY Fed`s nowcast stands at 2.3%. Both figures are considerably lower than the levels seen in late August when the nowcasts were in the 3.0-3.5% range.
At the same time, New Deal democrat`s monitor of high frequency economic data shows that the economy is starting to wobble. While long leading indicator remain strong, short leading indicators are starting to weaken, and coincident indicators are mixed. While the persistent mixed readings in the coincident indicators are reflective of the mild industrial recession, the deterioration in short leading indicators is more disturbing. NDD concluded:
A great deal depends on whether the recent lows in interest rates translate into an increase in the new housing market. This coming week we will get housing permits and starts, which assume even more importance that usual, especially as mortgage applications – positive for now – nevertheless look like they are getting ready to roll over.
In other words, don’t panic, but watch for more developments.
The bull case
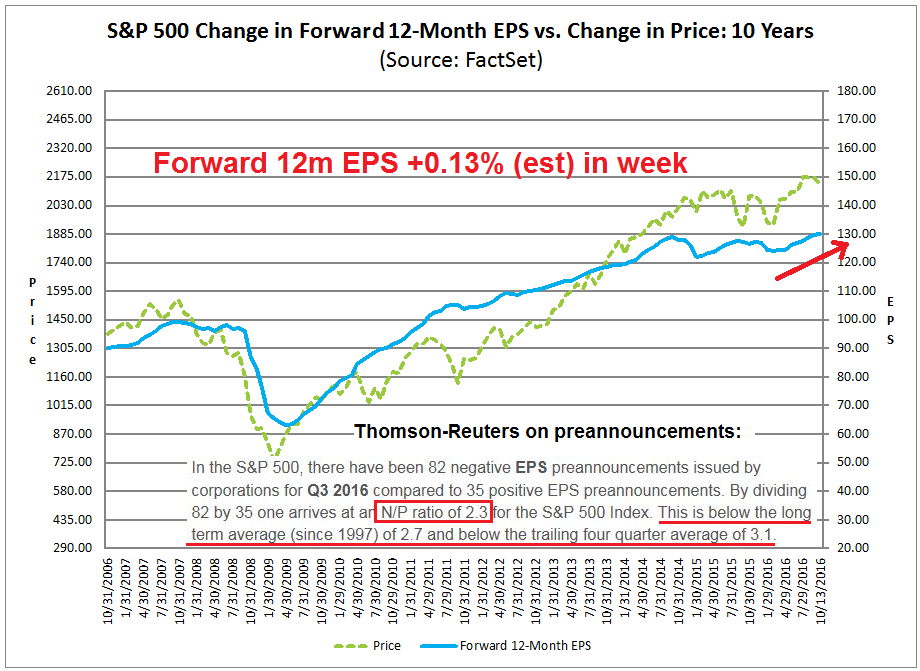
While the bear case for equities stems from top-down macro analysis, much of the bull case can be attributable to bottom-up derived fundamentals. The latest Q3 estimate of YoY EPS growth is -1.8%, but Q3 may be the bottom for earnings growth (annotations in red are mine).

John Butters pointed out that a meagre -1.8% YoY growth estimate is not such a big hurdle. If results came in line with the beat rate results seen in a typical earnings season, it would be enough for EPS to return to positive YoY growth:
Over the past four years on average, actual earnings reported by S+P 500 companies have exceeded estimated earnings by 4.3%. During this same time frame, 68% of companies in the S+P 500 have reported actual EPS above the mean EPS estimates on average. As a result, from the end of the quarter through the end of the earnings season, the earnings growth rate has typically increased by 2.9 percentage points on average (over the past four years) due to the number and magnitude of upside earnings surprises.
If this average increase is applied to the estimated earnings decline at the end of Q3 (September 30) of -2.0%, the actual earnings growth rate for the quarter would be 0.9% (-2.0% + 2.9% = 0.9%). If the index does report growth in earnings for Q3 2016, it will mark the first time the index has recorded year-over-year growth in earnings since Q1 2015 (0.5%).
Much of the earnings recession can be attributed to a higher USD and lower oil prices. The chart below shows the JPM Asset Management estimate of the effects of USD strength on SPX revenues over the last few years.

The USD has been roughly neutral on a YoY basis in Q3, so the negative effects of USD strength are gone.

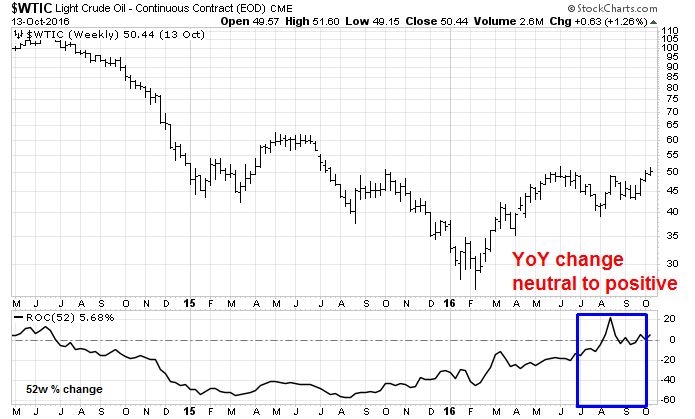
Here is the JPM Asset Management’s estimates of the effects of lower energy prices on SPX earnings.

On a YoY basis, oil prices are flat to slightly positive (see bottom panel).
Here is a chart of natural gas prices. The YoY effect is even more positive than crude oil.

As those macro headwind abate, is it any surprise that forward 12-month EPS are being revised upwards? In addition, Thomson-Reuters reported that Q3 earnings guidance, or preannouncements, has come in more positively than the historical experience.
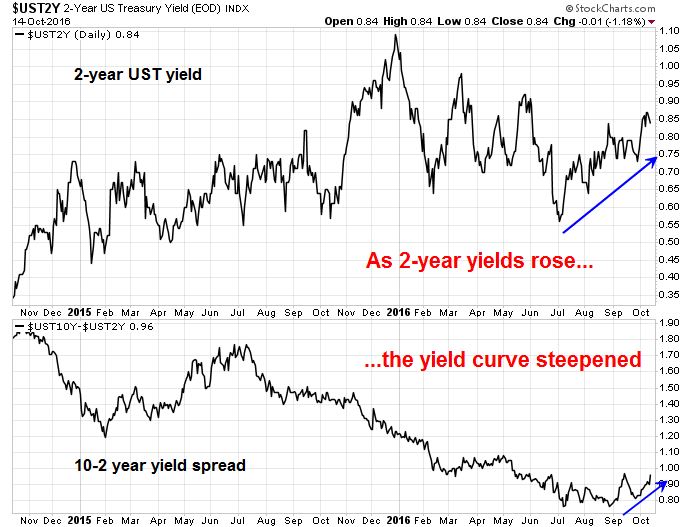
The bond market seems to agree with the assessment of higher growth. Despite the rise in 2-year yields in anticipation of a December rate hike, the 2/10 yield curve steepened, which is an indication that the bond market expects rising growth.
At the end of the day, the key to stock prices will be the report card from Q3 earnings season. Will it surprise us on the upside or downside? While the signs of macro weakness are worrisome, I find it difficult to believe that Q3 earnings season will disappoint without any indications from the troops on the ground. Company guidance has been more upbeat than usual, and Street analysts have not found signs of aggregate deterioration.
The early results from earnings season is encouraging for the bulls. Factset reports that with 7% of index components having reported, the earnings beat rate is 76% (vs. 5-year average of 67%). The sales beat rate came in at 62% (vs. 5-year average of 54%). Moreover, the Q4 negative guidance rate is only 67% (vs. 5-year average of 74%). However, these results are highly preliminary and we should get a better idea of how earnings season is progressing next Friday.
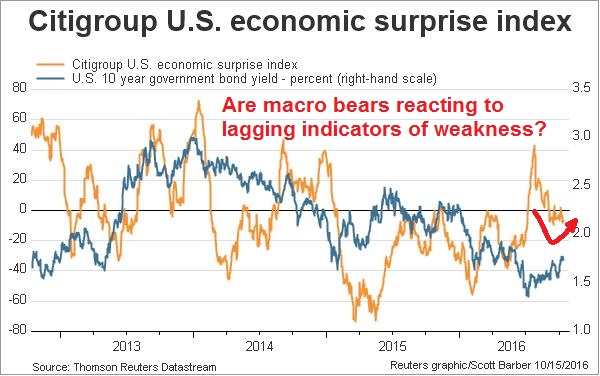
One possible explanation for the divergence between top-down and bottom-up data analysis is the macro bears are reacting to lagging signals of economic weakness. The Citigroup US Economic Surprise Index (ESI) measures whether high frequency economic releases are beating or missing expectations. As the ESI chart below shows (gold line), the index had been falling but it has recently stabilized, indicating the start of a possible turnaround.
What could go right
There is a possibility that the bears have become overly negative. They have focused too much on the downside risks to the economy. Jim Paulsen at Wells Fargo Asset Management recently asked the question, “What could go right?”
Here are the upside risks that he named (shown in bold, with my comments after each bolded point):
- What if the global economy experiences a global bounce?
- What if the US finally adds a little leverage? These charts of the household finances (via JPM Asset Management) shows that the consumer has repaired her balance sheet and could be ready to spend again.

- What if US productivity bounces?
- What if the US gets a capital spending cycle?
- What if monetary velocity bounces?
- What if US housing has a surprising second half run? Bill McBride at Calculated Risk, who closely monitors the housing industry, sees no recession on the horizon in 2017 or 2018. Data from JPM Asset Management shows that housing is extremely affordable right now. With consumer finances in good shape, the potential for continued growth from the housing sector is high.

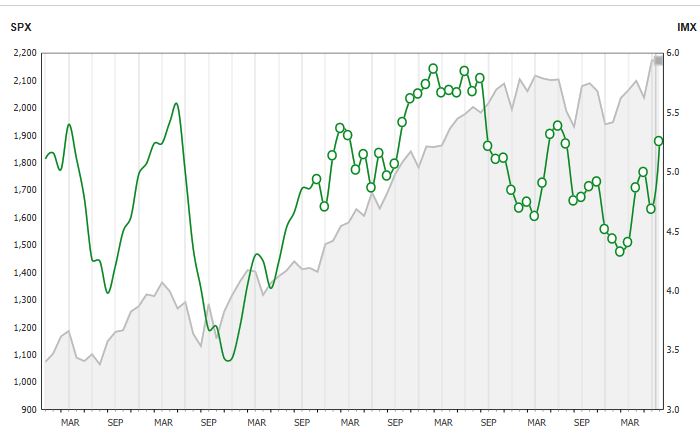
- What is there’s a retail rush to stocks? The latest TD-Ameritrade Investor Movement Index indicates that retail investors are warming up to equities again, though readings are nowhere near extreme levels.
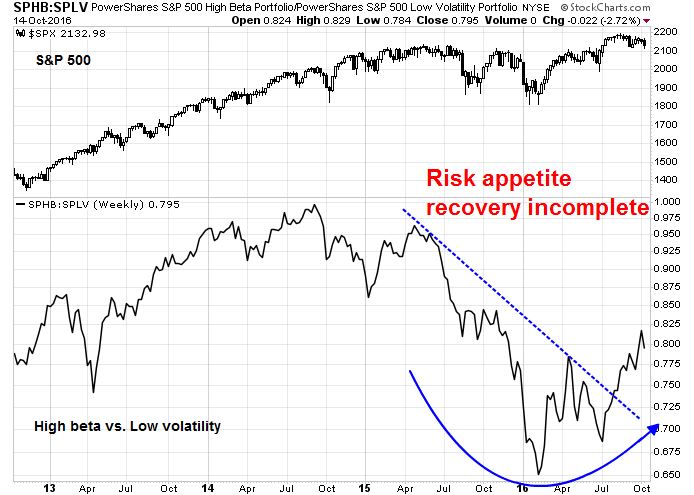
- What if animal spirits finally show up? The chart below shows the relative performance of high beta stocks relative to low volatility stocks as a measure of risk appetite. While risk appetite has only begun to recover, the recovery is incomplete and we are nowhere near levels that signal investor euphoria.
Paulsen cautioned that it may be too early to get
We are impressed by how much potential still exist relative to how little most expect from the balance of this recovery. Since the recovery has proved disappointing for so many years, the expectations bar is extraordinarily low. The disconnect between recovery potential and expectations could be powerfully profitable. Earnings growth has been negative for two years and even a modest improvement in earnings may be perceived as a great relief. Global economic growth has been so bad for so long it really doesn’t need to quicken to impress. If it simply synchronized, it would feel different and much improved relative to any other time in this recovery. A bounce in productivity, an upturn in capital spending or improved housing activity would definitely surprise and inspire.
Then there are the real shockers. What if money velocity started rising and boosted business sales like never before in this recovery? What if the household and/or the business sector decided to take their recently retrofitted and markedly improved balance sheets out for a leveraged test drive? How about if the public finally tires of the bond market and allocates some funds back toward the stock market? Finally, what if confidence ultimately goes beyond just calming after the 2008 crisis and actually jumps to levels that embolden some true animal spirit behaviors?
To be clear, the best of this bull market is already behind us. Total returns during the balance of this recovery are not likely to be as good as we have already enjoyed. However, it is looking more and more like the current recovery will prove to be the longest ever in U.S. history and experiencing some perfect days along the way seems probable.
Don’t get bearish too soon. While the probability of any single bullish factor occurring is small, there are lots of lurking positive surprises out that that could rip your face off if you are short the market.
The week ahead: OpEx week
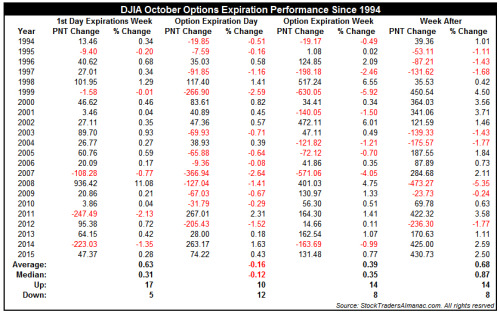
Looking to the week ahead, we are approaching a seasonally positive option expiry week in October. I wrote about Rob Hanna’s historical analysis of OpEx by month (see Six reasons why I am still bullish). Jeff Hirsch at Trader’s Almanac also studied October OpEx and found the first day has a bullish bias, and so does OpEx week and the week after OpEx.
Callum Thomas pointed out that the market is starting its seasonally strong period of the year.

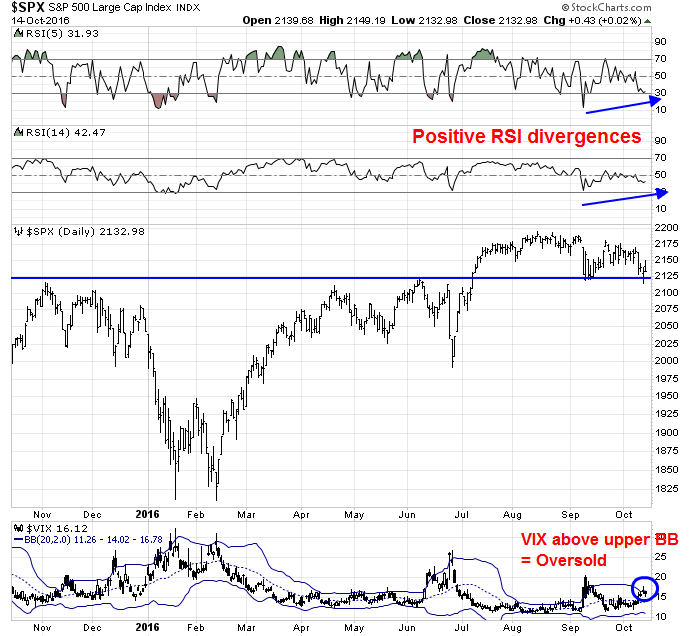
The market successfully tested support at 2120 last week. It ended Friday oversold and exhibiting bullish divergences on RSI-5 and RSI-14.
Breadth readings from IndexIndicators show that the market is oversold on a short-term (1-2 day) basis:

…and on a longer term (1-2 weeks) time frame:

While oversold markets can get more oversold, the balance of probabilities favor a rally from current levels. Downside risk is likely to be limited from here. My inner investor is still positioned bullishly. My inner trader has been gradually adding to his long positions in anticipation of equity strength into year-end.
Disclosure: Long SPXL, TNA
What do you think about the Ray Dalio statement that a mere 100 bp interest rate increase would cause the biggest crash in bonds since 1981, and that all assets have been stretched in duration by artificially and historically low interest rates such that even a small rate rise will wreak havoc on current price levels?
I wouldn’t be surprised to see considerable market stress if we got 100bp in rate hikes, but we are far away from that outcome.
Assuming that the Fed raises 25bp this December, and they raise 2, maybe 3 times next year in 25bp increments, you might get to 100bp in late 2017 or early 2018.
Much of this depends on a combination of the growth outlook and the Fed’s reaction function. For now, enjoy the party.
RMB and the plunge of the China B share index today are worrisome. im waiting for a wash of spx.
Market strategist and most of us focus on earnings but retiring Boomers and institutions are looking for yield.
Here are some stats that make the current valuation of the U.S. market look cheap from a dividend point of view.
From end of 2014 to now S&P 500 ETF (SPY) same price at $205.
Cash SPY Dividends 2014 – $4.04 (SPY yield 1.97%), 2015 – $4.46 (up 10.4%) 2016 – $4.66 (up 4.5%) (current SPY yield 2.28%) estimate for 2017 – $4.90 (up 5.1%) (projected SPY yield 2.4%)
U.S. Fed Governors’ interest rate projections for end of 2017 December 2014 – 3.6% September 2016 – 1.1%
Since the end of 2014 cash dividends have grown 15% and the yield has gone from 1.97% to 2.28% while the FED projection for rates at the end of 2017 has gone from 3.6% to 1.1%.
Rising company cash dividends indicates a healthy general business climate.
Looking at the market from an income viewpoint, there is no reason to expect a nasty bear market and every reason to expect a nice price gain in 2017.