I have been seeing analysis from various quarters raising concerns about the sustainability of the post-election stock market advance because of the poor breadth of the market. The chart below shows the NYSE A-D Line overlaid on top of the SP 500. As you can see from the chart, the NYSE A-D Line has been lagging even as the market advanced. If the generals (large caps) are leading the charge, but the troops (breadth) are not following, then such divergences are thought to be warning signs that the move may not be sustainable.
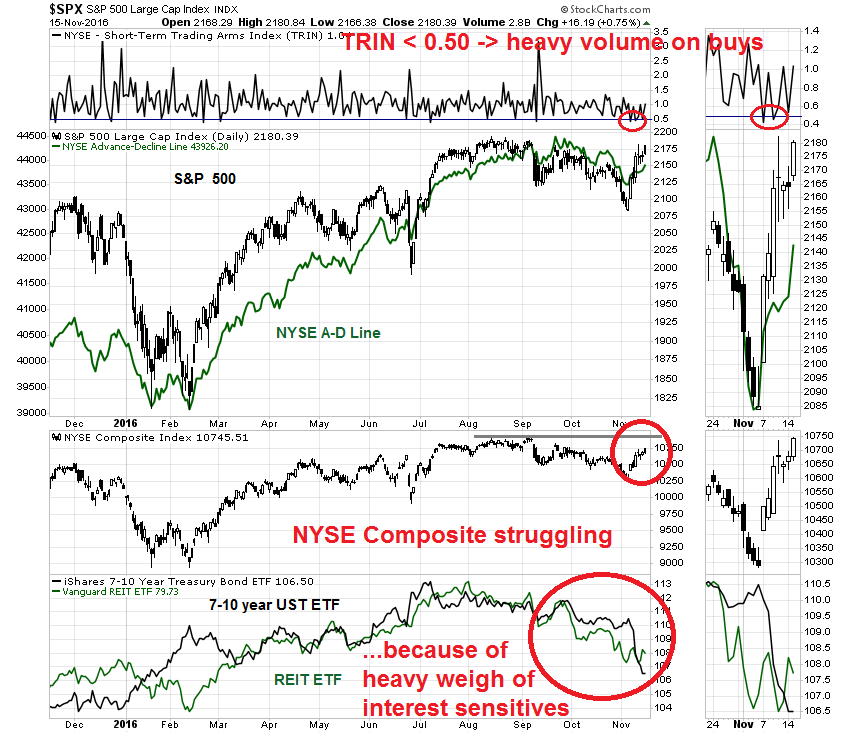
I would not be so worried about that. The NYSE Composite is made up of many closed-end bond funds and REITs which have dragged down the performance of that index. We can see a hint of that effect in TRIN (top panel). There were two days in the post-election rally when TRIN fell below 0.50, which is an indication that advancing volume was running well ahead of advancing issues. That`s because many of the declining issues were relatively thinly traded interest sensitive bond funds and REITs.
While I am not worried about a negative breadth divergence, the sudden turnaround in bullish sentiment is a concern to me.
A deeper dive into breadth
First, let me explain why breadth is not holding back the current market advance. The chart below shows several different ways of measuring breadth. The top panel shows the SP 500, along with the NYSE A-D Line (green), and the SP 500 A-D Line (red). The latter is an apples-to-apples measure of breadth as it uses the same components as the index, rather than the differing weights and components of the NYSE Composite. While the NYSE A-D Line does indicate a minor negative divergence, there is no negative divergence from the SP 500 A-D Line.
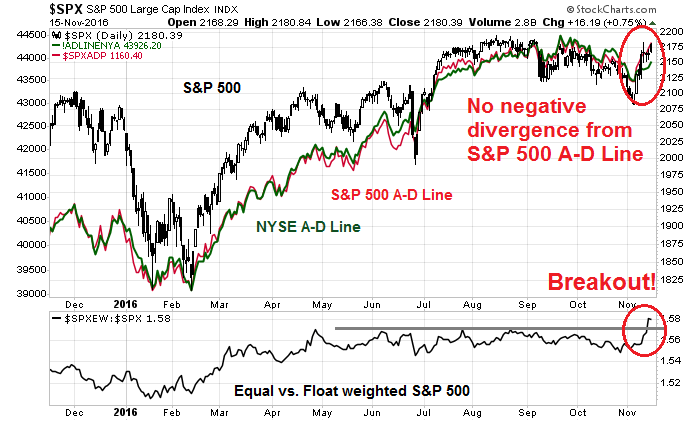
In addition, the bottom panel shows the ratio of the equal to float weight ratio of the SP 500, which is another way of measuring the market action of the “troops” and the “generals”. As the bottom panel shows, the equal vs. float weight ratio staged an upside breakout, which indicates positive breadth participation from index components.
Still not convinced? The chart below shows the various flavors of large cap, mid cap and small cap indices. With the exception of the NYSE Composite, all of the other indices are either close to a new all-time high or have broken out to ATHs.

Does this look like a picture of poor breadth to you?
What about the Zweig Breadth Thrust?
I have written about a possible Zweig Breadth Thrust momentum buy signal (see The market has spoken!). To recap, the ZBT buy signal is an (almost) sure fire buy signal which occurs when the ZBT Indicator moves off an oversold reading (which it did on November 4, 2016) and it has 10 trading days to achieve a momentum buy signal (deadline is this Friday). The problem the market faces today is that the ZBT Indicator is based on NYSE breadth, which has been weak during this advance because of the weakness of bond funds and REITs.
The chart below shows the ZBT signal (top panel), the SP 500 (second panel), the ZBT Indicator (third panel but data delayed), my estimate of the ZBT Indicator (fourth panel), and my alternative ZBT Indicator based on SP 500 breadth instead of the NYSE breadth (bottom panel). Past ZBT setups are shown with blue vertical lines and the buy signal are shown with red vertical lines.
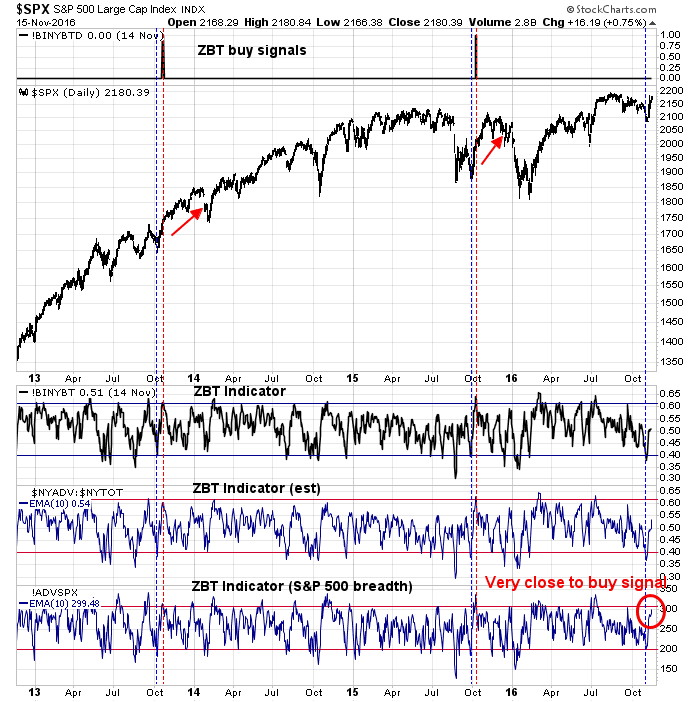
I can make two observations from the chart. First, the past setups and buy signals from the SPX ZBT Indicator does not differ from the standard ZBT Indicator based on NYSE breadth. In the current circumstances, the better breadth internals of the non-NYSE market shows that the SPX ZBT Indicator is very close to flashing a buy signal compared to the more standard ZBT Indicator.
In fact, should the market achieve on Wednesday an advance similar to what it did today (Tuesday), we should get a SPX ZBT buy signal. But does that make it a legitimate ZBT buy signal? I don’t know, because bullish sentiment is getting a little over-stretched.
Too far too fast?
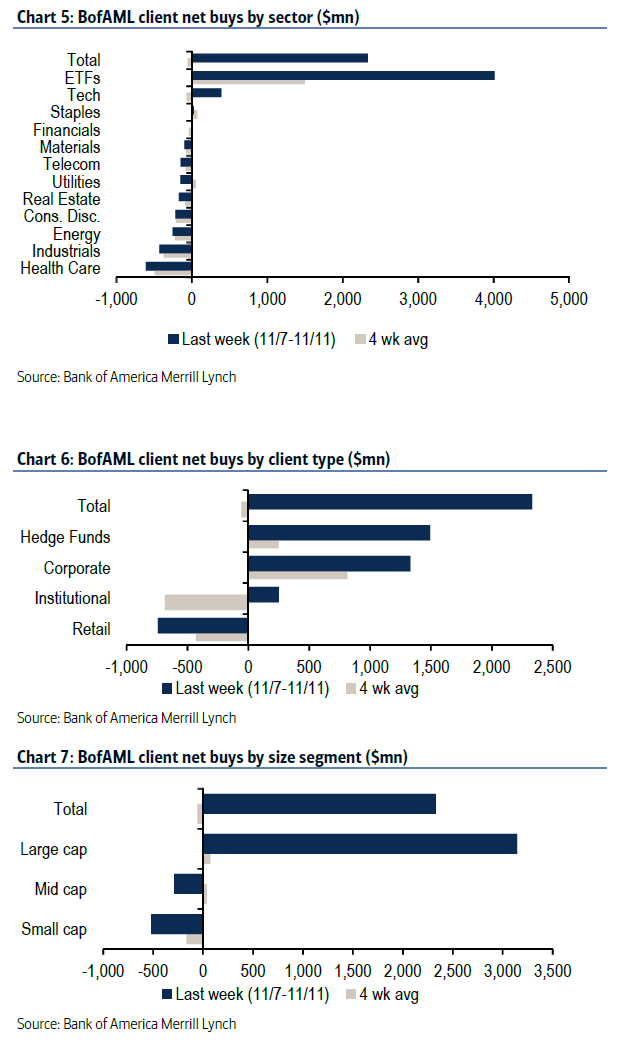
A Bloomberg report indicated that the weekly BAML funds flow report showed that clients were piling into equities at a frenetic pace. Except for private clients, all other clients were pouting money into equities, and the buying was concentrated in highly liquid large cap stocks.
Is this too much too fast? I am not sure, but here is how I would be inclined to trade the current episode. There are two scenarios to consider.
If momentum stalls and the market does not flash a ZBT signal of any form by Friday, the bull vs. bear discussion is moot. The market is probably due for a pullback.
On the other hand, should we see a SPX or regular ZBT buy signal between now and Friday, then I would interpret the funds flow report as the fast money trying to front run the slower institutional and private client flows. The market would likely pause or weaken slightly for a 2-3 days as the slower money buy into stocks while the fast money exits. Upward momentum would then likely resume as the slower but big funds flows buoy equity prices.
My inner investor is bullish and overweight equities. My inner trader is long stocks, but watching the market action closely and tightening his trailing stops.
Disclosure: Long SPXL, TNA
Great write up as always. The breadth thing was on my mind and you answered the doubt.
Good points, and I think you are right that, even if we are due for a severe bear market at some point in the next year, it probably won’t start in the short term.
However I am not totally convinced. Weak NYSE breadth has always been characteristic of major tops, going back to the top in the summer of 1929, and the divergence between breadth and the S&P in the 1972-73 period, to name just two when it was a good idea to be getting out. Back then (I’m counting both ’29 and ’73 as “then”) they didn’t have bond ETFs to cloud the picture, but many corporations did have preferred shares on the market, which were also pure income vehicles. They helped drag down the A/D line at the tops then the way ETFs do now; explaining the divergence away then by saying it was only the preferreds that were messing up the breadth figures would have been logical, but costly.
Also, please refresh my memory, but during recent years when the public was pouring into bond ETFs, did you ever say to ignore the strong breadth because it had an upward bias from the ETFs rather than from operating company shares? Not saying you should have, you would have lost some upside had you done so, which I don’t think was the case. I guess I’m bothered by arguments (companies do this all the time when they have crummy earnings reports) that when there is a mix of good and bad, if you don’t count the bad, it is all good.
I have the same kinds of doubts you have about S&P 500 breadth vs. NYSE breadth. NYSE A-D Line has been the “gold standard” in technical analysis.
On the other hand, small caps severely underperformed large caps during the Tech Bubble. If you had followed NYSE Composite, or NYSE A-D Line during that period you would likely have been in cash or, worse, short the market somewhere between 1996 and 1998 – it was much too early.
That’s a key lesson about breadth. The signals can be very early and the indicator doesn’t always work.
Before we get carried away with the idea that there is a “melt up” in stocks let us step back and see the investment terrain. First of all the market has sharply rejected two central themes which were the core of the investment thesis: lower for longer in interest rates and that dividend stocks were the place to be. What we have seen is what I was worried about – the Central Banks had no control on the long end of the interest market and rates have risen sharply. Why is that important? Because now the stock market has to compete in a rising interest rate environment in an economy that is sluggish at best. I rate the probability of a recession in early 2017 extremely high-over 70%. The stock market is not cheap.
Add the above with a political candidate whose economic policies are vague at best, a Republican party that is not in lock step with the President and you have a recipe for a lot of missteps.
We are now in a broad trading range in the S&P 500 with 2190 and 2080 (+,-) a few points. There have been many times in the stock market where you have had false breakouts. I would wait and see if the S&P 500 can close above the previous high and stay above before being convinced we are starting a new leg in this old bull market.
I beg to disagree. My proprietary breadth indicator (based on price breadth on Full SP500 components) is showing a huge divergences. Check when we last had the same type of divergences (hint Aug 2015, Dec 2015, May 2016 and now). Can the divergences be resolved positively? Absolutely possible. Is it likely? Very unlikely
https://s15.postimg.org/6xseh218b/spxclv50.png
Thanks for the analysis, Cam. I thought you sold your long positions ( ? SPXL, ?TNA) on Friday, Nov 18. Is this correct?
I ask because your disclosure states you are long SPXL and TNA.
Thank you!