Preface: Explaining our market timing models
We maintain several market timing models, each with differing time horizons. The “Ultimate Market Timing Model” is a long-term market timing model based on the research outlined in our post, Building the ultimate market timing model. This model tends to generate only a handful of signals each decade.
The Trend Model is an asset allocation model which applies trend following principles based on the inputs of global stock and commodity price. This model has a shorter time horizon and tends to turn over about 4-6 times a year. In essence, it seeks to answer the question, “Is the trend in the global economy expansion (bullish) or contraction (bearish)?”
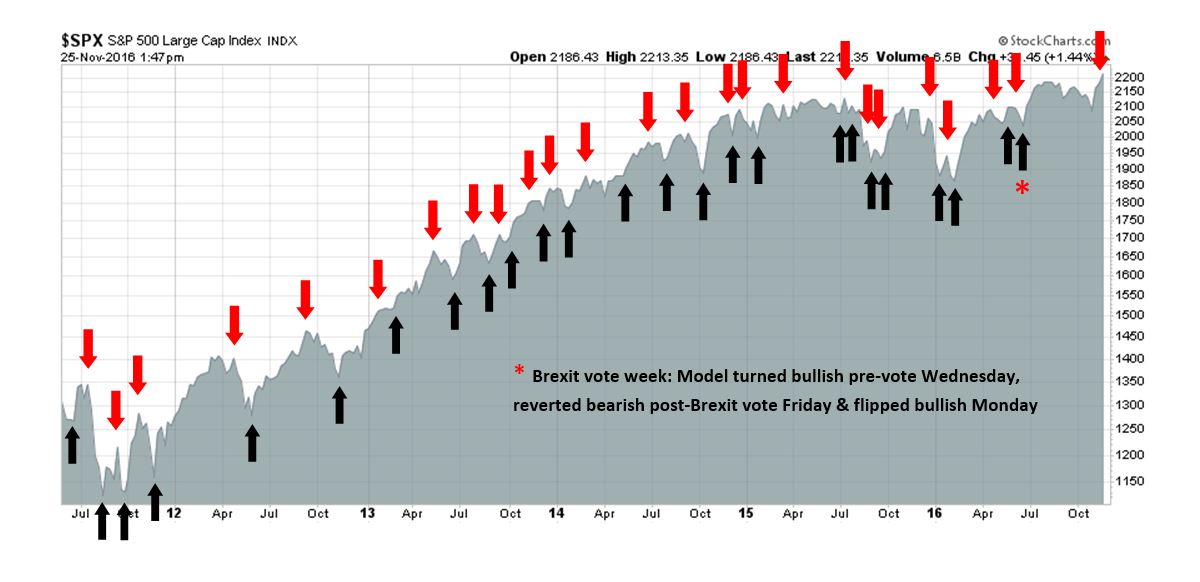
My inner trader uses the trading component of the Trend Model to look for changes in direction of the main Trend Model signal. A bullish Trend Model signal that gets less bullish is a trading “sell” signal. Conversely, a bearish Trend Model signal that gets less bearish is a trading “buy” signal. The history of actual out-of-sample (not backtested) signals of the trading model are shown by the arrows in the chart below. Past trading of the trading model has shown turnover rates of about 200% per month.
The latest signals of each model are as follows:
- Ultimate market timing model: Buy equities
- Trend Model signal: Risk-on
- Trading model: Bearish
Update schedule: I generally update model readings on my site on weekends and tweet mid-week observations at @humblestudent. Subscribers will also receive email notices of any changes in my trading portfolio.
Market is following my road map
Last week, perennially bullish strategist Tom Lee appeared on CNBC and stated that the Trump win could produce a major bull market. While it is true that stock prices have rallied significantly since the election, the fundamental underpinnings of the advance were not mainly attributable to Trump’s win, notwithstanding the change in psychology.
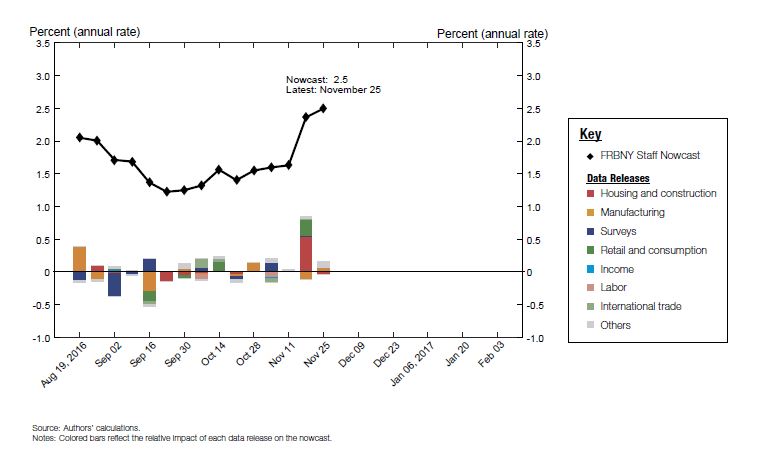
Many of the reasons for the stock market gains were already baked in before the election. Consider, for example, the better growth outlook. The chart below shows the evolution of the NY Fed’s nowcast of Q4 GDP growth, which shows an upward acceleration in Q4 growth. Those factors were already in place well before the election, regardless of who won the White House.
In fact, the bull market seems to be following the script that I set out for it (see The roadmap to a 2017 market top):
- Rising growth expectations, which leads to…
- Higher inflation expectations, which leads to.
- Tighter monetary policy, which leads to…
- Three steps and a stumble.
We are somewhere between Act 2 and Act 3 of that script.
Ingredients for a bull run
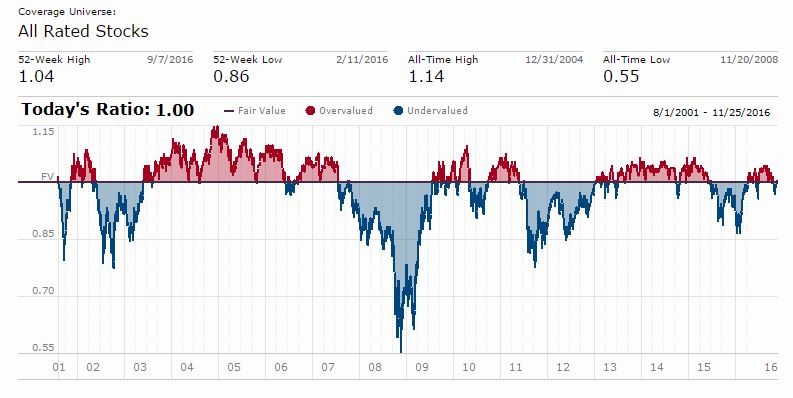
We have in place the ingredients for an intermediate term bull run. Equity valuation is still reasonable when compared to other alternatives. The Morningstar’s median fair value estimate shows that stocks are still fairly valued and nowhere near the levels seen at the last market top.
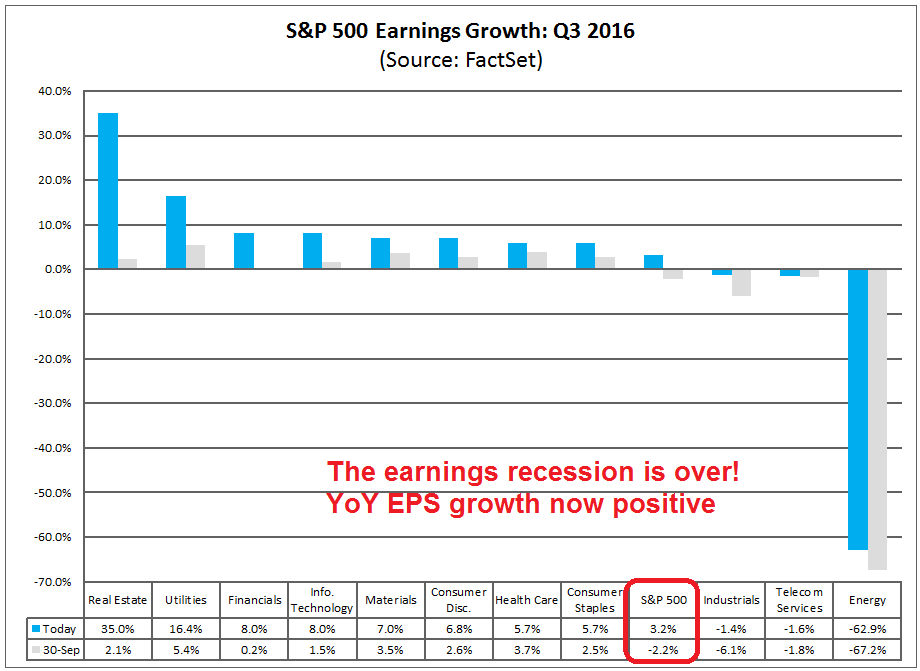
Growth is reviving. Factset reports that YoY Q3 EPS growth is positive. The stock market rally is in part a response to the end of the earnings recession.
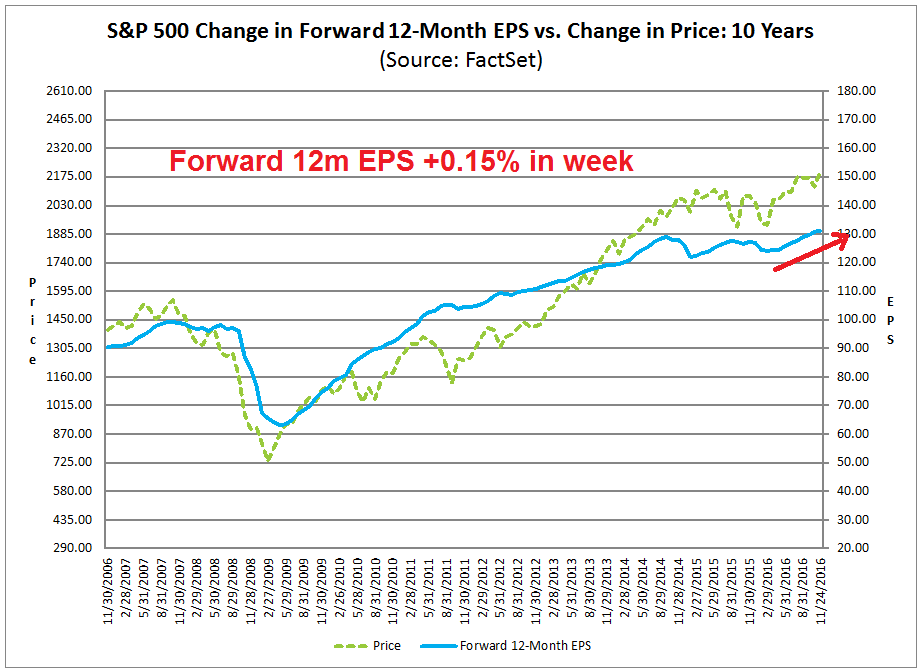
On a forward looking basis, the Street continues to revise its growth expectations upwards. The latest update from John Butters of Factset shows forward 12-month EPS grew at 0.15% last week.
I agree with Brian Gilmartin, who has closely monitored the evolution of earnings expectations. He recently summarized the outlook well this way (the growth recovery is not just about Trump, but his fiscal proposals are the icing on the cake):
Thomson Reuters notes that “ex-Energy” the SP 500 grew earnings in Q3 ’16 +7.9%. Factset’s “Ex-Energy” growth is +6.5% for earnings and +4.5% for revenue.
The third and 4th quarters of 2016 look to be decent, healthy quarters of earnings growth, even before the President-elect Trump and the 2017 Congressional agenda is being considered.
The fact that the Street is finally taking up the “forward 4-quarter” EPS estimate for the SP 500 is likely anticipating what is to come in 2017, but even with today’s value of $128.56, it is still “light” considering the personal and corporate tax reform being discussed.
As well, the Citigroup US Economic Surprise Index, which measures whether macro-economic indicators are beating or missing expectations, is rising. That’s another sign of an upbeat outlook.

Other leading indicators of industrial activity, such as the Chemical Activity Barometer, continues to rise (via Calculated Risk).

From a top-down macro and bottom-up fundamental viewpoints, the growth outlooks are bright, even without Trump. Trump’s fiscal policies of tax cuts, profit repatriation incentives, and infrastructure spending are likely to provide even a bigger growth boost.
Here comes the Fed…
As a result of these developments, inflation expectations (blue line), and the 10-year Treasury yields (black line) are rising. As well, the yield curve (red line) is steepening, which reflects the bond market’s expectations of better growth ahead.
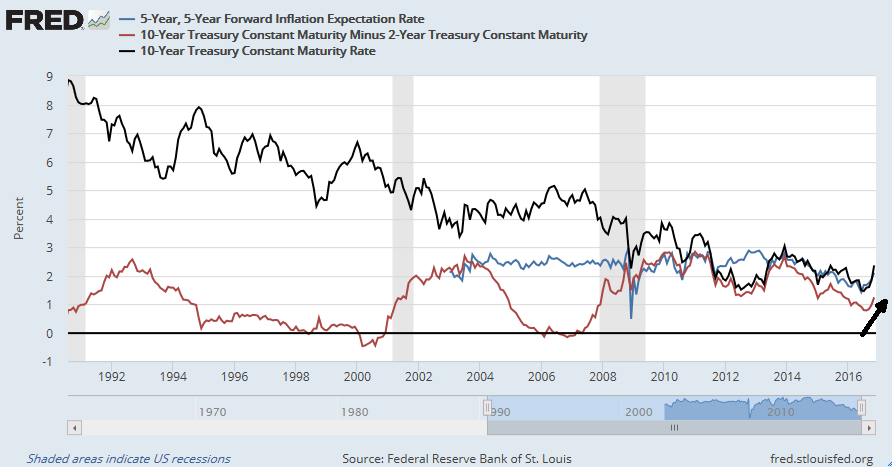
You can count on a quarter-point rate hike at the December FOMC meeting. Even super-dove Charlie Evans of the Chicago Fed (2017 FOMC voter) expects three rate hike by the end of 2017. At some point, the negative effects of rising rates will overwhelm the bullish effects of better growth expectations, but not right now.
I indicated last week that I had gone on recession watch (see Going on recession watch, but don’t panic!). Long leading indicators showed that the labor market is starting to look a little wobbly, and rising rates are likely to dampen the activity in the cyclically sensitive construction sector. While other long leading indicators are still positive, the deterioration in some of these indicators suggest that a the Fed runs the risk of over-reacting and tightening the economy into recession. That prospect, however, is not immediate. The earliest date for a recession would be Q4 2017 or Q1 2018.
This is one area where the Trump administration can dramatically affect the course of the economy and stock prices. Trump will be nominating two governors to fill current vacancies on the Federal Reserve board. In addition, the terms of the chair, Janet Yellen, and the vice-chair, Stanley Fischer, will end in February 2018. Donald Trump’s nominees to the Fed board will be an important signal of how he wants to steer monetary policy. If he fills the board with his supporters, who are mainly from the hard-money audit-the-Fed crowd, then expect tighter path for monetary policy and a relatively rapid end to the economic cycle. If, on the other hand, Trump reverts to his “I love debt and I love low rates” persona and nominates dovish governors, then expect the cycle to stretch out longer. In that case, the market will likely experience an inflationary blow-off where the Fed is forced to react in 2018-2019 with a series of Volcker like rate hikes that tank the economy.
Where are the bulls?
Even though I am postulating a market top in 2017, the one key missing ingredient to that scenario is excessively bullish sentiment. For much of 2016, the investment community has been overly cautious as institutions and individuals have been timid about taking equity risk.
A number of analysts got very excited last week when the AAII survey showed % bulls jumped to almost 50% (bottom panel of chart). However, a longer term perspective of AAII sentiment shows that the both bullish sentiment and the bull-bear spread to be elevated, but not at extreme levels. In addition, the 52-week moving average of these readings are still depressed. In order for a top to form, we need to see more sustainable bullish readings over a longer period.

Another sign of a cyclical top is persistent insider selling. The latest report of insider activity from Barron’s shows that this group of “smart investors” were buying enough that their trading is on the edge of a buy signal, though readings are quite noisy.

That’s how cyclical tops get formed. The public needs to be all-in, and the “smart money” insiders need to be selling. We are not there yet.
Near-term volatility ahead?
I wrote in my last post that the stock market appeared to be stretched and these short-term trends are due for a pause or pullback (see Trend vs. counter-trend: Who wins?). I stand by those remarks.
The chart below shows the relative performance of US equities vs. long Treasury bonds. This relative performance ratio is now testing a key relative resistance level and it is showing a record overbought reading, as measured by RSI-14.

In addition, Bloomberg pointed out that RSI-14 for Treasuries have fallen to unprecedented oversold levels. A reversal, even if it’s temporary, is likely close at hand.

Similarly, the USD rally is showing signs that it is also running out of steam. Here is Marc Chandler:
After a three-week rally, the dollar bulls finally showed signs of tiring ahead of the weekend. Technical indicators have begun rolling over from over-extended conditions. . Nevertheless, the dollar’s pullback is limited in time to the first of the week ahead and scope to modest retracement targets ahead of the US employment data the Italian referendum and Austrian presidential election on December 4.
We have suggested that the dollar’s advance was fueled by the divergence that had little to do with the US election. It is clear from Fed comments and the minutes from the November FOMC meeting that officials were prepared to hike rates regardless of the election outcome. Moreover, subsequent data has been mostly better than expected.
Should these trend in bond yields and the USD reverse, it would also likely be a signal of a stock market reversal from an inter-market analytical viewpoint.
Up or down?
Here is the dilemma. On one hand, the major stock indices all made post-Thanksgiving all-time highs on Friday, which is intermediate term bullish. There is a decent chance that the SPX should achieve its target of over 2500 next year.

On the other hand, these overbought readings makes me wary about being overly committed to the long side of the equity market on a short-term basis (see Trend vs. counter-trend: Who wins?). The market may get spooked next week as it starts to look ahead to the Italian referendum and Austrian presidential election, both on December 4. Polls have steadily shown that Italian PM Renzi is likely to lose the referendum and a “no” vote will prevail. Martin Sandbu, writing in the FT, thinks that even a “no” vote will not be a big deal. People need to calm down and stop fretting about the risks of political instability should Matteo Renzi resign in the wake of a “no” vote, and Target2 imbalances of the Italian banking system.
On the first point, as former Italian prime minister Mario Monti points out in an article for the FT, Renzi neither needs to resign if he loses the referendum, nor should he. Monti seems right: Renzi was wrong to personalise this referendum, and if he loses he should simply accept the political weakening this involves, but not make things worse by leaving office.
On the second point, Target2 is often misunderstood. Its main function is to facilitate movements of bank deposits without causing a balance of payments problem. A Target2 liability is something that arises automatically when a deposit is moved from an Italian bank to one in another eurozone country, allowing the Italian national banking system to keep its balance sheet unchanged rather than shed assets to fund the deposit outflow. It is like a gold-backed banking system with an infinite gold supply.
The proof that this is stabilising rather than destabilising is that even as Target2 outflows have taken place, deposits in Italian banks have continued to grow. So have loans to households (though not to businesses). Far from a harbinger of doom, Target2 has allowed the Italian banking system to continue to function.
Finally, Italy is not living beyond its means. The current account has been positive for the past four years — it hit almost 3 per cent of economic output in the second quarter. There is no reliance on fickle foreign capital to sustain domestic demand here — it is rather depressed Italian demand that funds consumption elsewhere.
Even a Renzi resignation is unlikely to be politically disastrous (see The Italian referendum = Next populist domino?). Bloomberg reported that in the event of a “no” vote, Finance Minister Pier Carlo Padoan is likely to succeed Renzi as the new prime minister, which would reassure the markets:
Padoan, 66, has the potential to reassure financial markets and European Union leaders, according to a senior state official not authorized to speak publicly about the issue. He, the person said, would lead an executive that would stay in power only until parliament approves a new administration, with early elections likely in the first of half of 2017. In the Italian constitution, it is the president who appoints the prime minister.
Investors are unsettled by the prospect of political and economic instability should Renzi’s Senate reform be defeated. The euro has slid and Italy’s 10-year bond yield has climbed ahead of the vote. Padoan himself has not ruled out staying on in his current role — or even taking a new position — under a different government.
“I have accepted the role that I have been asked to cover with a great sense of honor,” Padoan told Sky Tg24 television on Friday. “Of course, it will be up to the new government, if there will be a new one which I don’t think will be the case, to decide its composition.”
My inner investor is cautiously bullish on equities. The market is having a party, and he is enjoying the celebration. However, he is closely monitoring the long leading economic indicators for signs of deterioration. When they do, and if the party is still in full swing, then it’s a sign that the police are on the way to raid the place.
My inner trader moved to an all cash position a week ago. He views the risk-reward as being unfavorable despite the bullish intermediate-term trend, The market could pull back and correct up to 2% at any time.
The problem with waiting for a counter-trend movement after a significant new trend starts is that their are millions of investors waiting also. This changes the game at these important turning points.
Take bonds. The huge, unprecedented fast move up in rates likely signals that the 30 bond bull is over. Many well-known and trusted bond gurus have said this recently. The shock of the fast and large extent of the move has left bond holders flat-footed. They want to shorten term but want a rally in bonds to ease the pain. Their mindset is anchored on high bond prices before the election. Current bond prices are lower than pre-election but are about where they were at the start of the year. So today’s prices are only bad if you anchor on last month. Bond investors bought their bonds at much lower prices over the years and selling now will give them a good gain to go with their yield. But their focus is short term. So you have millions of these folks who want to sell with trillions of dollars of bonds. This will mean any rally will be smaller than hoped and shorter than expected. The bear market will reassert itself and most investors will be left holding the bag. If the bond bull is over and a secular bear market started, there will be tens of millions of disappointed bond investors who will be selling for years to come. I am a student of momentum. Trends persist over long periods of time for exactly these reasons.
As far as stocks, fear is a greater short term force than greed. So I expect bonds and fear of loss there will lead to a much more muted rally up than stocks will have a counter-trend pull-back. Don’t get me wrong, I still expect stocks to have much less of a pullback than most hope for. Investors are just starting to grasp the enormity of a GOP majority in all three branches of government with a debt-loving business-loving President. The U.S. market averages are only up about 8% YTD even as they hit new highs. I wouldn’t call today’s price excessively high. The outlook was pretty bleak at the beginning of the year. The economy is in much better shape now as Cam has outlined and the outlook is much more business-friendly. Consumers have a burst of confidence. Only a nimble short term trader should wait to participate in the Trump bull market.
I agree with Ken 100%. Investor should buy any dips.
Traders may want to wait for signs of weakness before buying in, but that all depends on your time horizon.
I agree with the Fear of missing out FOMO in the markets. Also seasonally we are entering December, the best month of the year, so its easy to see every little dip being bought to take part in the Santa/ Year end rally.
Ken, you recently posted some very useful permalinks to various sectoral ETFs that had good momentum. Stupidly, I didn’t keep in mind that all comments to Cam’s website are made invisible after two weeks or so.
Might it be possible for you to re-post at some point?
Thanks!
A few general observations in no particular order.
1. Recently, the market has started to over shoot on both the downside and the upside. In my previous post I felt we would find support at the 200 day moving average on the $SPX when the market was going down. The market went down nine days in a row. On the upside I felt it would stall at 2190 (+-) and it again has overshot!!! Look at the Russell 2000. The machines and HFT have taken over.
2. An overbought market or an oversold market can either correct by going down or up (sharp correction) or it can consolidate to relieve the overbought indicators.
3. The type of correction we have from here will tell us if this is a false breakout. One should always keep an open mind.
4. After the Brexit vote and the Trump victory any measure of investor bullishness should be taken with a grain of salt.
5. A bull market in almost all cases starts from a depth of a recession when stocks are undervalued. So if you believe that is the case than this bull market started in March of 2009. Take a look at a multi-year chart. If that is the case the bull market is long in the tooth. What others are seeing is a sector rotation.
6. Finally, if you look at the number of stocks above their 200 day moving average in the $SPX, today it is 68.20 compared to 82 plus in mid-August of this year. Not something to worry about but to be aware that fewer stocks are taking the market higher while all stocks are not joining in the party.
The market should find support on any pull back around 2150. I yet personally believe that the odds of a recession in early 2017 are high – around 70%.
Bonds may be oversold on RSIs etc however we must remember the yield lows were the lowest for 5000 years. Bond have been SO manipulated and have been so far from real value – one must be very cautious.
Re Itlay, just watch Italian bank stocks on Monday morning. I agree the mkt is braced for a no, we can see that in betting odds and there is unlikely to be any significant political moves the following week, plus Italy is v used to technocratic governments; however the bank stocks will be what drives risk sentiment.
If it happens to be a Yes vote, fixed income globally will get smashed (except BTPs!)