I got a few questions about an apparent contradiction in my last post (see Don’t be fooled, Election 2016 isn’t the Brexit referendum). I had highlighted a Mark Hulbert article indicating that former Value Line researcher director Sam Eisenstadt had a SPX target of 2270 to 2310 by April 2017.
At about the same time, Hulbert had also written a Barron’s article on November 3, 2016 where he postulated little or no upside in stock prices, based on the analysis of the Value Line Median Appreciation Potential (VLMAP). In fact, VLMAP readings are similar to levels seen at the 2007 market top:
Market timers use the VLMAP to project where the stock market will be in four years, the midpoint of the analysts’ three-to-five-year horizon.
The VLMAP is currently at one of its lowest levels in years—as low, in fact, as it stood at the top of the bull market in October 2007, right before the worst bear market in the U.S. since the Great Depression.
Value Line itself does not recommend using the VLMAP as a market-timing tool, even though the firm is not against anyone using it or any of the other data it produces. As far as I can tell, the VLMAP-based market-timing model originates in work done in the 1970s and 1980s by Daniel Seiver, a member of the economics faculty at California Polytechnic State University and editor of an investment advisory service called the PAD System Report.
It’s worth noting that a casual reader of the Value Line Investment Survey wouldn’t immediately become alarmed upon viewing the latest VLMAP reading. It stands at 40%, which over four years is the equivalent to an annualized return of 8.8%.
As Eisenstadt had been the long serving research director of Value Line until 2009, how can investors reconcile these apparent contradictory bullish and bearish views based on similar data. Which interpretation of Value Line data should we believe?
VLMAP vs. Eisenstadt
There are some crucial differences to the two approaches. As Hulbert correctly points out, Value Line does not endorse the use of VLMAP for market timing purposes. Market timing analysis of VLMAP is based on the academic research by Daniel Seiver. Siever’s work on the use of VLMAP assumes long time horizons, whereas Eisenstadt’s only makes six-month market forecasts.
Having said that, let’s examine the recent track record of the two timing systems. Hulbert wrote that VLMAP flashed a warning signal for stock prices in a WSJ article in April, 2013:
The stock market in four years’ time is unlikely to be much higher than it is now.
That sobering forecast comes from a simple stock-market timing model that has an impressive track record over the past five decades. Among the more than 100 market timing strategies tracked by the Hulbert Financial Digest, in fact, this model has turned in the best performance of any in forecasting the market’s four-year return.This market timing system is based on a single number that appears each week in the Value Line Investment Survey, the flagship publication of Value Line, a New York-based research firm. The number represents the median of the percentage gains that Value Line’s analysts estimate the 1,700 widely followed stocks they monitor will produce over the next three to five years.
Over the past five years, for example, this number—known as the VLMAP, for Value Line’s Median Appreciation Potential—has been as low as 45% and as high as 185%. It currently stands at 50%.
Value Line itself doesn’t endorse using the VLMAP for market-timing purposes. Though the firm doesn’t actively discourage investors from relying on this number or any of the other data that it produces, Value Line instead showcases a market-timing model that has a shorter-term focus.
Those who do follow the VLMAP for market-timing purposes use it to project where the market will be in four years, the midpoint of the analysts’ three- to five-year horizon. Because Value Line’s analysts—like most of Wall Street—are on average too optimistic, followers of the VLMAP often adjust it downward when translating it into a specific four-year forecast.
For example, Dan Seiver, an emeritus economics professor at Miami University of Ohio and chief economist at Reilly Financial Advisors in La Mesa, Calif., told me that he advises clients to use any VLMAP reading below 55% as the occasion to build up cash.
Hulbert reiterated that warning several months later in a Marketwatch article in August 2014:
The VLMAP recently dropped to just 35%. The last time it was this low was in July 2007. At the top bull market in October of that year, it stood at 40%.
As Seiver recently pointed out to his clients, the VLMAP’s current level “puts it in the worst 5% of all readings since 1966. In the past, a level as low as this has preceded months or years of poor stock returns. We doubt this time will be different.”
To be sure, Seiver’s model is not a short-term market-timing tool. As he pointed out the last time I wrote a column about it, “the stock market can continue to rise for months, if not years, after a sell reading.” Indeed, as documented in his Journal of Wealth Management study, it’s over a four-year horizon that the model has impressive forecasting powers.
Hulbert hit the nail on the head when he wrote that “Seiver’s model is not a short-term market-timing tool”. By contrast, Sam Eisenstadt makes short-term forecasts with six month horizons. The chart below shows the record of Seiver’s VLMAP sell signals (in blue) against Eisenstadt’s calls (in red), both of which were documented by Mark Hulbert.
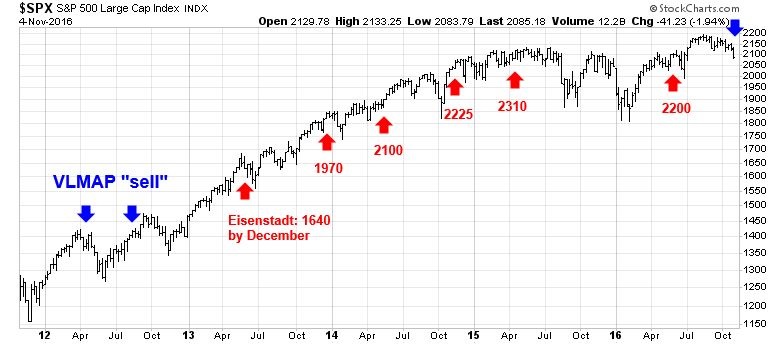
In the past, Eisenstadt has tended set index targets that were overly bullish. Here are his forecasts that I could find:
The latest was dated November 4, 2016, which called for a six-month target of 2170 to 2310.
Horses for courses
Which one should you believe? Both have their uses. I have used VLMAP successfully in the past for long-term asset allocation purposes, but it is less effective as a short-term timing tool. On the other hand, Eisenstadt has been consistently bullish since 2013, though his targets have tended to be overly ambitious. His forecasts have been better at the direction of the market, rather than the specific target level. Their utility may be better as a forecast of the macro and fundamental drivers of stock prices, such as earnings growth and interest rates.
Each of these quant models have their own uses. Make sure you are using the right tool for the right purpose.
Strategists and we investors love to predict. It’s in our blood. But we have been dealt an environment that is simply impossible to predict. Central Bankers admit publicly that they don’t know how all the QEs will be unwound and the mountain of global debt will be paid back in an orderly fashion.
This is why I believe momentum-style investing is the way to go. With it, you detect trends and then confirm the rational behind them. If they make sense, you get on board and stay as long as the trend persists.
I’m sad that this is happening because I’d much rather use my 40 years of experience to predict the future. But the truth is, past experience is not a help, it’s a hindrance to navigating a path forward to a decent return safely.