Preface: Explaining our market timing models
We maintain several market timing models, each with differing time horizons. The “Ultimate Market Timing Model” is a long-term market timing model based on the research outlined in our post, Building the ultimate market timing model. This model tends to generate only a handful of signals each decade.
The Trend Model is an asset allocation model which applies trend following principles based on the inputs of global stock and commodity price. This model has a shorter time horizon and tends to turn over about 4-6 times a year. In essence, it seeks to answer the question, “Is the trend in the global economy expansion (bullish) or contraction (bearish)?”
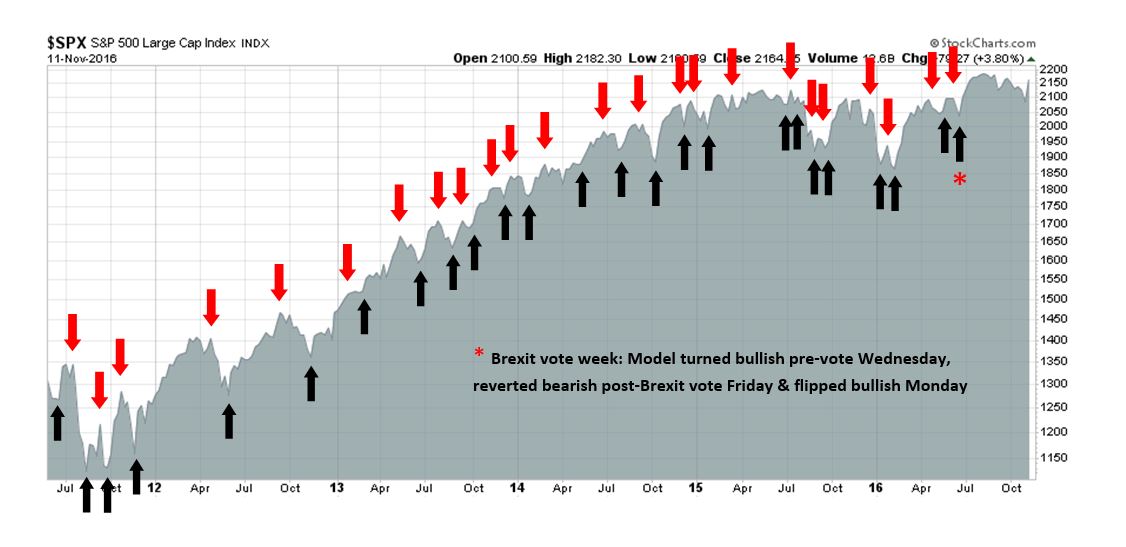
My inner trader uses the trading component of the Trend Model to look for changes in direction of the main Trend Model signal. A bullish Trend Model signal that gets less bullish is a trading “sell” signal. Conversely, a bearish Trend Model signal that gets less bearish is a trading “buy” signal. The history of actual out-of-sample (not backtested) signals of the trading model are shown by the arrows in the chart below. Past trading of the trading model has shown turnover rates of about 200% per month.
The latest signals of each model are as follows:
- Ultimate market timing model: Buy equities
- Trend Model signal: Risk-on
- Trading model: Bullish
Update schedule: I generally update model readings on my site on weekends and tweet any changes during the week at @humblestudent. Subscribers will also receive email notices of any changes in my trading portfolio.
A glass half-full, with caveats
Last week, I urged readers to be agnostic about the electoral outcome and to stay focus on the investment climate instead (see Don’t be fooled, Election 2016 isn’t the Brexit referendum):
It would be too easy to get into an impotent rage should your favored candidate lose, or if policy doesn’t go in your desired direction. That kind of thinking clouds judgment and leads to subpar investment results.
Stock prices are a function of earnings, the growth outlook, interest rates, and risk premium. There is much we don’t know about policy details under a Trump administration, but the market’s judgment of the election oscillated from unbridled panic on to euphoria in less than 24 hours. The fast money crowd jumped into the risk-on momentum trade last week. Based on historical studies, the rally has the legs to go much further. Here is a study from Nautilus Capital, which indicates that the returns after election day is indicative of momentum for the next 3-6 months (n=30):

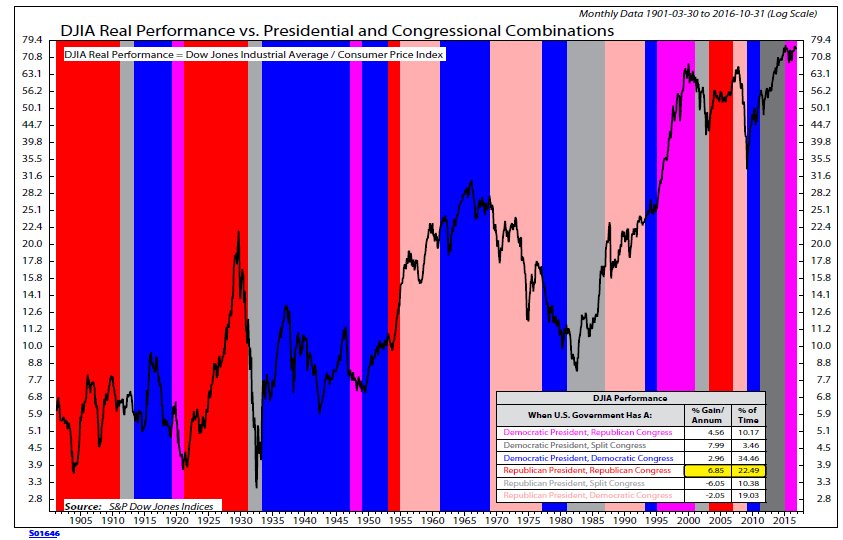
Ned Davis Research also pointed out that the combination of a Republican president and Republican Congress have enjoyed the second best returns (caution, n=3):
The stock market embraced the reflation investment thesis that I have been writing about for several months, except this time it`s reflation on steroids (also see Super Tuesday special: How President Trump could spark a market blow-off). As there are many blanks that still to get filled in about the new administration, it’s important to be aware of the bull case and bear case for stocks.
Trump, the old fashioned Keynesian
If I told you that the new administration was going to usher in a new era consisting of the following market friendly measures, what would you do? (Remember that traders don’t care much about social policy).
- Personal and corporate tax cuts
- Corporate tax incentives for the repatriation of offshore cash, which will opens the door to buybacks, special dividends, or capital investments
- Decreased federal government regulation and oversight
- Massive infrastructure spending
- A repeal of Dodd-Frank, which allows investment banks to take on more risk and create the climate for a bubble – and the first leg of investment bubbles are bullish for stocks
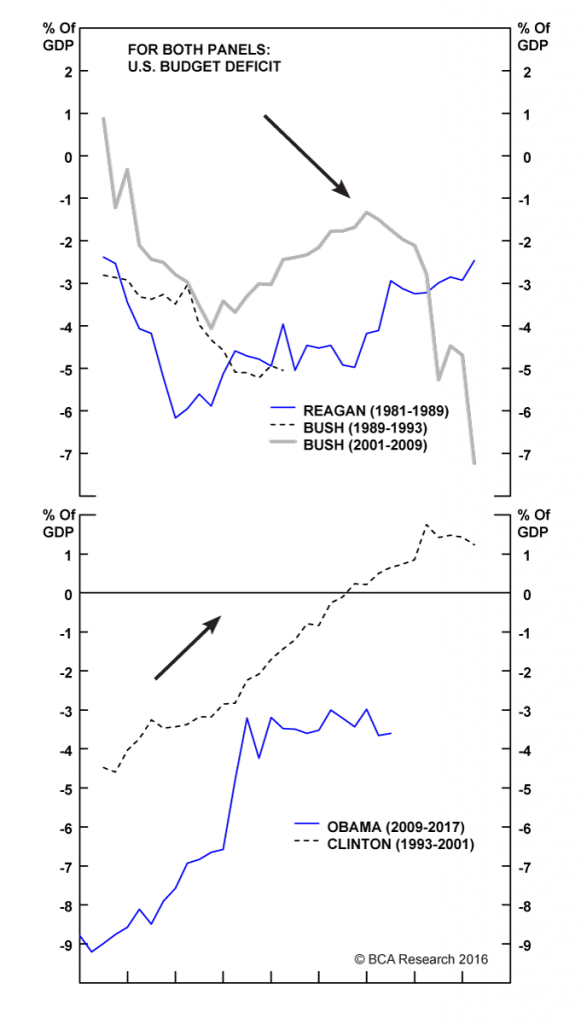
These policies represent a shot of Keynesian stimulus, pure and simple. Despite the rhetoric about the Laffer curve and how tax cuts would pay for themselves (they didn’t), much of the boom of the Reagan years was fueled by the same kind of Keynesian rocket fuel. BCA Research pointed out that Republican administrations have tended to tilt towards expansionary fiscal policies. Bottom line: expect tax cuts, more spending, and higher deficits under President Trump.
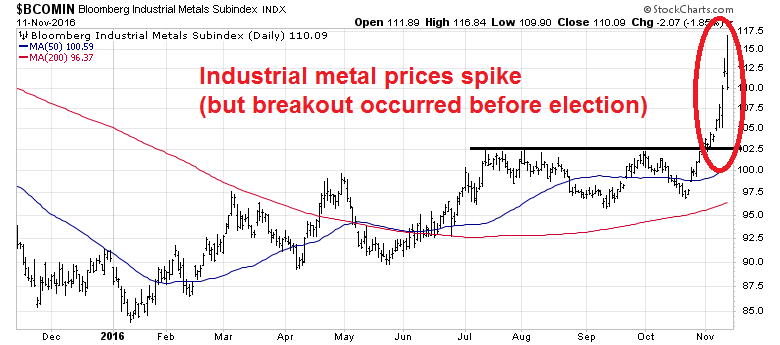
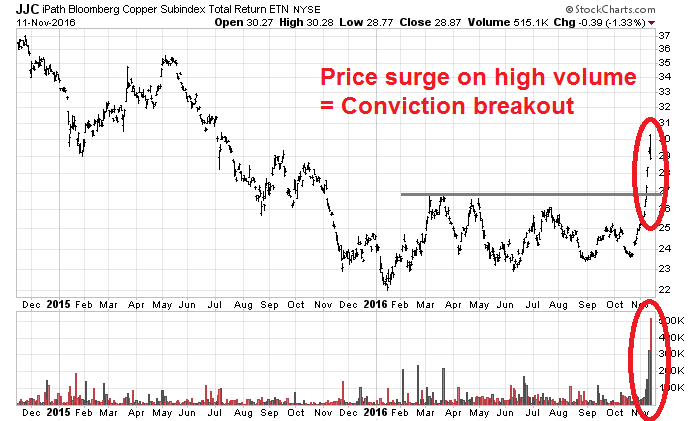
The market reacted to the election with a massive risk-on response. Investors poured $24b into equity ETFs last week. The cyclically sensitive industrial metal prices soared and staged an upside breakout through resistance, though the breakout occurred before the election.
The rally in industrial metals was achieved with high conviction, as measured by trading volume. As an example, the copper ETF (JJC) broke out to new recovery highs on massive volume.
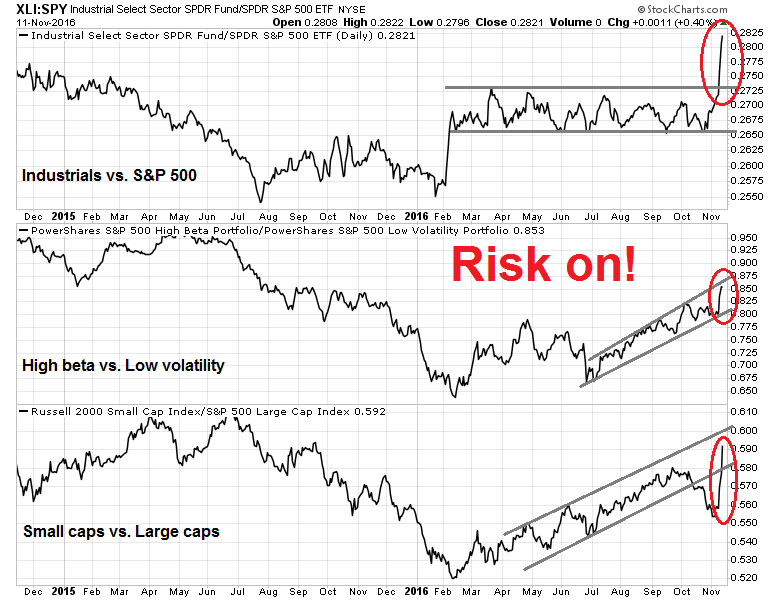
Industrial stocks, which represent the capital goods industries, also staged an upside relative breakout. We also saw similar risk-on behavior from the relative performance of high beta and small cap stocks.
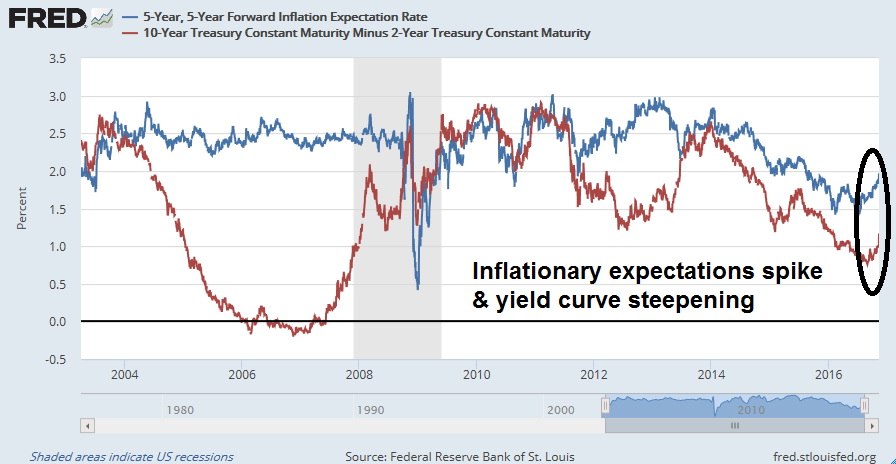
Bond yields rose and inflationary expectations soared. Even as interest rates rose, the yield curve steepened, which indicates that the bond market expects higher economic growth.
Insiders also participated in the risk-on stampede. Barron’s reported that insiders have shrugged off their pre-election nervousness and started buying again.
The single surprise came from earnings estimate revisions. The latest update from Factset shows that forward 12-month EPS dipped last week after many weeks of upward progress. On the plus side, the Q3 EPS and sales beat rates were quite healthy by historical standards. As well, Q4 earnings guidance is coming at better than average. In addition, Brian Gilmartin observed that the Thomson-Reuters YoY growth in forward EPS improved from 3.59% to 3.69%. I will be watching the forward EPS metric carefully next week to see if this was a data blip.
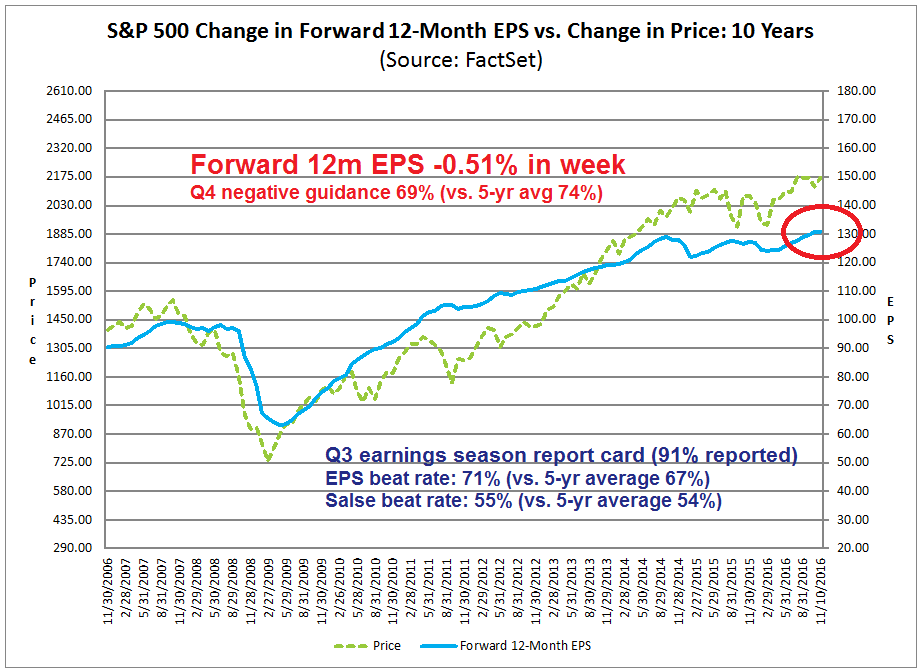
Growth expectations are (mostly) surging. Risk on!
Reading the fine print: Geopolitical tail-risk
Before anyone gets too excited, investors need to read the fine print of Trump policies. There are two kinds of events that are fatal to bull markets, namely recessions, and war and rebellion that result in the permanent loss of capital. Both kinds of risks are rising.
The tail-risk of an adverse geopolitical event is higher than it would have been under previous post-war administrations stretching from Truman to Obama. The post-war consensus was been shaped by American leadership and participation in global institutions such as the United Nations, the International Monetary Fund, and the World Bank. By contrast, candidate Donald Trump has made it clear that he prefers an isolationist America. Should President Trump withdraw from the political and financial support of these organizations, what happens to global stability in the next crisis?
Imagine that a country like Turkey suffers a financial crisis in the not too distant future. If a weakened IMF is unable to come to its rescue, what are the geopolitical ramifications of a financial collapse be on this NATO member and Middle East country that borders Syria, Iraq, and Iran?
Financial or political chaos in Turkey is just one of the milder and more benign scenarios of an American withdrawal from global institutions. The likes of ISIS, Russia, and China are likely to test the new president in some fashion. How would Trump react if “little green men”, or out of uniform Russian special forces, were to suddenly appear in Latvia, Lithuania, or Estonia? What if Beijing decides to probe Washington’s resolve in the South China Sea? Already, the Philippines has signaled that it is moving closer to China’s orbit and away from America. How would President Trump answer such provocations?
Candidate Trump won the Republican nomination and the presidency with the use of an alpha male persona who blusters, and threatens until he gets his way. The alpha male archetype appealed to his electoral base because “he tells things as they are”, which also signaled that he will stand up to the Chinese, Mexicans, and so on. In the event of a confrontation with a nuclear armed foe, how does he respond?
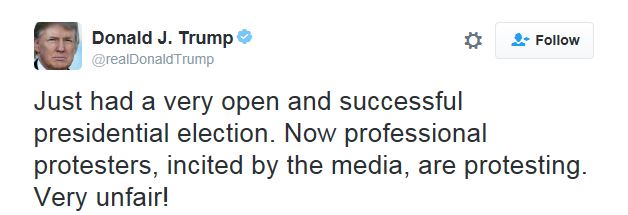
Will he be the presidential Trump with a measured response, as he did by vowing to be president to all Americans in his victory speech on election night? Or will he be the alpha male Trump? Consider these two tweets of his reaction to the recent street protests. The first was written in typical alpha male fashion.
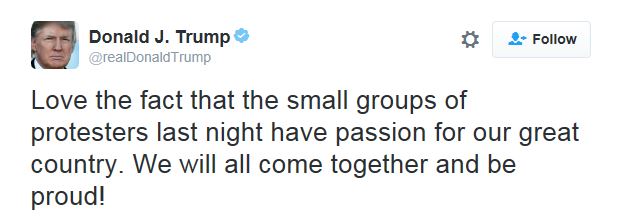
The second came from presidential Trump, probably after consultation with staff.
Which Donald Trump shows up if America goes toe-to-toe with the Russkies, the Chinese, or the North Koreans? Lower taxes, less regulation, and infrastructure investments may sound great for equity returns, but not if Hawaii gets fried by a mushroom cloud. While I am not forecasting a nuclear confrontation, but geopolitical tail-risk is far more elevated under Trump than previous administrations.
Will a protectionist America spark a global recession?
The second risk comes from the economic drag created by Trump’s protectionist leanings. This week’s cover of Barron’s fretted specifically about this possibility.
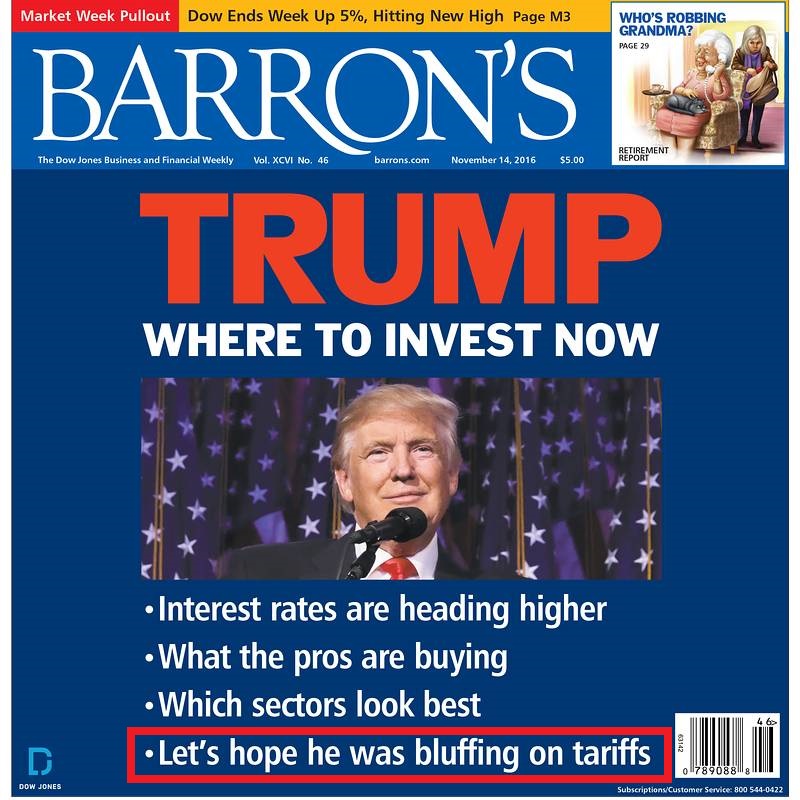
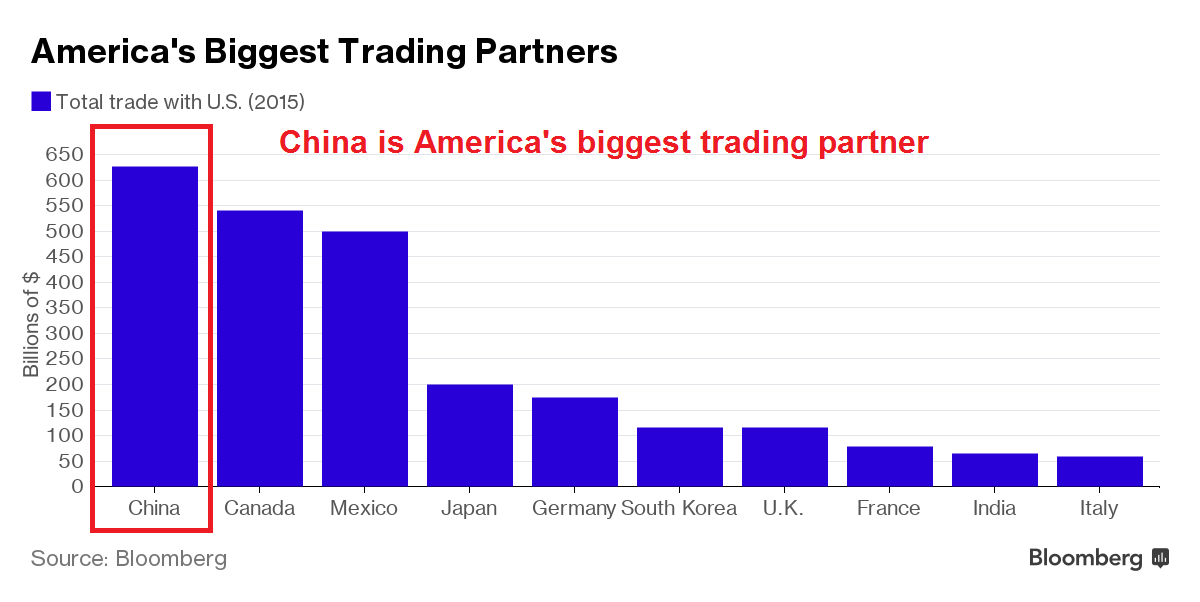
Candidate Trump had vowed to slap a 45% tariff on Chinese imports. Bloomberg reported that China is America’s biggest trading partner. The current era of globalization has created global supply chains that cannot be unwound easily. The imposition of significant tariffs on a country like China would wreak havoc with corporate profitability and global trade.
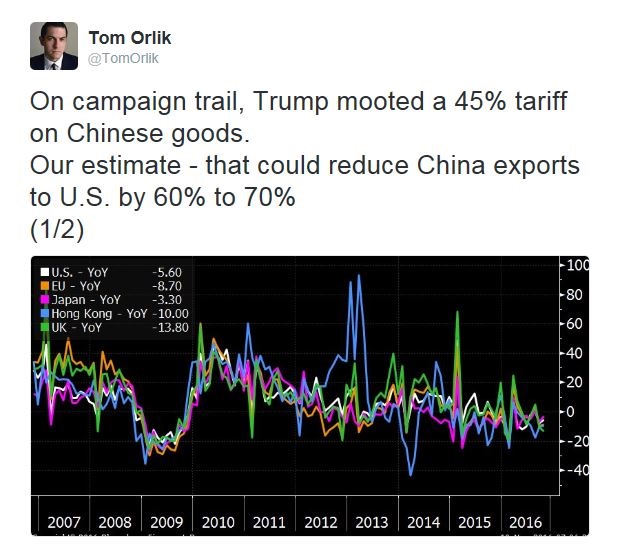
Bloomberg’s Chief Asia Economist Tom Orlik modeled the effects of a 45% tariff on Chinese goods and found that Chinese exports to the US would collapse by 60-70%.
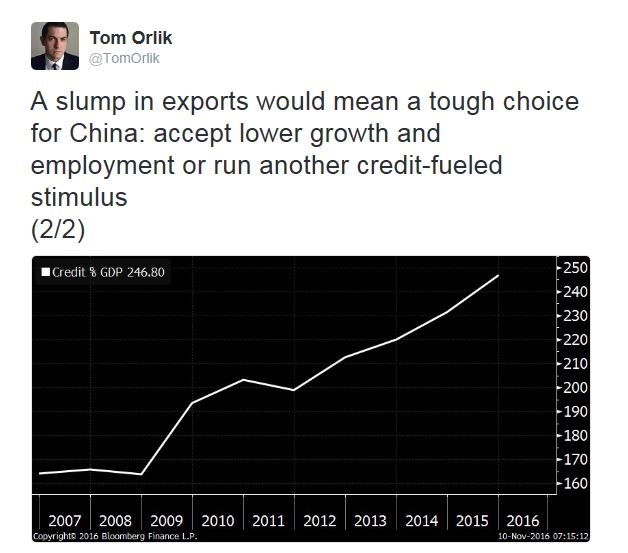
Notwithstanding the even more negative second order effects of a trade war, Orlik observed that it would force Beijing to choose between lower growth or more credit-fueled bubble-blowing stimulus.
The 45% tariff is an extreme scenario as it probably represents the opening bid as part of a negotiation. The Peterson Institute has a handy guide on the different presidential powers available to Trump if he wishes to impose tariffs or quotas, which are quite extensive. Even if Trump were to raise duties on Chinese goods by a lower amount, such as 15%, it would cause a substantial slowdown in the Chinese economy. Such a development would sorely test the stability of their already fragile financial system (see How much runway does China have left?).
Imagine the following scenario. The Chinese economy slows from falling American trade. Asian growth tanks. as most Asian economies like South Korea, Taiwan, Singapore, and Hong Kong are tied to China. The imports of capital goods from Europe, and Germany in particular, would fall. The eurozone, whose growth outlook is already weak, then plunges into recession. As European banks have not remedied their balance sheets since the Great Financial Crisis, it sets up the conditions fo another Lehman Crisis (see How bad could a Chinese banking crisis get?). The result could be another global recession. Stock prices would crater 50% again as they did in 2008.
Still a blank slate
Don’t get me wrong, I am still bullish on equities. Being a bull, however, doesn’t mean that you shouldn’t be aware of the risks to your forecast. Right now, the Trump administration is a blank slate. The appointment of the cabinet should provide some clues to the direction of policy.
Here are some of the key appointments that I am watching. How much foreign affairs knowledge and experience will the Secretary of State have? What about the national security advisor? How protectionist will the Secretary of Commerce, or the Treasury Secretary be?
The omens look iffy. Politico reports that the two leading candidates to be Secretary of State are Newt Gingrich and Bob Corker. While Corker served as the chair of the Senate Foreign Relations Committee, Gingrich has little foreign affairs experience.
The outlook on the trade front are not good. Trump affirmed his protectionist leanings in a recent WSJ interview and stated that “he would preserve American jobs by potentially imposing tariffs on products of U.S. companies that relocate overseas, thereby reducing the incentive to move plants abroad”.
Politico also reported that the two leading candidates for the Commerce post are Dan DiMicco and Wilbur Ross. DiMicco was the former CEO of Nucor Steel, an industry that was devastated by Chinese imports. Ross is known for restructuring failed companies in industries such as steel, coal, telecommunications, foreign investment and textiles. Many of these industries were highly exposed to foreign competition. Neither is likely to be a friend of China on the subject of tariffs.
As the stock market has embraced the “glass half-full” case with great enthusiasm, I am willing to give the bulls the benefit of the doubt for now. Nothing will happen until Donald Trump moves into the White House. While geopolitical risk could blow up at any time after the Inauguration, the consequences of any protectionist policy is unlikely to show up until late 2017 at the earliest.
The week ahead: Can momentum continue?
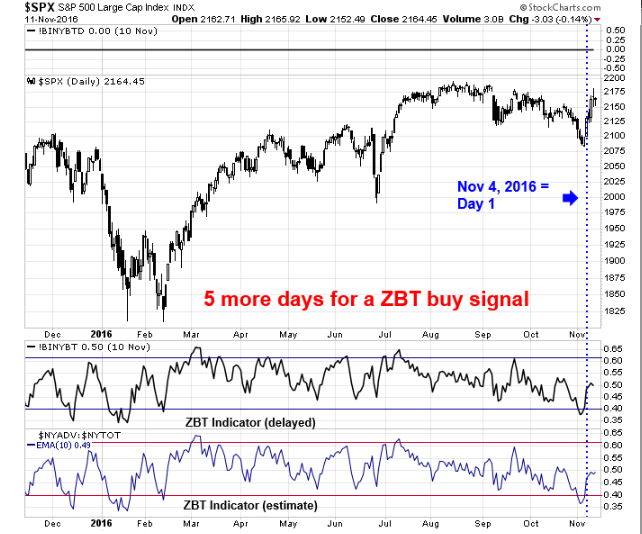
Looking to the week ahead, the biggest question for traders is whether the positive price momentum can continue. I wrote about the Zweig Breadth Thrust setup last week (see The market has spoken!). The market has until next Friday to complete the ZBT buy signal in the 10-day time frame. If it does, it would mark another rare and can’t miss momentum buy signal. The market paused in its advance on Thursday and Friday, but did not decline significantly, which is a constructive sign. The fact that the Dow has already made an all-time high is testament to the power of this latest buying stampede.
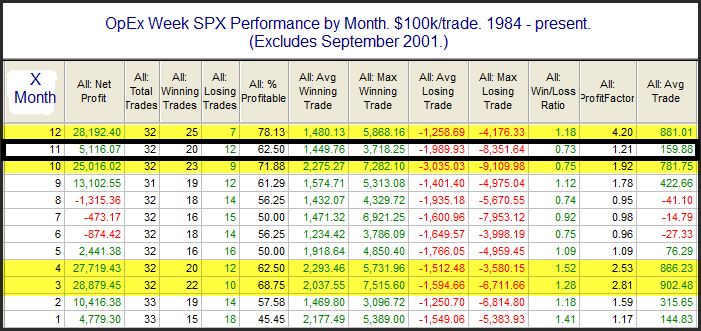
Next week is also November option expiry. Rob Hanna of Quantifiable Edges shows the statistics for November OpEx below, whose profitability is roughly average compared to all of the other months.
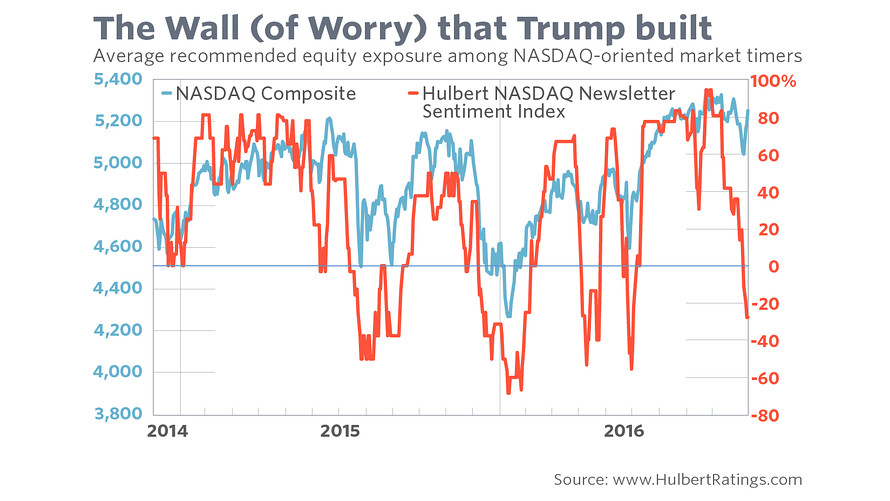
Mark Hulbert reported that as of November 11, which is after the election, NASDAQ timer sentiment were nearing a crowded short. Such a reading is contrarian bullish.
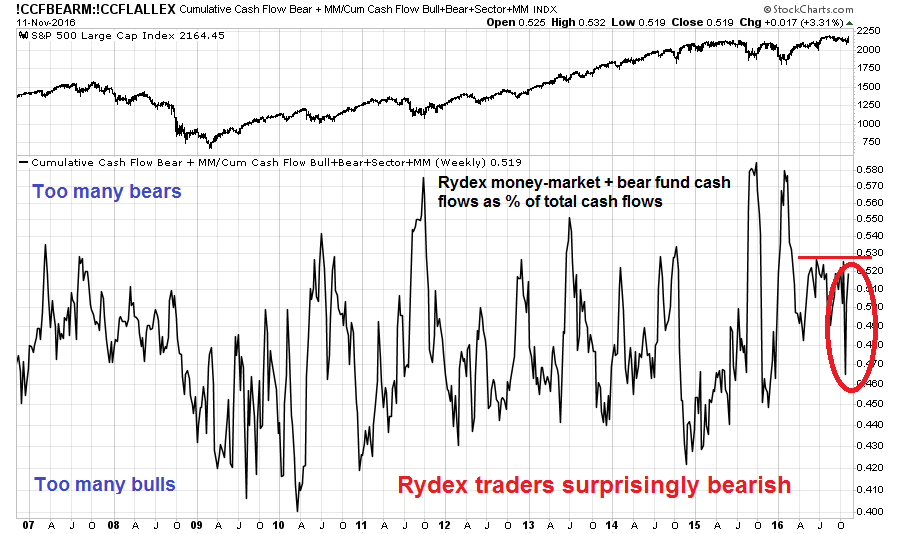
Rydex trader sentiment is also surprisingly bearish in light of the surge in stock prices.
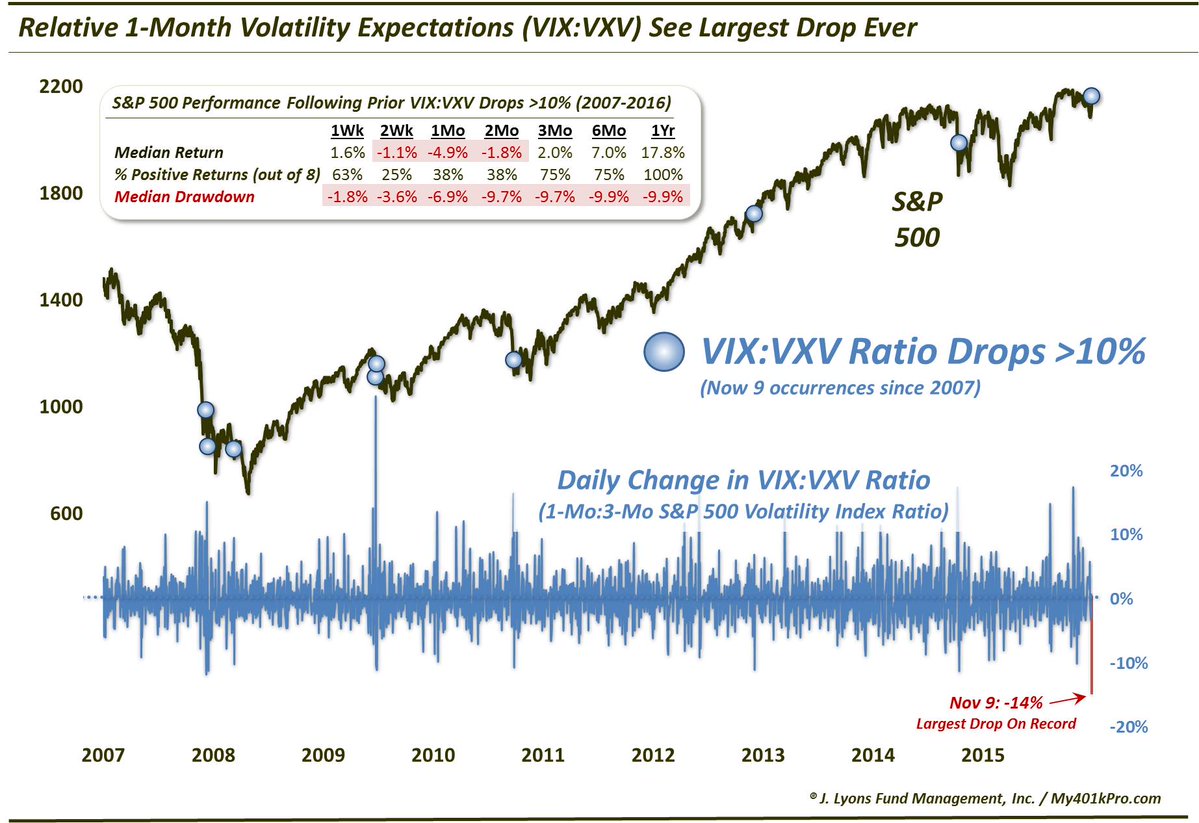
On the other hand, I highlighted the elevated level of fear in the term structure of the VIX Index last week. In particular, the fear factor was especially evident in the 9 day VIX (VXST) to 1-month VIX Index. In the wake of the election sparked rally, the term structure has normalized and fear has receded.
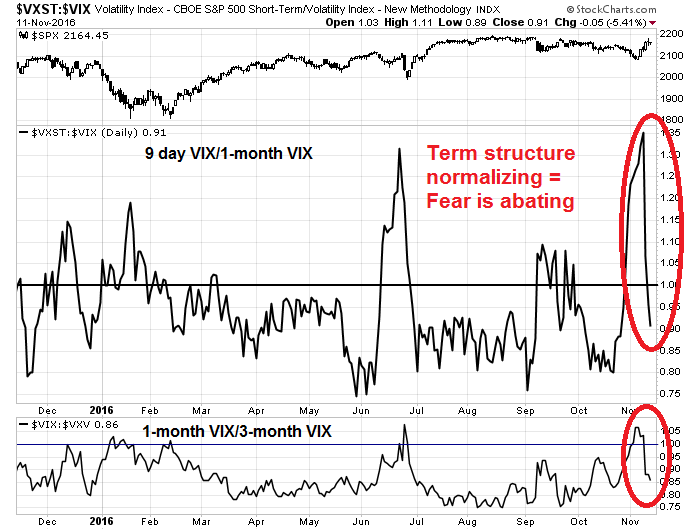
On the other hand, a historical study by Dana Lyons shows that rapid falls in the VXST to VXV ratio have tended to resolve themselves in a bearish manner.
My head hurts. I am confused. I have no idea of what will happen next week as the market’s mood has proven to be incredibly fickle. My inner investor remains bullish on equities, but the risks are rising and he is getting skittish. My inner trader is nervously long. He is crossing his fingers and hopes for the best, while preparing for the worst.
Disclosure: Long SPXL, TNA
I took positions in some of the defense stocks (especially SAIC) you mentioned some time ago. They did very well last week. I would imagine that they will do well in most scenarios.
I have a question for your inner investor Cam. If your Protectionist Trump scenario plays out in the new year what changes do you make to your investment portfolio? Do you go to cash and by how much?
SH is showing enormous outflow over the past 2 weeks – that is not normally a good sign for bulls especially as the market is near (at, or achieved new) ATH. I’d take SH over Rydex data nowadays simply due to the participation and popularity of the former vs the latter. Another thing to watch close is breadth. Using breadth data across US exchanges, this blast off (especially the one since Wed) has been very weak. Since 2014, no intermediate bottom or even short term blast off (Oct 2014, Feb 2015, July 2015 post Grexit, initial bounce off Aug 25 2015 crash, intermediate bottom Sept/Oct 2015, first leg off Jan low this year, initial push off after Feb 11 this year, Brexit rally) has come with worse breadth data averaged over 3 days. The one that comes close is the rally off Aug bottom in 2014. Something is very off on this rally, especially since Wed. We probably could use a few more days of euphoria (with ISEE equity only data already showing such but CBOE equity only PCR only so since Friday) by the dumb money, before a significant top is put in.
If you are defining breadth in terms of the NYSE AD Line, that has a lot of closed end bond funds that got killed. The S&P 500 A-D Line, which measures apples-to-apples, looks ok.
https://twitter.com/HumbleStudent/status/797900944268627968
I am using breadth data across all US exchanges and no doubt there will be some bond funds. I don’t think it will change the end result much. If I only look at sp500 only advance decline line, cumulative value hasn’t even surpassed early Oct high. I don’t know what Russell 2000 breadth is like though it probably is the best. However, IWM volume vs 200 day average is at 3.27 on Friday. This is blow off parabolic move type of volume. Last time volume has exceeded this ratio was back on 9th Aug 2011 when IWM bottomed after the Aug waterfall in 2011.
Once again I suggest investing in industry sectors not THE MARKET. Sentimentrader.com last week noted that an unusually large number of stocks were hitting 52-week Highs at the same time as an extraordinarily large number of stocks are hitting 52-week lows. In this new Trump market there are huge winners and huge losers. By investing in the general stock market you get an average of the winners and losers. Buy the winners.
I say rather than looking ahead at the politics in the next year or so why not invest in the areas that we are certain that Trump is going to favor. The US banking industry is an obvious winner. Dodd-Frank is very likely to be repealed and that is extremely positive for this industry. Obamacare will be repealed. That’s almost a hundred percent certainty. So the healthcare area is a good place to invest. America is going to be looking inward on industry so the industry ETF includes domestic Industries as well as defense and aerospace which will be a very good area in a Trump Administration. Energy will also be positive domestically but it does face global trends as far as crude oil pricing so may not be as sure a bet as the others.
Banking and Healthcare sectors were massively underperforming going into the election because they feared a Hillary Administration. So these stocks are cheap and are coming off a low valuation which makes them even a better bet going forward. Just imagine taking the trading handcuffs off of Goldman Sachs for the next 4 or 8 years.
In my experience I find that once an extremely new trend comes along most people are caught flat-footed and fail to react quickly to the change in the long-term outlook. People are anchored into the recent prices and don’t factor in the long-term benefits of the new environment. My experience is that one should disregard the sharp increase in recent prices and focusing on where you think things will go in the next long period of time. With banking under a Trump aministration the profitability of the industry will be much higher and as each successive deregulation step taken will boost people’s confidence in the industry. I think this is the ideal investment at the moment.
We are 4 days into a 4 year trend. Diss it and you will miss it.
Here are the momentum charts I have made for the new Trump stock market. There are two charts on each.
The top one is the 9 month running % change in the sector versus the general stock market. The red line is versus the S&P 500. The green line is versus the Canadian general market for us Canucks. If the red line is above the zero line, it means the industry group is outperforming the S&P 500 over the last 9 months. Why 9 months? Academics are split between 6 months or a year as the best look-back so I did 9 months.
The bottom one is the sector and the general market performance rebased to start at identical starting values the night before the election. Watch this to see if the sector continues to lead the market’s performance.
Cut and paste these links to something (email to yourself, word doc or ?) and you can check them whenever you want in the future. They will update every day.
Bank ETF
https://product.datastream.com/dscharting/gateway.aspx?guid=827cb7df-1983-4888-9941-f89cabb6fb8c&action=REFRESH
Healthcare ETF
https://product.datastream.com/dscharting/gateway.aspx?guid=6ce04481-6930-43aa-b70e-0e36fbdc8097&action=REFRESH
Biotech ETF
https://product.datastream.com/dscharting/gateway.aspx?guid=fb339902-6887-49b3-be28-14bf5b8ad7f8&action=REFRESH
Industrial ETF
https://product.datastream.com/dscharting/gateway.aspx?guid=0d5bc9b6-6da2-4e10-a447-6a5e4d55138d&action=REFRESH
Defense and Aerospace ETF
https://product.datastream.com/dscharting/gateway.aspx?guid=06fe17e1-c638-4890-96a4-d53a79577e1b&action=REFRESH
Oil and Gas Explorers ETF
https://product.datastream.com/dscharting/gateway.aspx?guid=0fd7dca9-8c76-4e1f-9bfe-e88905c1feed&action=REFRESH
Oil Service ETF
https://product.datastream.com/dscharting/gateway.aspx?guid=3074c3a3-5347-4323-8064-f6aba644859b&action=REFRESH
I choose individual stocks in outperforming industries only if they are outperforming their sector. Why own something like a certain bank if it is lagging the Bank ETF? Any one stock has higher risk than the whole sector. I also believe that if I have a strong belief in a sector, why even buy an individual stock if it might stumble for some unknown individual reason as the group goes up? That is the glory of ETFs. It give cheap participation in an industry trend.
All of this is about what I am doing. It’s not a recommendation for you since I know nothing of your circumstance.
Ken, Thanks for sharing the links!
My pleasure, Janet. We are in this together
@Cam: just wanted to share that Stan Druckenmiller believes in the Laffers curve (i.e. reducing tax increased revenue but it was offset by higher defence spending in the reagan era) as seen in the video inside this article: http://www.zerohedge.com/news/2016-11-10/druckenmiller-i-sold-all-my-gold-night-election
@Ken: appreciate the links, thanks!!
Actually the wiki article on Laffer curve is much more informative than Druckenmiller’s comment.
I am just a practical kind of guy. Here is what we know from historical experience.
Reagan tax cuts: Growth rose, and so did deficits.
Bush II tax cuts: Deficits rose, but the US poured a lot of money into the war in Iraq and Afghanistan.
We can argue about whether tax cuts spur growth (they probably do), but the historical experience is mixed as to whether they pay for themselves.
“I am confused.” You’re not confused when you are merely not taking a position because the data is contradictory.