Preface: Explaining our market timing models
We maintain several market timing models, each with differing time horizons. The “Ultimate Market Timing Model” is a long-term market timing model based on the research outlined in our post, Building the ultimate market timing model. This model tends to generate only a handful of signals each decade.
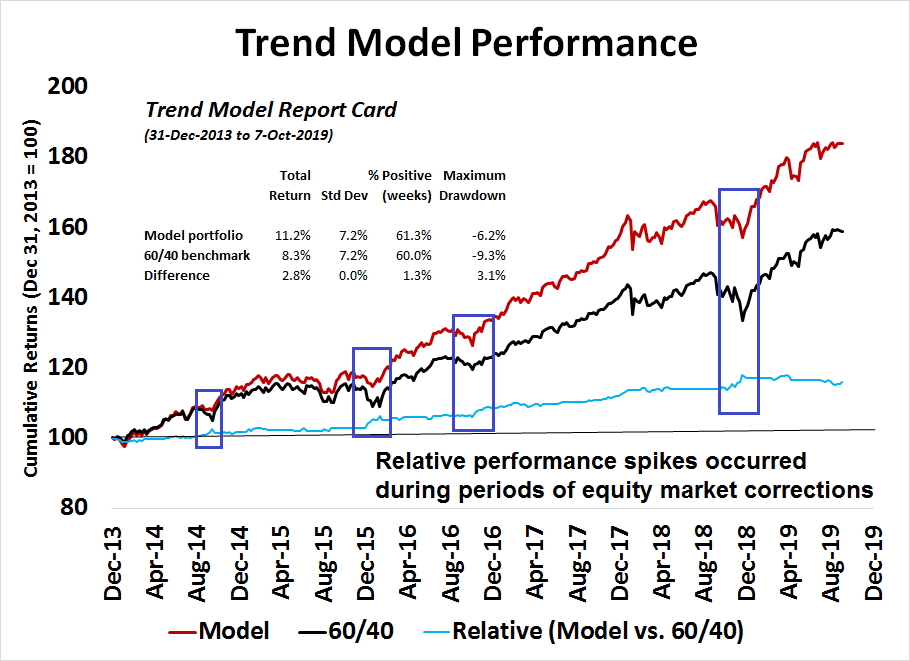
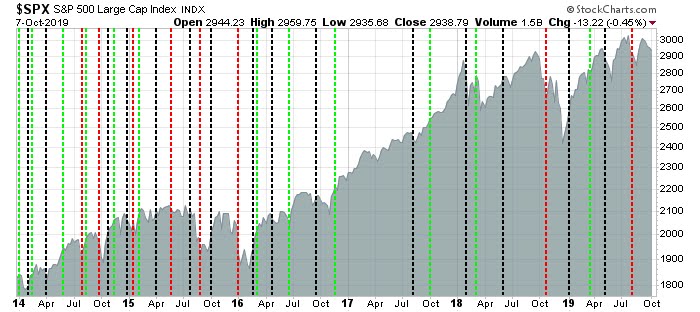
The Trend Model is an asset allocation model which applies trend following principles based on the inputs of global stock and commodity price. This model has a shorter time horizon and tends to turn over about 4-6 times a year. In essence, it seeks to answer the question, “Is the trend in the global economy expansion (bullish) or contraction (bearish)?”
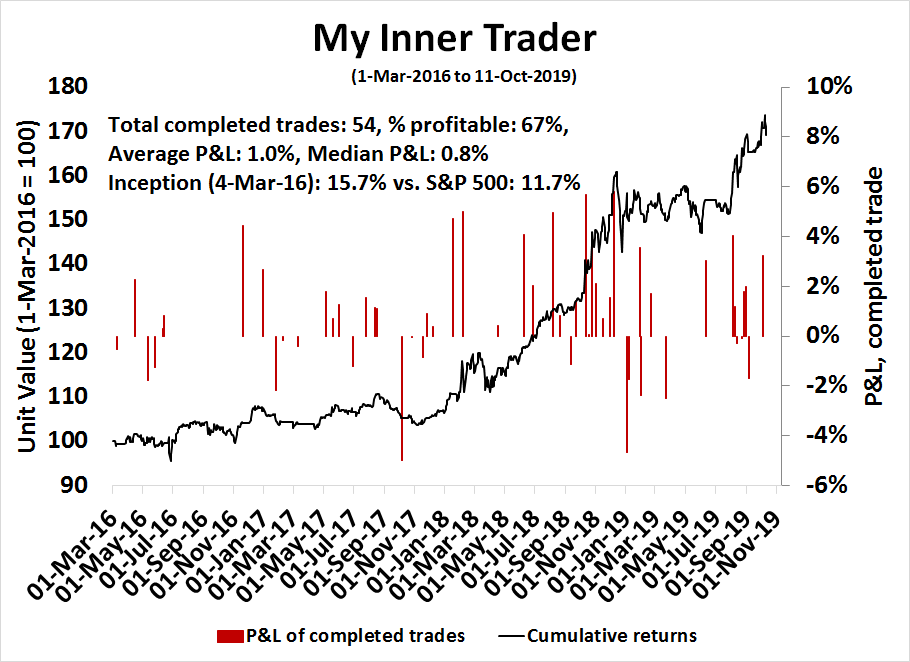
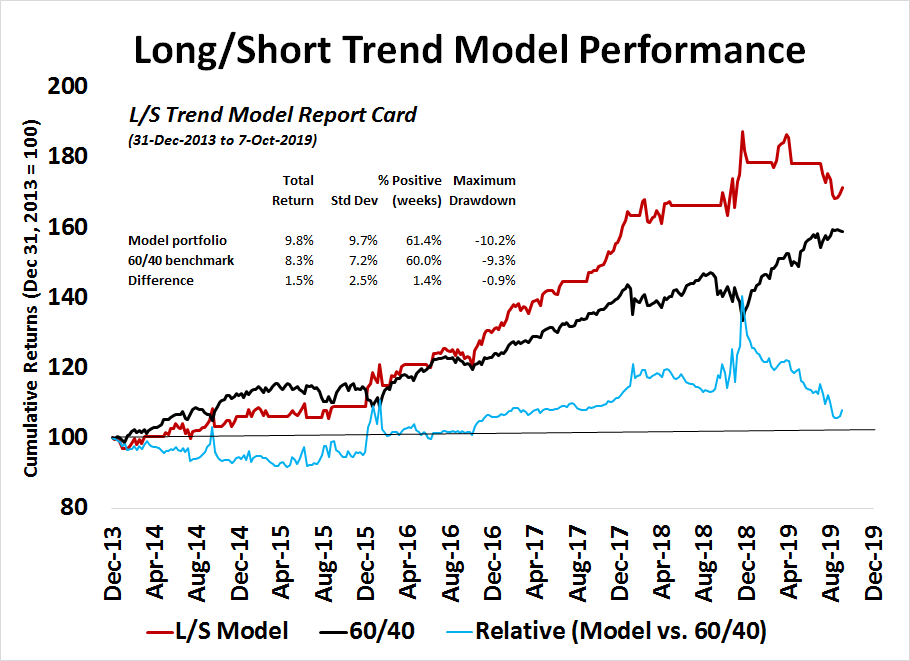
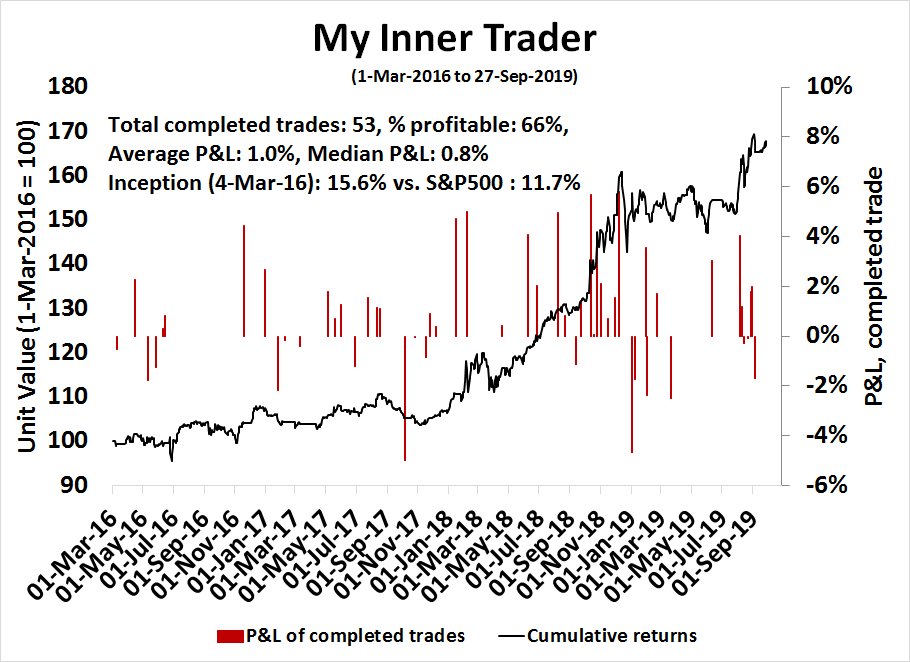
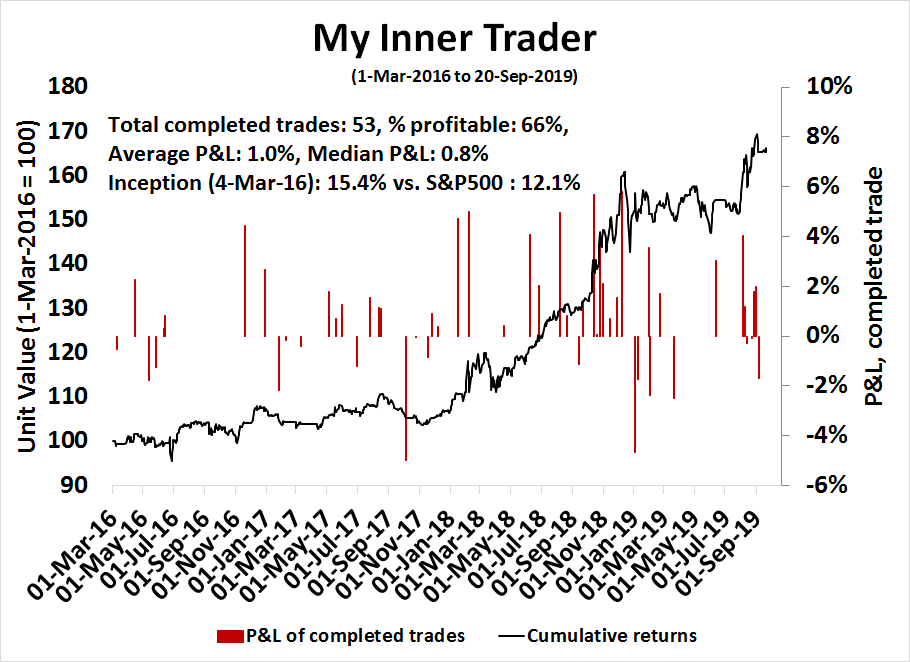
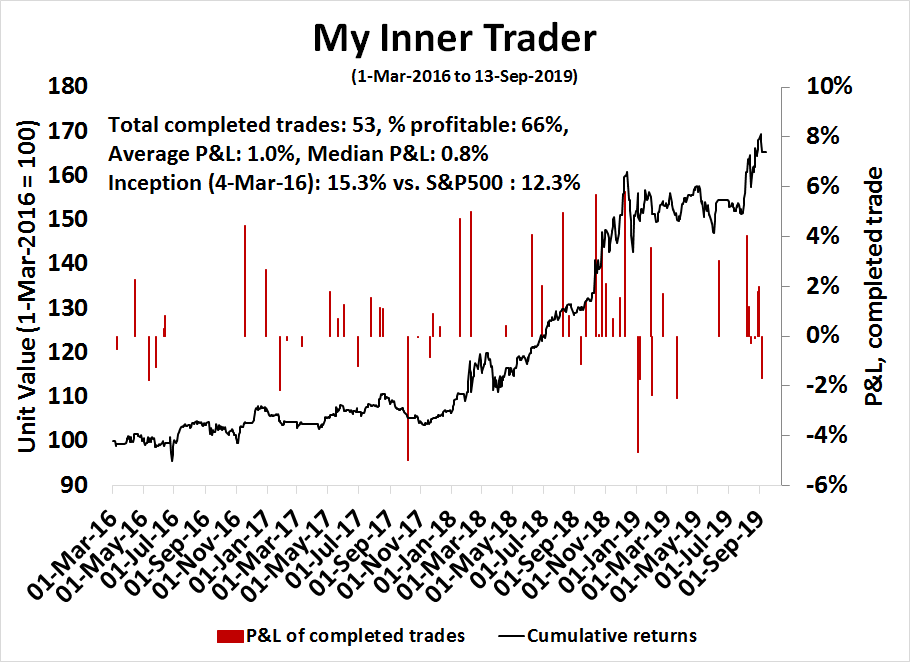
My inner trader uses a trading model, which is a blend of price momentum (is the Trend Model becoming more bullish, or bearish?) and overbought/oversold extremes (don’t buy if the trend is overbought, and vice versa). Subscribers receive real-time alerts of model changes, and a hypothetical trading record of the those email alerts are updated weekly here. The hypothetical trading record of the trading model of the real-time alerts that began in March 2016 is shown below.
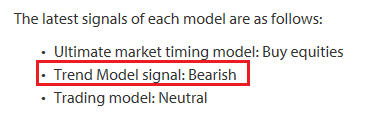
The latest signals of each model are as follows:
- Ultimate market timing model: Buy equities
- Trend Model signal: Bearish
- Trading model: Bearish
Update schedule: I generally update model readings on my site on weekends and tweet mid-week observations at @humblestudent. Subscribers receive real-time alerts of trading model changes, and a hypothetical trading record of the those email alerts is shown here.
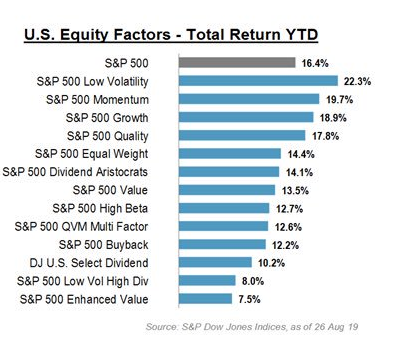
Is value investing back?
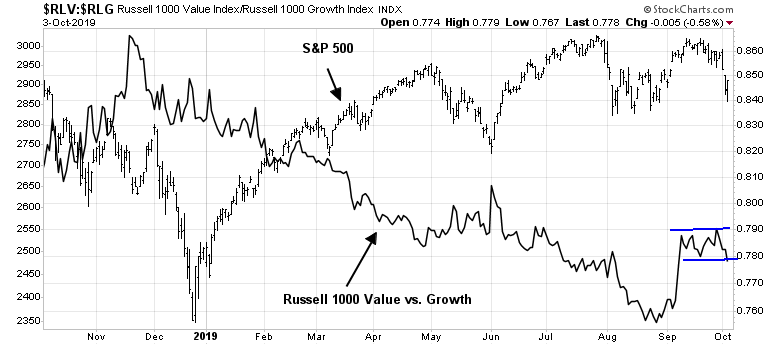
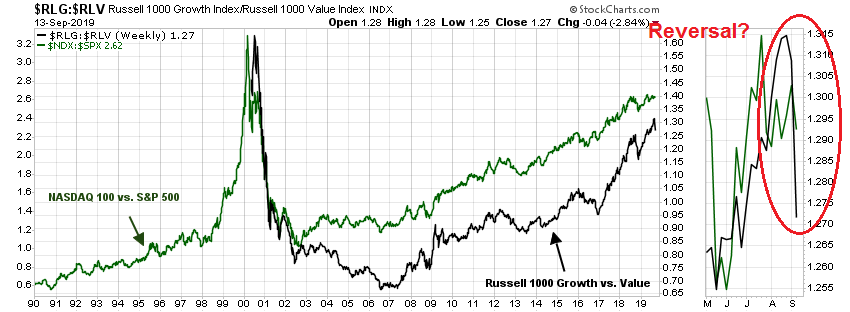
Have some pity on the long suffering value investing. The value style has lagged growth investing for so long that almost a generation of investors have only known about growth and FAANG stocks. The style enjoyed a recent short and short revival. Is this the start of a long awaited reversal?
Let us consider the pros and cons.
I conclude that the jury is still out whether the most recent factor reversal represents a sustainable turnaround for value investors. Tactically, market positioning had reached an extreme, and the value/growth relationship was poised for a rebound. However, it would be highly unusual to see a major leadership change without an important market disruption, such as a bear market.
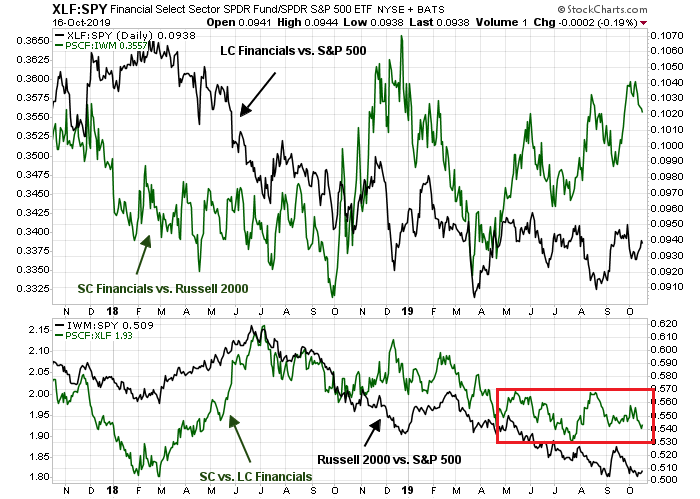
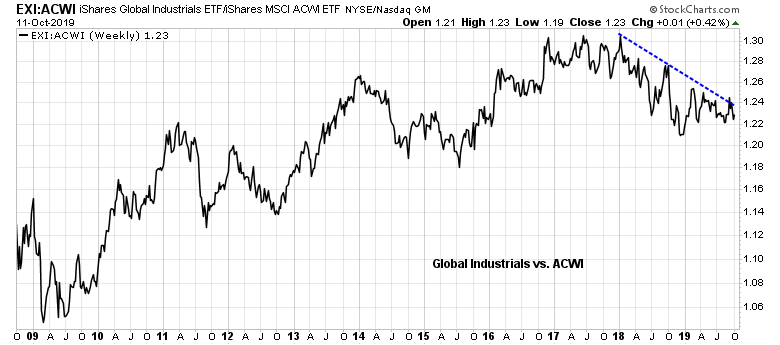
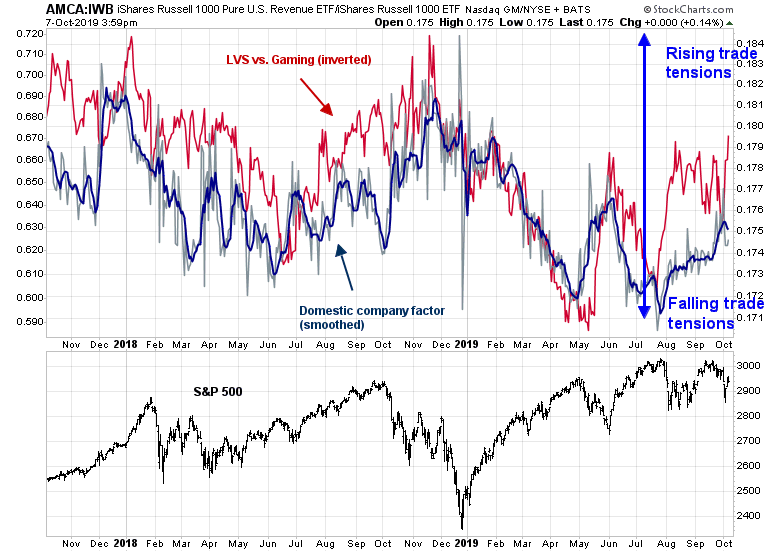
Fundamental analysis leads us to conclude that a value/growth reversal depends on two factors. First, growth stocks have to decelerate, and that is already occurring owing to increased regulatory scrutiny. In addition, value portfolios, which are heavily weighted with bank stocks, need to see the yield curve steepen. Historically, the relative returns of the banking sector have been highly correlated to the shape of the yield curve. The most likely catalyst will be some form of fiscal stimulus that will improve the growth outlook, steepen the yield curve and improve banking profitability.
Ultimately, the more likely timing of a value/growth leadership turnaround will materialize in 2020 or 2021, when the combination of rising regulatory scrutiny of FAANG companies, and a more aggressive fiscal policy combine to raise economic growth expectations, which will create a tailwind for the banking heavy value portfolios.
The technical view
CNBC reported that JPM head quant Marko Kolanovic called the reversal the start of a “once in a decade” trade:
J.P. Morgan’s chief quant says that the big rotation into value names should continue, and that stocks should move higher into October, and beyond, especially if the U.S.-Chinese trade talks go well.
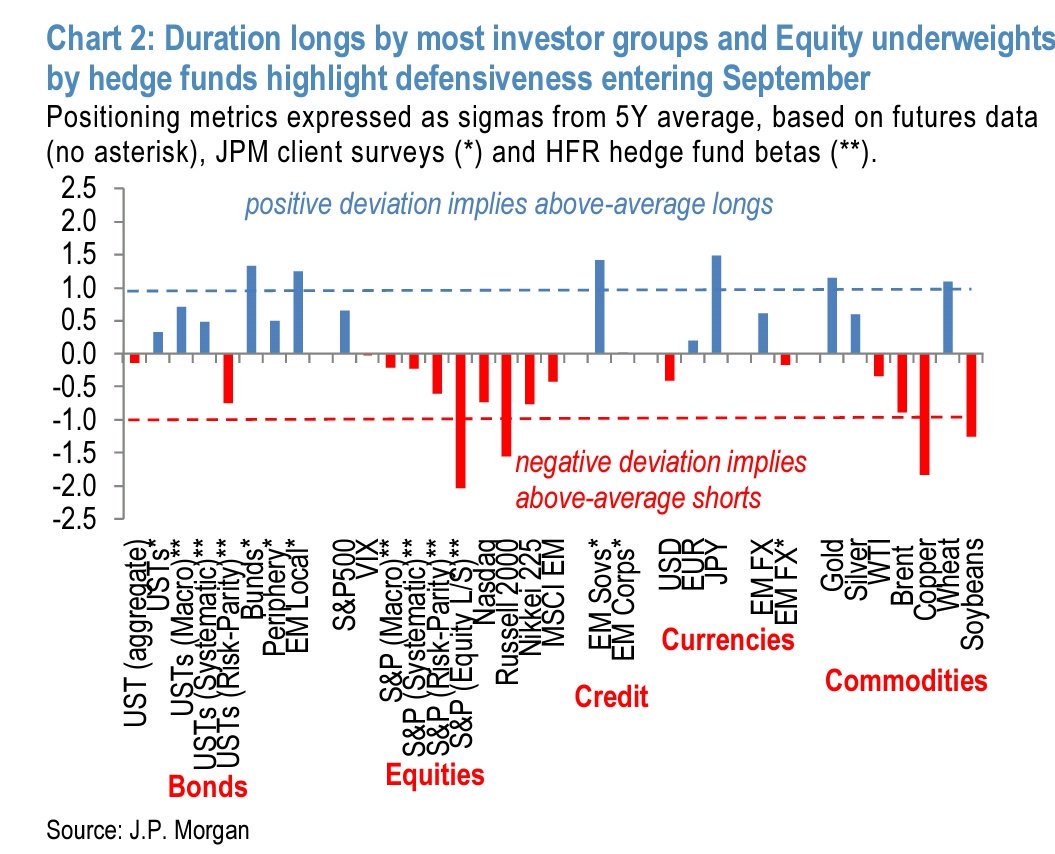
Marko Kolanovic, global head of the macro quantitative and derivatives strategy team at J.P. Morgan, said his view is based on how he sees investor positioning, the underperformance of value names, and the unwind of technical flows last month in equities and bonds, which drove yields fell to extreme lows. The analyst, whose reports have moved the market, says stocks can keep moving higher beyond October, aided by central bank easing and fiscal stimulus.
The set up for the trade into value and out of momentum has been in the making for awhile. The strategist points out, in a note, that the market is virtually flat since January 2018, and most of the S&P 500 gains came from defensive sectors, those with bond-like features and “secular growth” tech names. Many of those are now being sold and “incorrectly in our view, are deemed to be impermeable to economic woes,” he wrote.
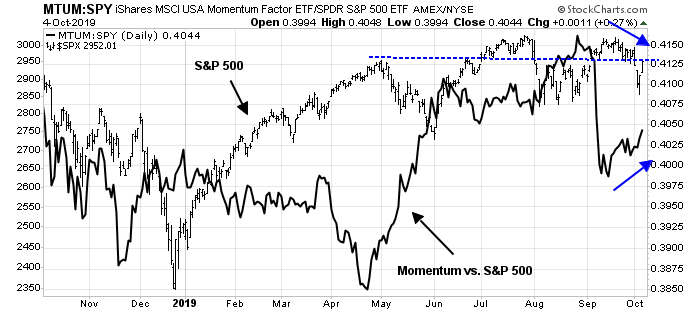
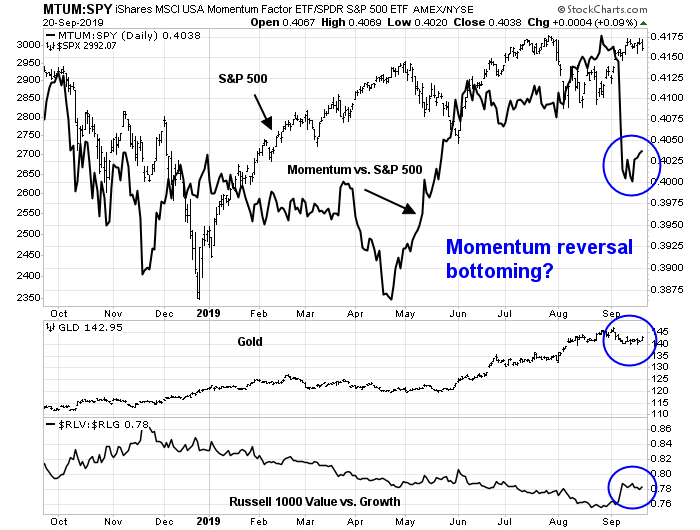
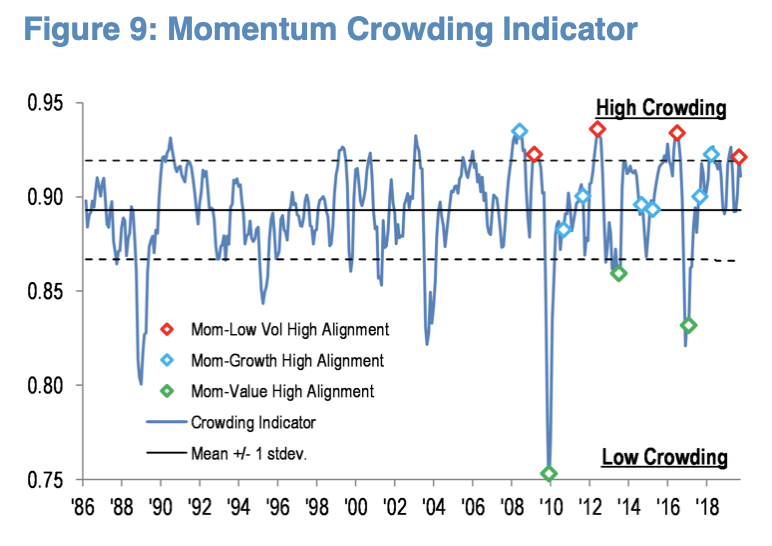
Kolanovic’s analysis is heavy on technical analysis, and market positioning. The price momentum trade had become extremely crowded, and it was due for a reversal.
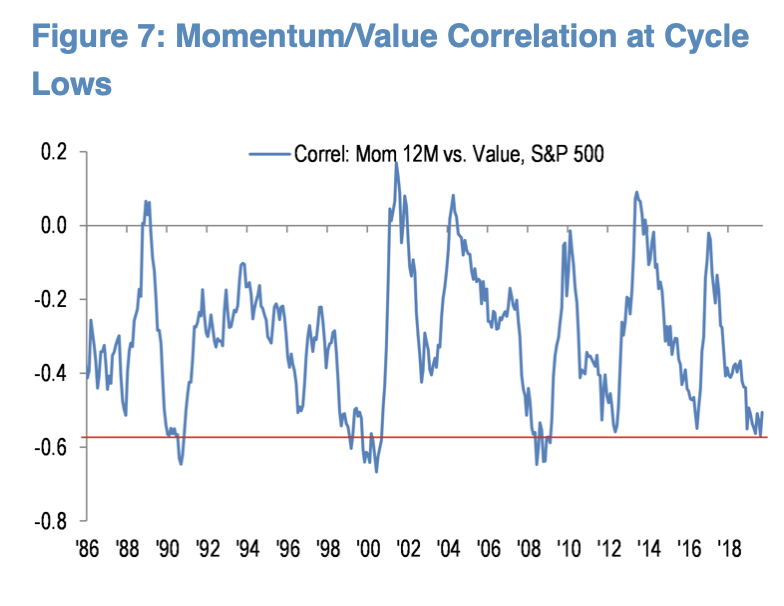
The stampede into momentum had left value stocks out in the cold, and momentum-value correlation had nearing historical lows.
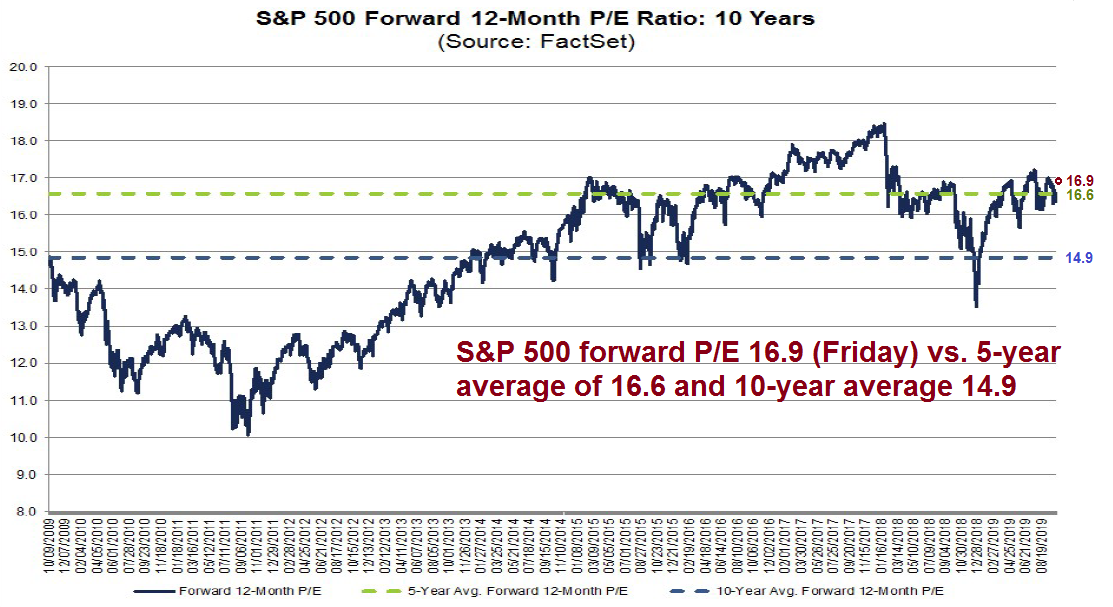
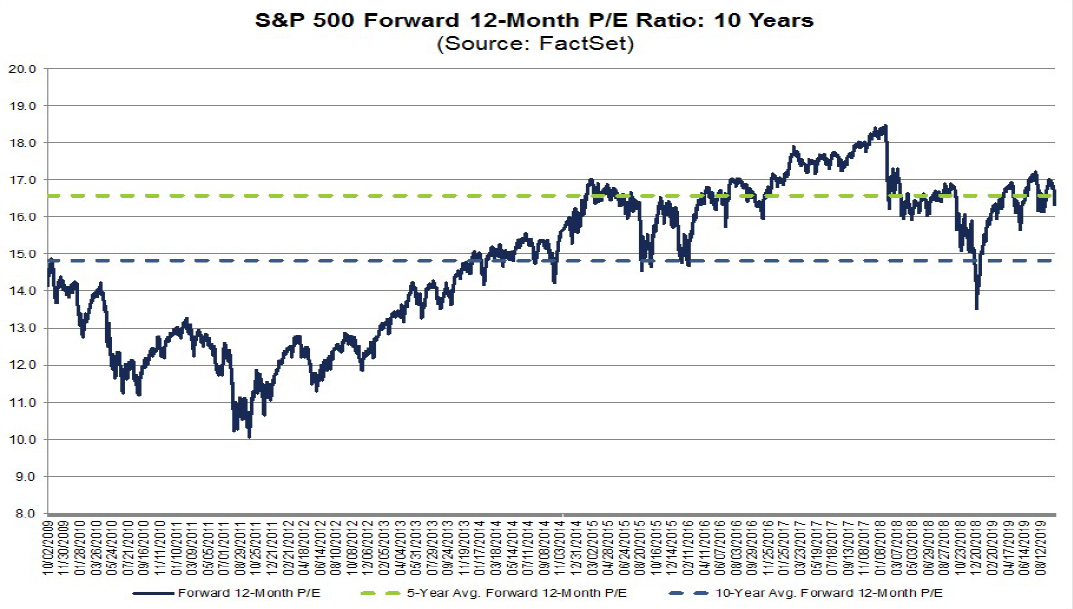
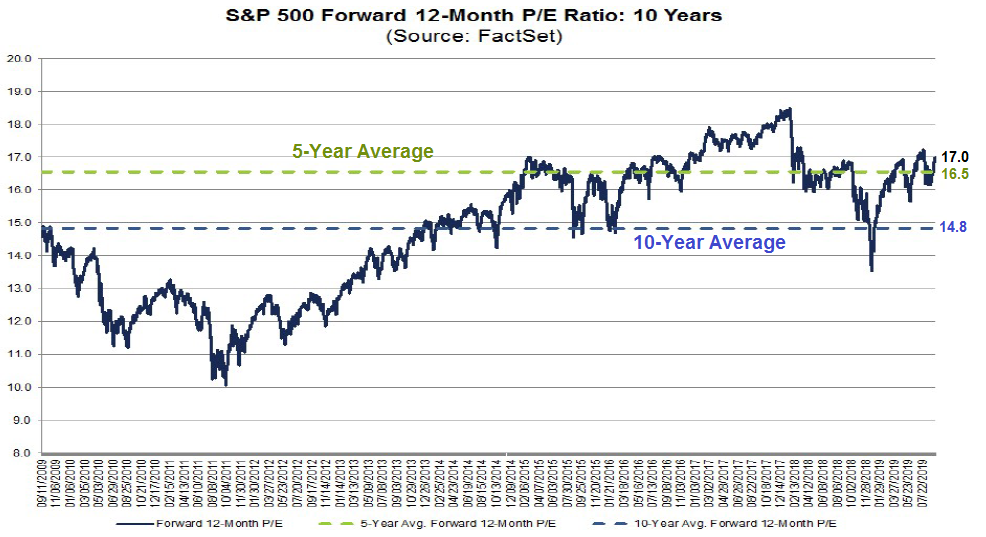
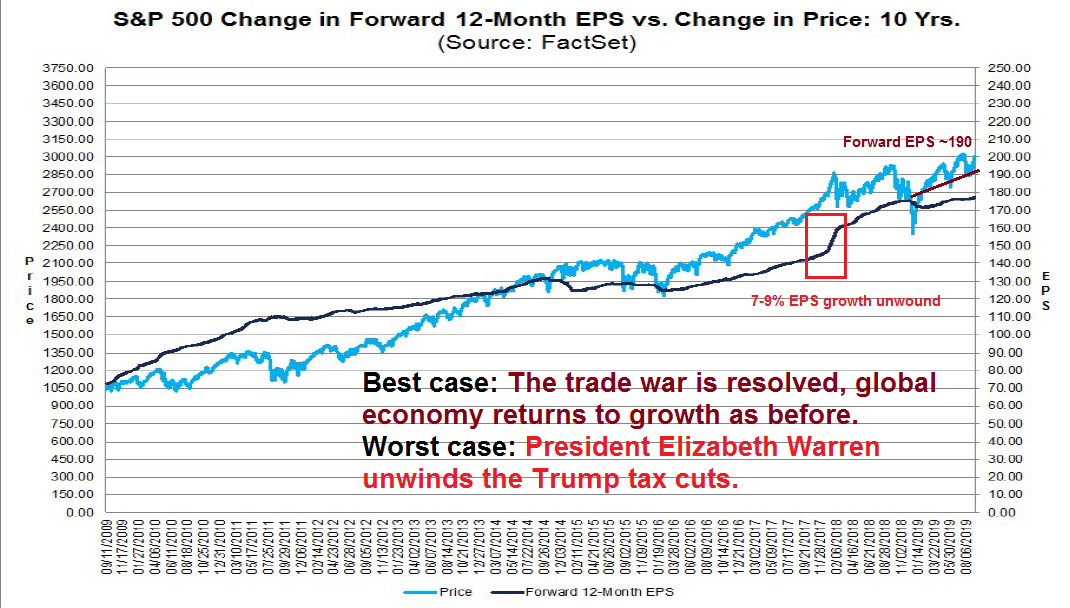
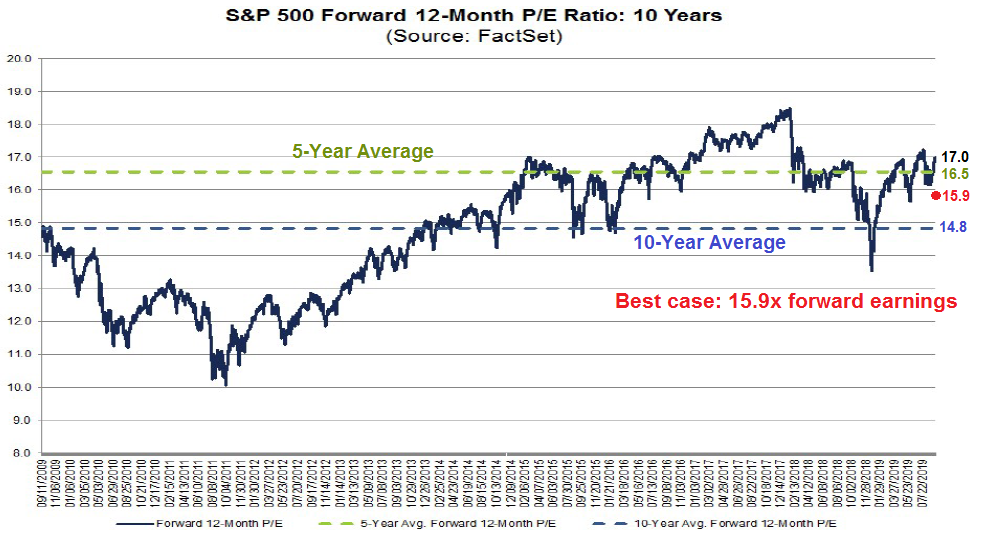
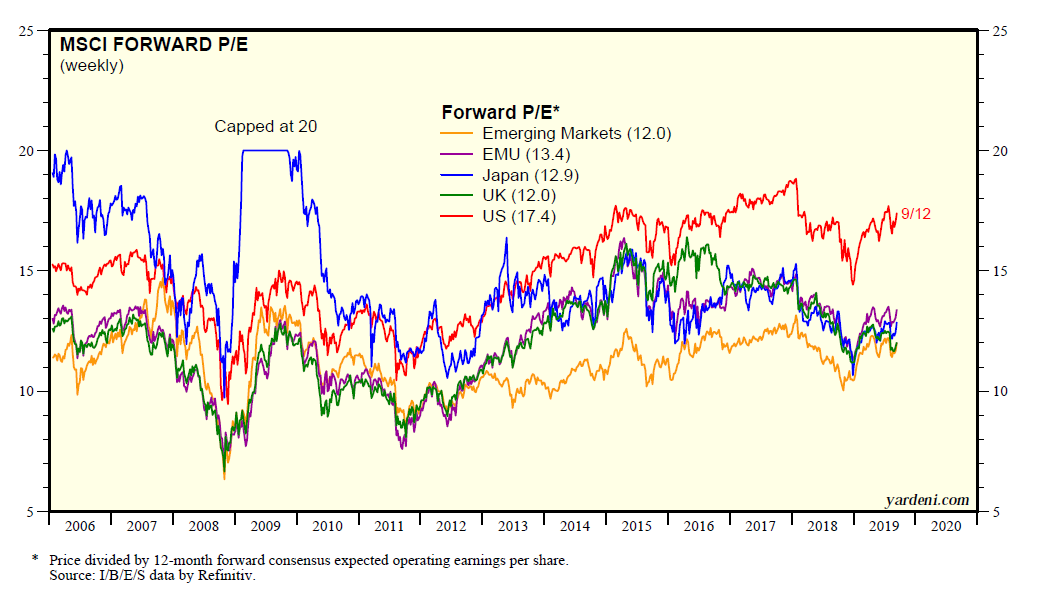
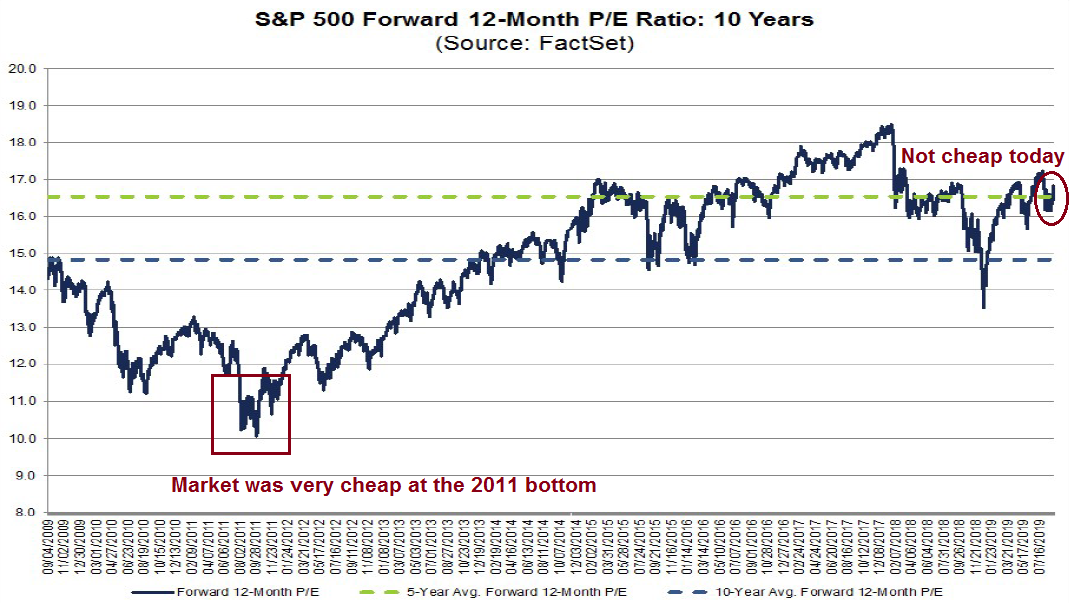
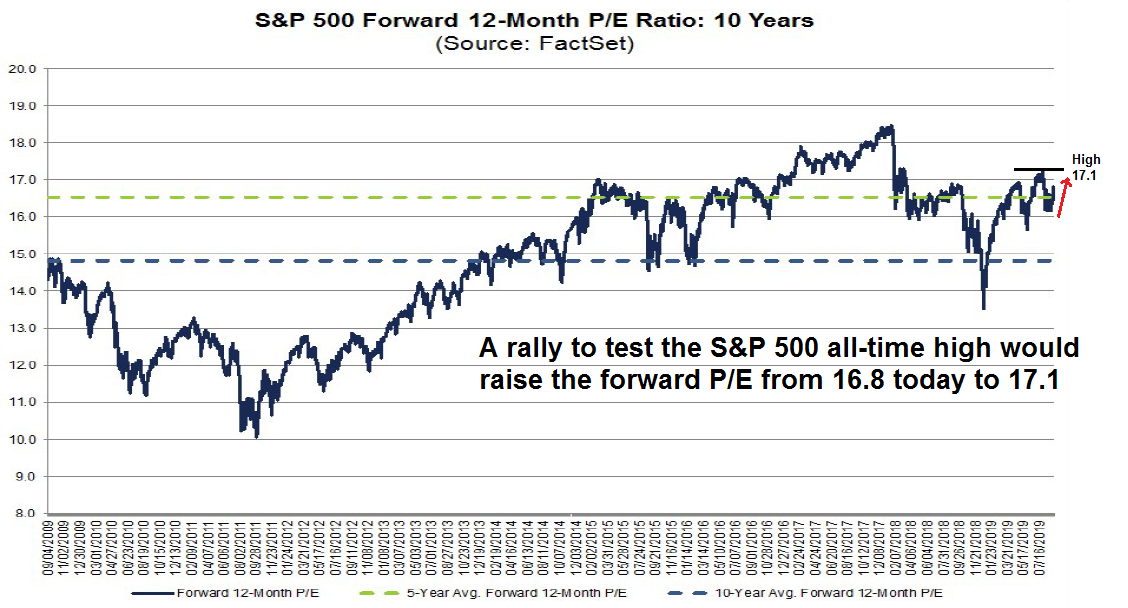
Once the trade began to reverse, it became the signal for the start of a “once in a decade” trade. But we have seen such false starts before, is this reversal another fake-out? Historically, major turning points in market leadership have been marked by bear markets and severe dislocation. Does this mean we are about to undergo a valuation crash in the manner of 2000? Current forward P/E valuation is elevated, but nowhere near the nosebleed levels of the Tech Bubble.
While Kolanovic’s analysis is internally consistent and logical from a tactical perspective, it left me vaguely unsatisfied.
The fundamental view
For another point of view, I offer the analysis of Chris Meredith of O’Shaughnessy Asset Management (OSAM), who penned an extensive white paper on the value-growth cycle. As OSAM is a value manager, the white paper was Meredith’s way of defending the organization’s investing style.
I feel his pain. The life of a portfolio manager has its ups and downs, and over the course of a career, a manager will inevitably have to justify poor performance. In this case, Meredith has the burden of defending a style that has been out of favor for over a decade. The typical level of patience for an individual investor is 6-18 months, and about three years for institutional sponsors. Beyond those time horizons, a manager will start to face an existential crisis as the client base drains away. Even the legendary value manager John Neff had been forced to look for a job at the height of the Nifty Fifty era, just before the growth-at-any-price style crashed.
The white paper was written in a style aimed at an institutional audience, and it was widely publicized. The publicity effort was successful inasmuch as it was the focus of a WSJ article, and a Bloomberg podcast.
Meredith’s analytical framework for the growth/value cycle is based on cycles of technological revolutions and maturity.
Technological Revolutions are clusters of new technologies that cause economic upheaval over periods lasting 45 to 60 years. The cycles start with the discovery of ideas, an installation of infrastructure to make it scalable, followed by a deployment with strong growth that eventually results in maturity, where growth slows down. In her work “Technological Revolutions and Financial Capital” (2002), Carlota Perez identifies the phases of a revolution as two halves: the Installation phase and Deployment phase.
In the Installation phase of a new Technological Revolution, the previous revolution is nearing exhaustion of profitable opportunities. Then, through experimentation new social and economic norms are established for the utilization of ideas. As these concepts take shape and the form factor for utilization is established, people see the potential growth and infrastructure is laid for their widespread adoption. This Installation phase is one of creative destruction, as the new standards replace those from preceding revolutions. It is a period where wealth becomes skewed as innovators are rewarded.
As the new technology shifts to becoming the new norm, the Deployment phase begins. It takes advantage of the infrastructure laid in the Installation phase and expands to broad societal acceptance. This begins with a high growth phase, where real growth occurs, and the technological revolution diffuses across the whole economy. Entrepreneurial activity moves from building infrastructure to the application layer on top. This is a time of creative construction. Winners emerge to form oligopolies, and this growth eventually slows to the Maturity phase, where market growth stagnates.
Meredith referenced the work of Carlota Perez, who identified five growth regimes throughout America’s history, namely the industrial revolution, the age of steam and railways, the age of steel, electricity and heavy engineering, age of oil, automobiles, and mass production, and today’s age of information and communications. Each age is marked by an installation phase, when the growth style is dominant, a turning point, or maturity of the technological revolution, and deployment, when the technology becomes ubiquitous and commonplace, when value investing gains prominence.

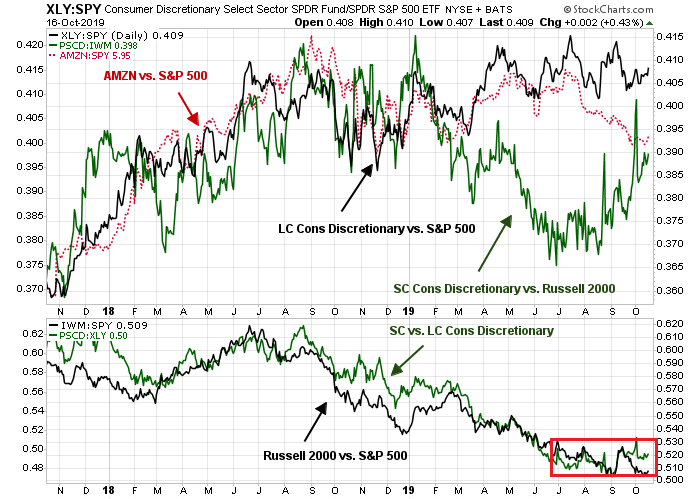
In the Bloomberg podcast, Meredith cited the example of Amazon. The stock may have looked expensive on a valuation basis 10 years ago. Historically, value investing works because growth stocks disappoint their lofty market expectations. In this case, Amazon managed to fulfill projected growth, and if you had known that it was trading at 4 times 10-year forward earnings, it would have seemed cheap then. Today, the FAANG stocks are now at or near an inflection point because of heavy regulatory scrutiny.
One key pivoting point in any technology is when the standards is set for how the technology will be deployed across society. In the case of technology, one could argue that the introduction of the smartphone disrupted the consumption patterns of information, and we are still figuring out the matching of platform to consumption. The societal habits for whether people will use their desktop, laptop, gaming console, smart speaker, tablet or phone for communicating, shopping, gaming, and business productivity. But with the smartphone adoption curve shown before, the platform is established for delivery of information to anyone anywhere, and with embedded cookies, canvas fingerprinting, and geolocational tracking, the delivery of information on everyone to anyone.
Another key sign in standards being set are the formation of oligopolies and monopolies. For every one of the previous technological revolutions, there have been winners that have established the standards accumulated market share and became synonymous with the technology itself. The chart below shows the shift in the market leadership over the last twelve years, with the Age of Technology forming oligopolies through the FAANG stocks.
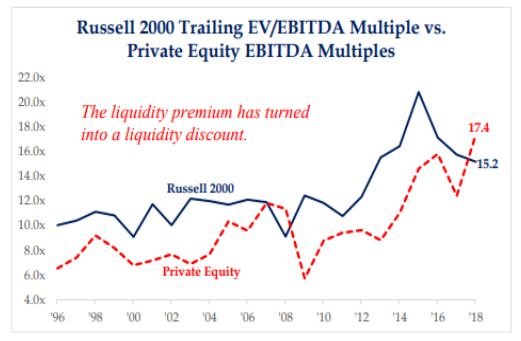
It should be mentioned that because these oligopolies are so large, one would suspect that they can’t get bigger. Amazon’s market share is 49% of online retail and 5% of total retail. While it’s one of the largest companies in the world, there’s still potential to grow. Sears didn’t grow to become 1% of GDP until the 1950s, well into the Deployment of the cycle. General Motors and Sears were the top two contributors to the Growth Portfolio25 during the synergy phase of 1942-1959, but the Value portfolio outperformed during the creative construction of deployment, where the overall economy grew and the value cycle of stocks being overly discounted and rerated was the norm.
One should not underestimate the role of regulation in how the Age of Technology plays out. The recent Senate hearings on Facebook highlight that privacy rights are far from established and could create structural issues for technology companies. Additionally, anti-trust legislation always rears its head as near monopolies exert power.
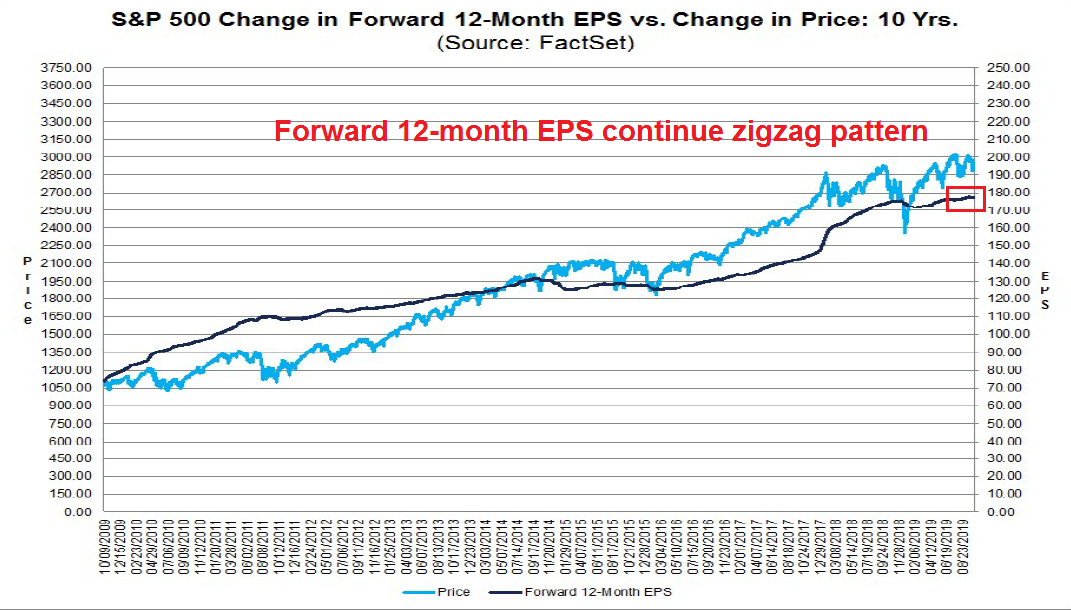
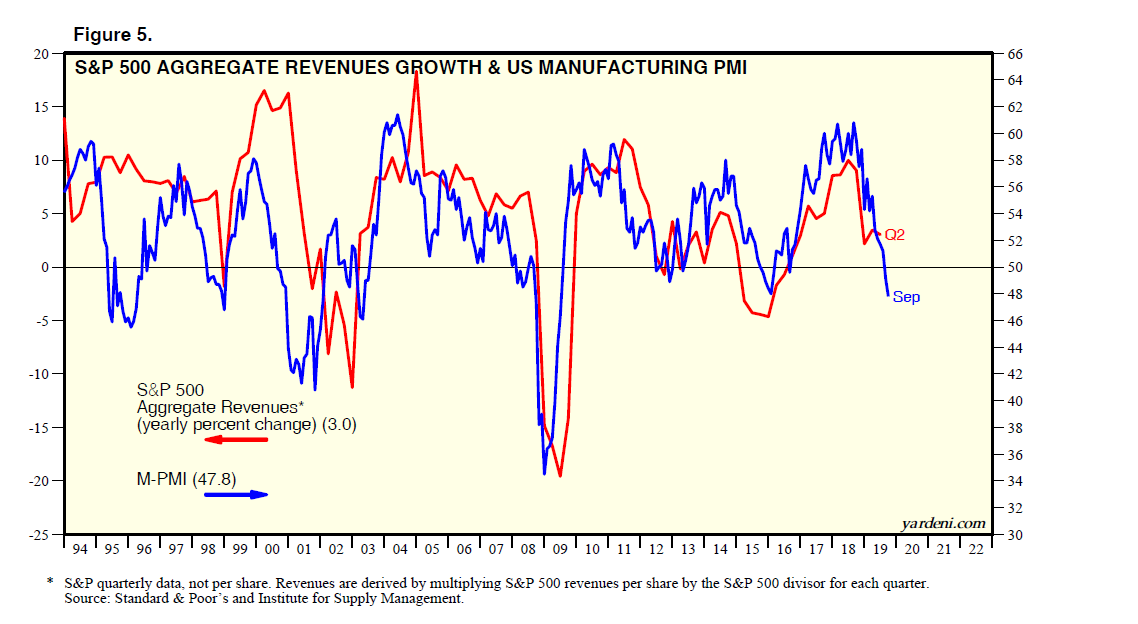
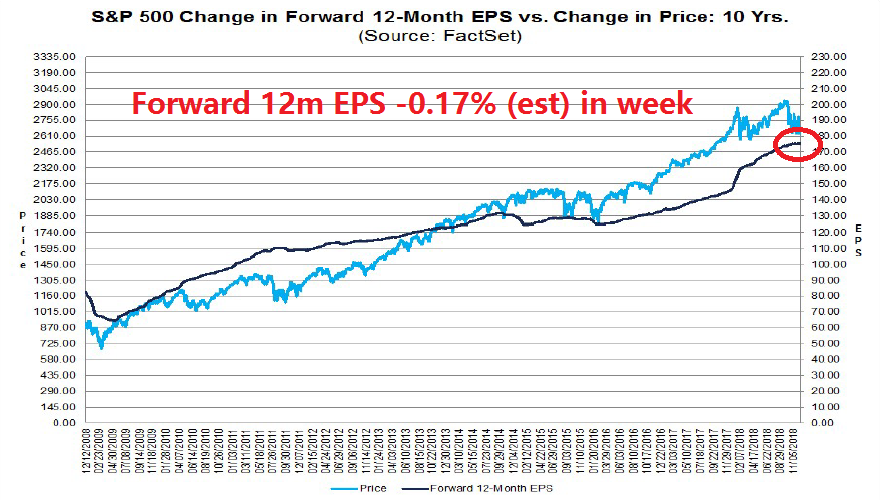
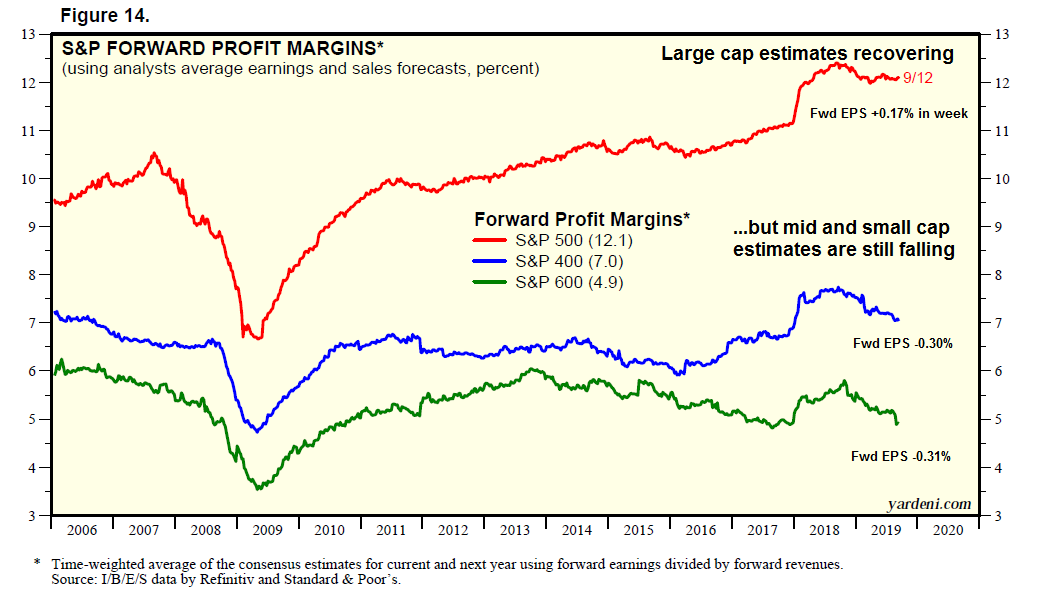
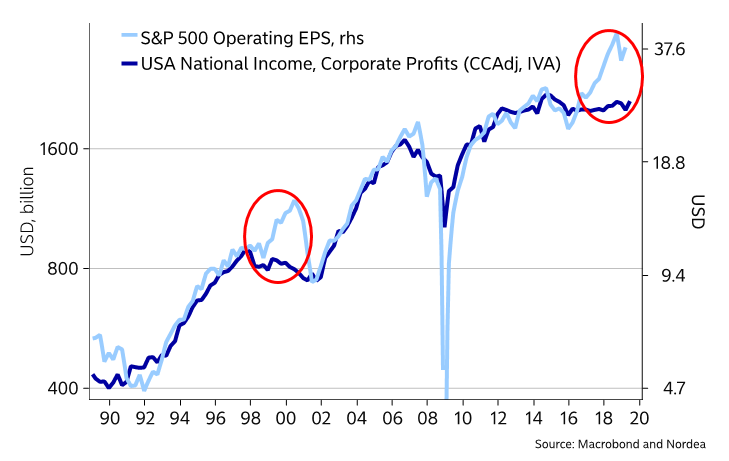
Further support of the turning point thesis came from Nordea Markets, which pointed out that there is a severe divergence between S&P 500 earnings, which does not represent the US economy, and NIPA profits,which does. This analysis does lend some credence to the idea of a Tech Bubble style valuation crash, in the manner of 2000-02, which is a major sign of market leadership change.
How does value revive?
The analysis from OSAM also left me slightly uncomfortable. While the white paper was highly comprehensive, and a masterful display of skilled quantitative analysis and undoubtedly helped to retain some OSAM assets, the main focus was a negative rather than a positive. The report concentrated on the dynamics of growth and when growth underperformed. Value beat growth when growth fails. But how do you justify value investing? Where is the positive catalyst, other than the sunset of growth industries?
To be sure, Meredith did explain that value and growth investing depend on investor expectations, and how those expectations are realized. One example was Seagate Technology as a value stock:
Value investing generates excess return by an over-discounting of future earnings relative to trailing earnings. But it requires a stabilization and recovery, alongside a rerating of valuations to the new expectations. A good example is Seagate Technology, which a number of short-sellers openly bet against in 2013. The investment thesis was that the PC market was declining with the advent of mobile computing and cloud computing, hard disk drives would be in structural decline. What wasn’t accounted for was that hard disk drives were still the best solution for large scale data centers, so demand would not decline as far as predicted. The stock began 2013 with a P/E around 4x, and price went on to more than double over the next two years through a rerating back to a P/E of 14×17. Seagate’s story is not yet complete, but those two years squeezed the short-seller while the Value investor was rewarded.
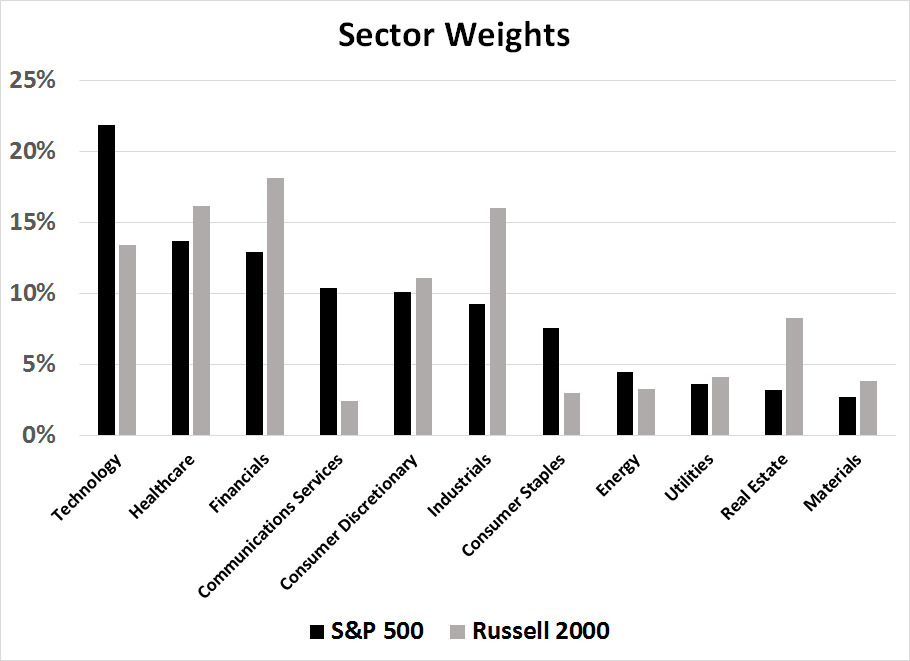
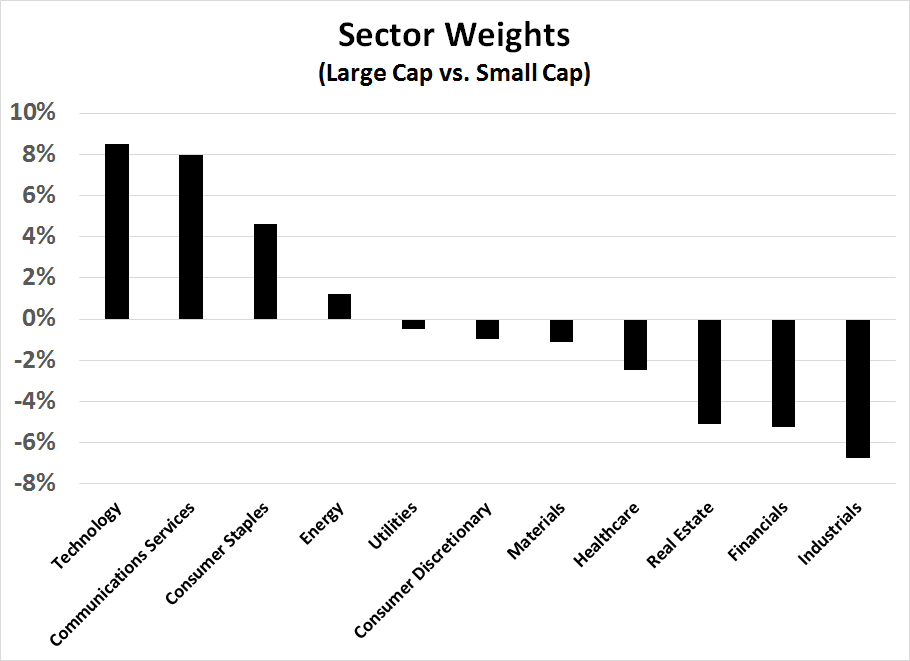
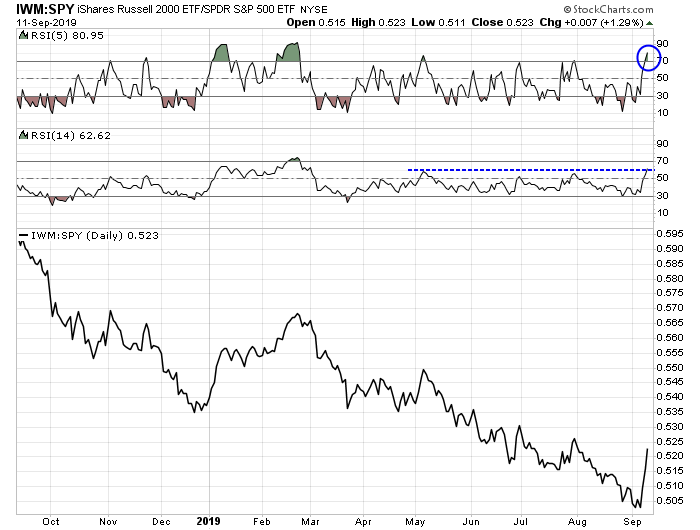
One clue came from the accompanying WSJ article which observed that value portfolios are heavily weighted in banking.
From 1926 to the war, the cheap value portfolio is crammed with utilities, the stocks that had led the electrification revolution but had become mature and dull. The go-go growth stocks were in manufacturing, with few of them cheap enough for value buyers to pick.
There is a similar industry bias today: value has heavy exposure to banks and other financial stocks, which helped it outperform before the crisis but dragged it down since. This time, the go-go growth stocks are mostly in the technology sector (although Amazon is a retailer), where value has little exposure.
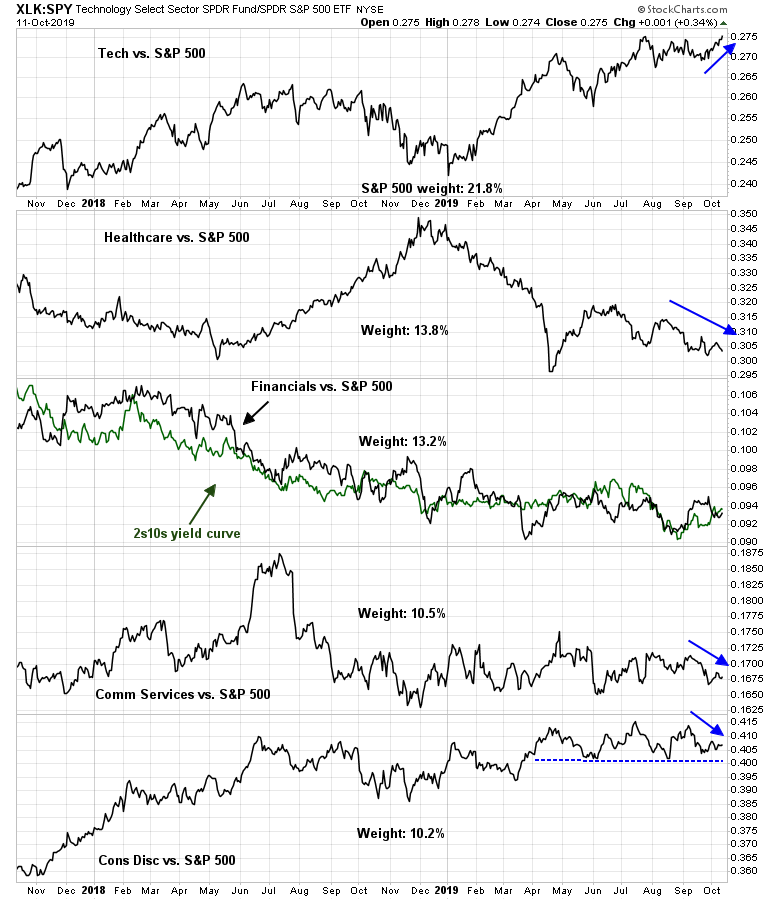
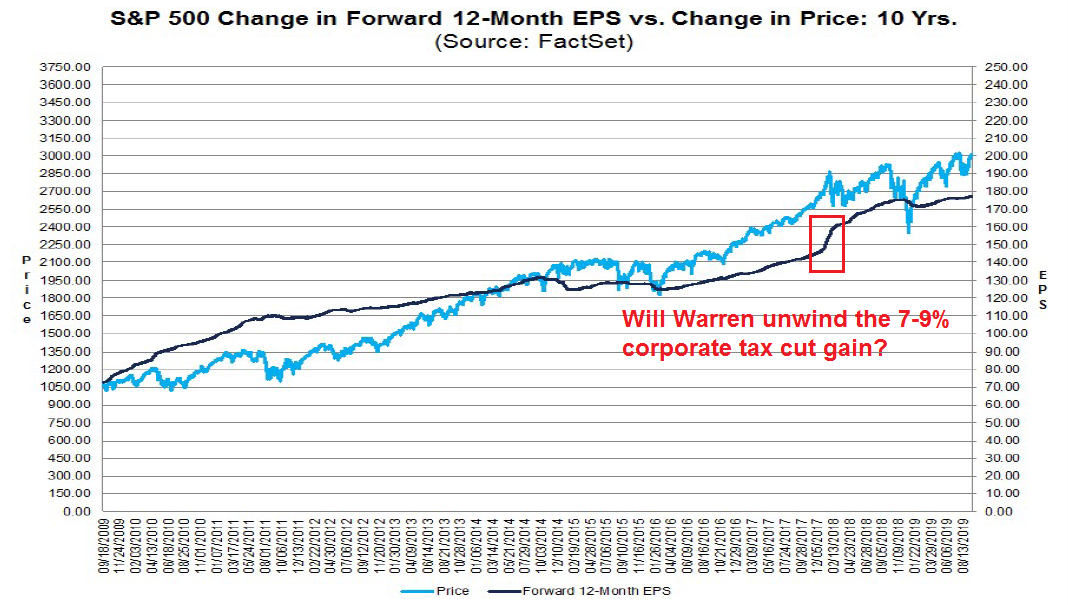
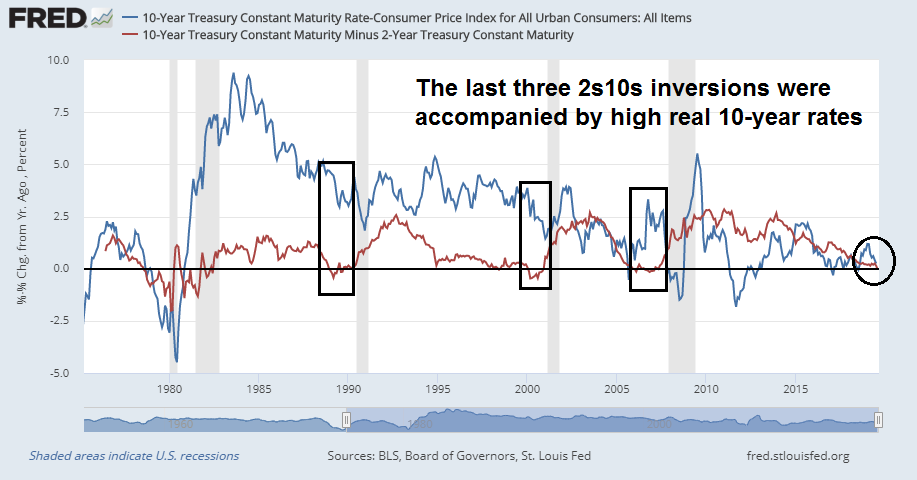
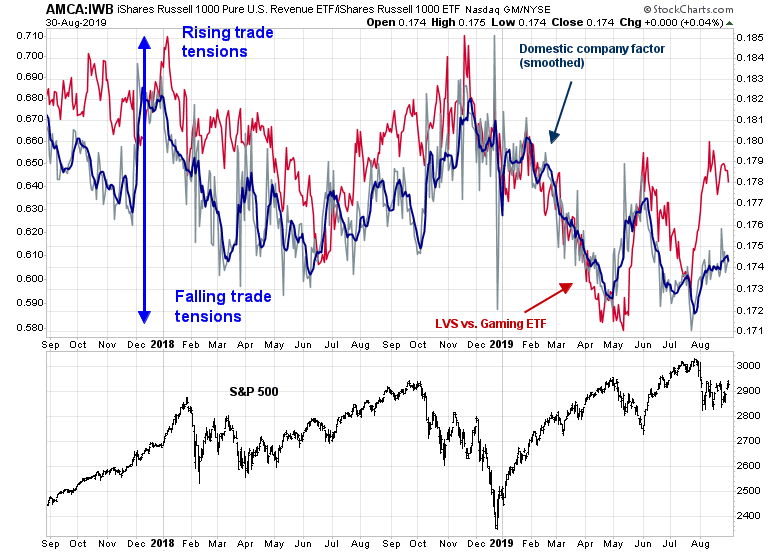
A light went on. The relative performance of bank stocks has historically been correlated with the shape of the 2s10s yield curve. One explanation is the tendency of banks to borrow short and lend long, and a steep yield curve provides a headwind for banking profitability. The one glaring divergence occurred in late 2017, when the bank stocks rallied in response to the tax bill.
Policy dependence
I conclude from this analysis that a shift in the value/growth relationship is dependent on changes in policy. Growth stocks are beginning to face headwinds from increased regulatory scrutiny. Increased attention from regulators will not be enough to tank growth stocks. Microsoft became a market performer in the next decade after the Justice Department filed the United States v. Microsoft case, but the stock did not underperform.
The other catalyst is on the value side. In order for the bank heavy value portfolio to outperform, policy makers will have to steepen the yield curve on a sustainable basis. That means raising market expectations of future growth.
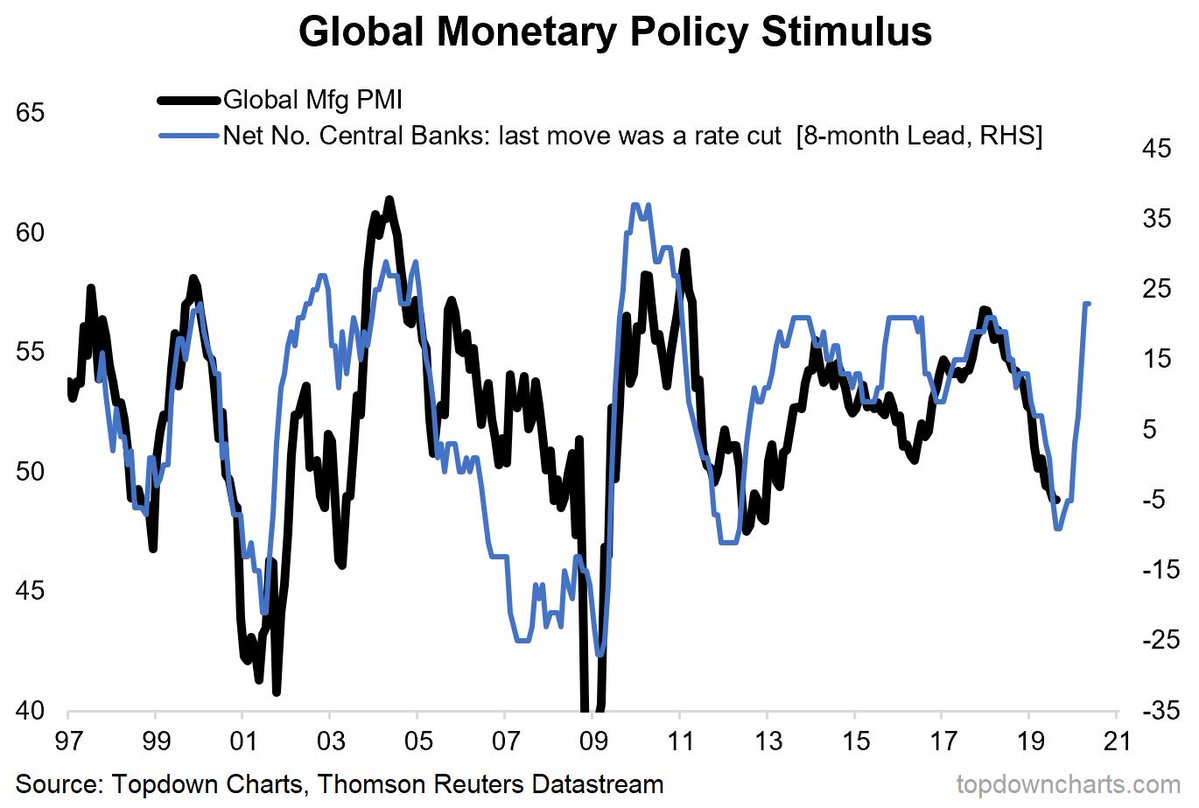
Let us start with monetary policy. There was a lot of hand wringing at the latest Jackson Hole meeting about what to do at the next economic downturn. Central bankers were running out of bullets, and it was evident that they were at a loss. The proposed strategy could be broadly categorized as go it alone, or coordination with fiscal authorities, otherwise known as some form of “helicopter money”.
The go it alone strategies were mainly a combination of negative interest rates (NIRP) and more quantitative easing. NIRP has two drawbacks. First, it devastates banking system profitability, as demonstrated in Europe. As well, it faces the implementation difficulty of how to keep individuals from holding the money in cash if rates are negative? Some economists, such as the formerly nominated Fed governor Marvin Goodfriend, proposed the Fed levy charges for physical currency. There have been a recent flood of papers of why NIRP may not be a good idea.
It had to happen sooner or later. Three prominent former central bankers (Stanley Fischer, Jean Boivin, and Philippe Hildebrande) have proposed the direct monetary financing by CB of fiscal stimulus packages, which is goes beyond Bernanke’s helicopter money 2004 proposal.
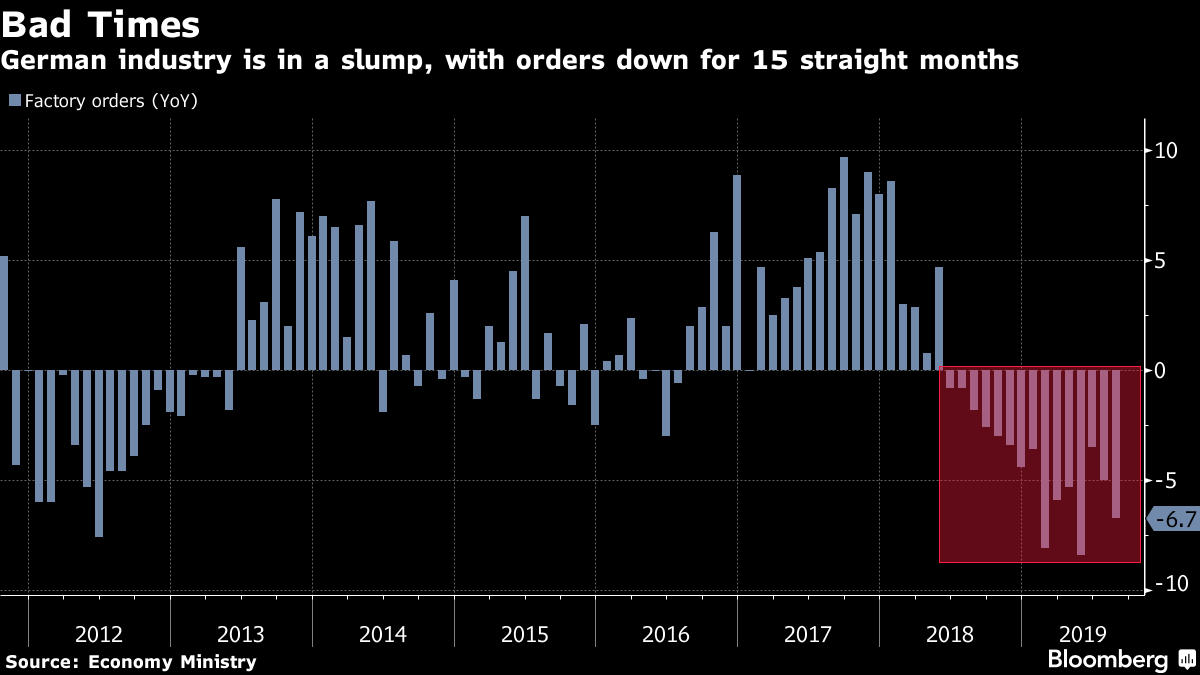
Simply put, monetary policy is nearing its limits. It is time for fiscal policy to do the heavy lifting. Reuters reported that Germany is considering a workaround fiscal stimulus program to get around its “fiscal break” spending rules:
Germany is considering setting up independent public agencies that could take on new debt to invest in the country’s flagging economy, without falling foul of strict national spending rules, three people familiar with talks about the plan told Reuters.
The creation of new investment agencies would let Germany take advantage of historically low borrowing costs to spend more on infrastructure and climate protection, over and above debt limits enshrined in the constitution, the sources said.
Germany’s debt brake allows a federal budget deficit of up to 0.35% of gross domestic product (GDP). That’s equivalent to about 12 billion euros ($13.3 billion) a year but once factors such as growth rates have been taken into account, Berlin only has the scope to increase new debt by 5 billion next year.
Europe’s largest economy is teetering on the brink of recession and pent-up demand for public investment from towns and cities across the country is estimated at 138 billion euros by state-owned development bank KfW.
Under the “shadow budget” plan being considered by government officials, new debt taken on by the public investment agencies would not be accounted for under the federal budget, said the sources, who declined to be named.
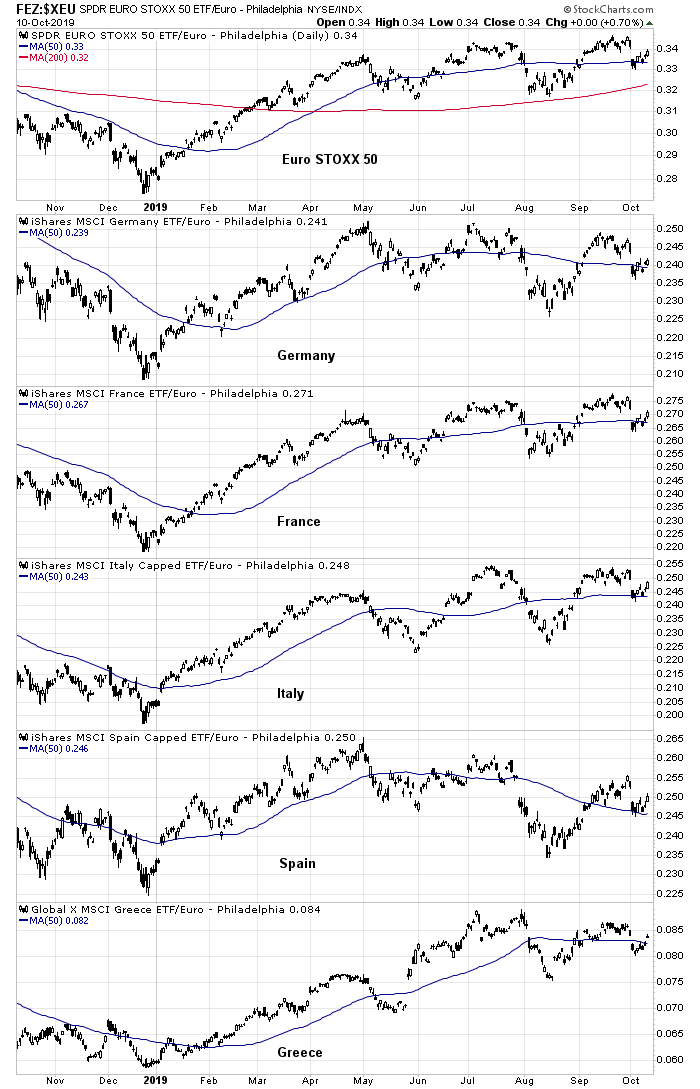
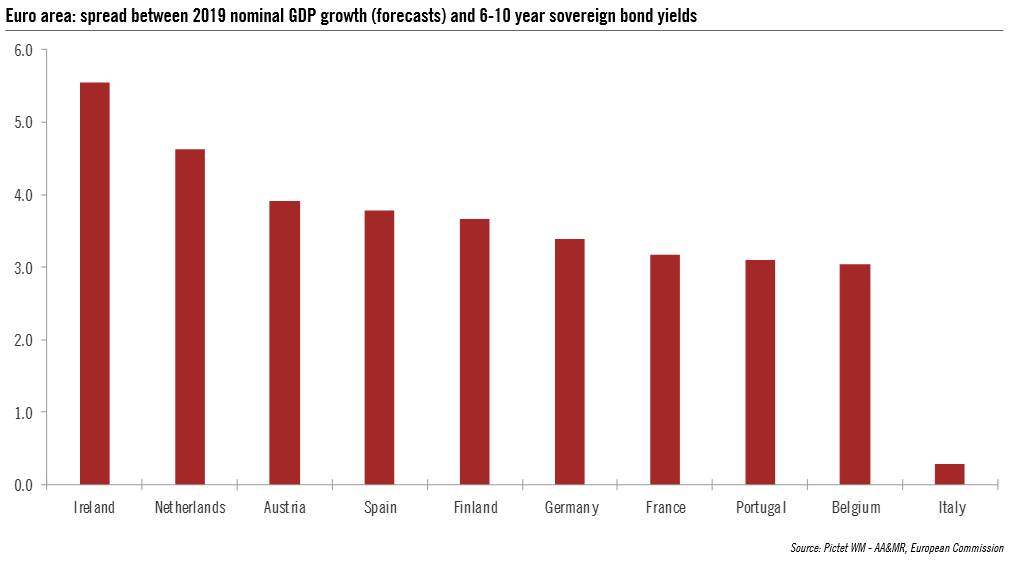
There are other signs of movement on the fiscal front in Europe. The FT reported that the European Commission is scheduled on November 1 to consider a simplification of its budget rules, and revisions to its Stability and Growth Pact. Indeed, bond yields in Europe have already begun to react in anticipation of the shift from monetary to fiscal stimulus.
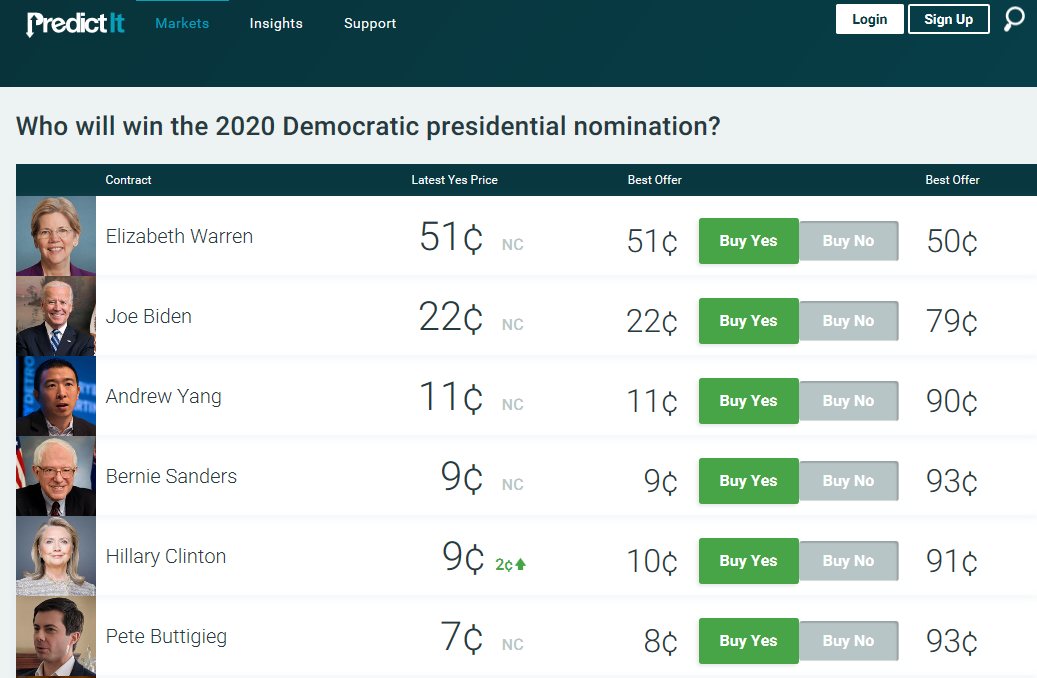
In the US, Moody’s found that the effects of fiscal stimulus is fading. Expect another round of fiscal prime pumping after the election, regardless of who wins the White House. If Trump wins, it will mean another round of tax cuts.
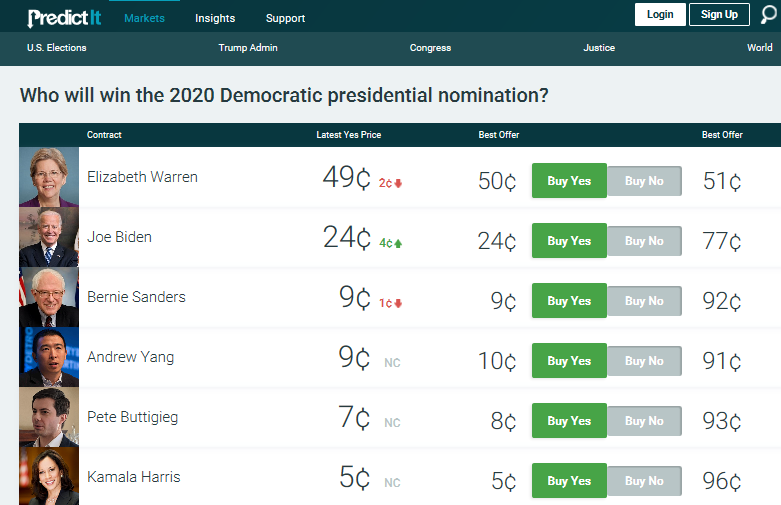
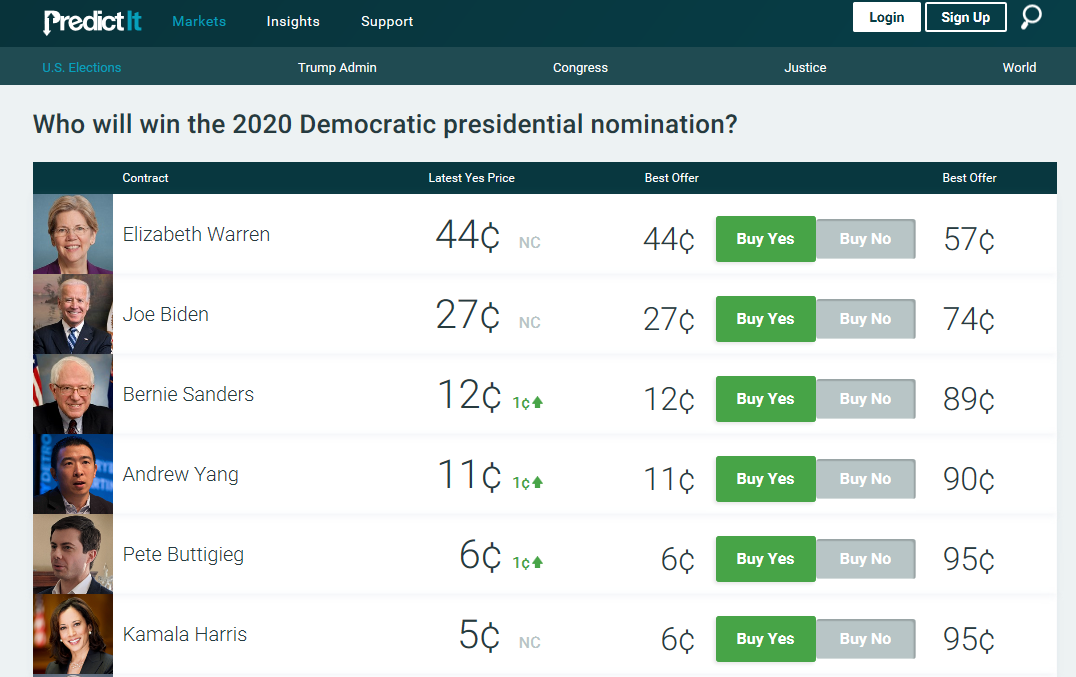
If a Democrat wins, look for more spending on healthcare and social programs, and the ascendancy of Modern Monetary Theory (MMT), which states that a sovereign country that issues debt in its own currency is only limited in its spending by what the bond market will dictate.
There have been some discussions of how much fiscal room the budget has. Philip Pilkington estimated how much larger the Federal deficit could be before inflation began to accelerate and set off an inflationary spiral, and he concluded that the fiscal deficit could rise by roughly another 5%.
I find that we could probably safely increase the current US fiscal deficit by around 5% of GDP structurally — that is, from the current level of around 3.8% of GDP to around 8.8%. This would give rise to annual real GDP growth of around 6% and a once-off shot of inflation that would drive the annual growth in CPI to around 4.9%. As I say in the paper, this would then lower the private debt-to-GDP ratio from around 200% of GDP to around 190%.
Douglas Elmendorf and Don Price of the Harvard Kennedy School wrote an op-ed in the Washington Post which made the case that there is plenty of fiscal capacity to deal with a recession.
Suppose the economy goes into recession sometime in the next year and that the Federal Reserve lowers the federal funds rate to essentially zero, as it did between December 2008 and November 2015. Now suppose that Congress and the president agree on a collection of spending increases and tax cuts twice as large as the 2009 American Recovery and Reinvestment Act. The Congressional Budget Office estimated that the recovery act increased federal spending and reduced taxes by a combined total of roughly $850 billion, so a stimulus that was twice as large would have a direct budgetary impact of about $1.7 trillion. (If an earlier Congress and president had agreed to follow the 2009 act with an additional stimulus bill of comparable size in 2011, we would have enjoyed a faster economic recovery with more job creation, and the country would be better off.)
Such fiscal stimulus would boost GDP significantly relative to what it would be otherwise: The recession would be less deep, less lengthy or both. As a result, fewer people would lose their jobs than if the stimulus did not occur, and people who did lose jobs would find new jobs more quickly. Fewer families would be evicted from their homes or be unable to pay their medical bills, and fewer graduates who enter the labor market would suffer a recession penalty in their future earnings.
Based on a large amount of economic research over the past decade, a reasonable estimate is that fiscal stimulus of $1.7 trillion under the conditions described — in particular, with the federal funds rate at zero — would increase GDP over the following few years by roughly 1½ times as much, or about $2.5 trillion. Higher GDP means higher taxable incomes, so the federal government would recoup about $0.6 trillion of the gross budgetary cost of the stimulus, leaving a net budgetary cost of roughly $1.1 trillion.
In conclusion, the jury is still out on whether the most recent factor reversal represents a sustainable turnaround for value investors. JPM’s Marko Kolanovic analysis is highly tactical in nature. While he does make a good case that market positioning had reached an extreme, the fundamental and macro underpinnings of a reversal are not present. In particular, it would be highly unusual to see a major leadership change without an important market disruption, such as a bear market.
The analysis from Chris Meredith of OSAM leads me to conclude that a value/growth reversal depends on two factors. First, growth stocks have to decelerate, and that is already occurring owing to increased regulatory scrutiny. In addition, value portfolios, which are heavily weighted with bank stocks, need to see the yield curve steepen. Historically, the relative returns of the banking sector has been highly correlated to the shape of the yield curve. The most likely catalyst will be some form of fiscal stimulus that will improve the growth outlook, steepen the yield curve, and improve banking profitability.
Ultimately, the more likely timing of a value/growth leadership turnaround will materialize in 2020 or 2021, when the combination of rising regulatory scrutiny of FAANG companies, and a more aggressive fiscal policy combine to raise economic growth expectations, which will create a tailwind for the banking heavy value portfolios.
The week ahead
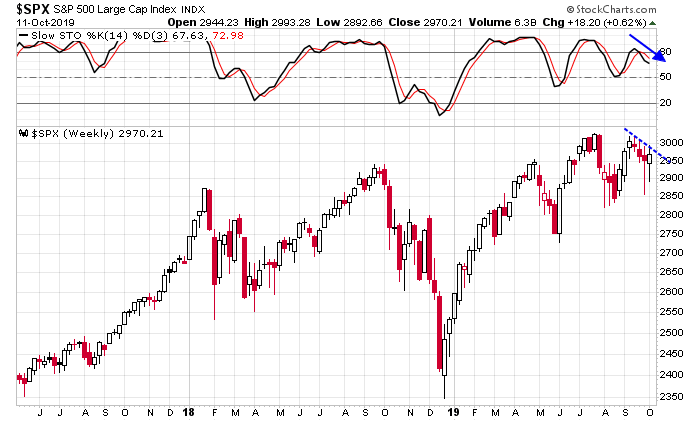
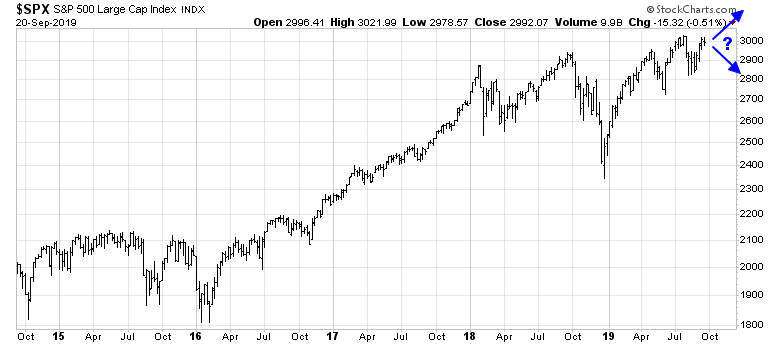
Looking to the week ahead, the market is facing a number of mixed signals. While the signals are somewhat contradictory, the weight of the evidence suggests that the advance is stalling.
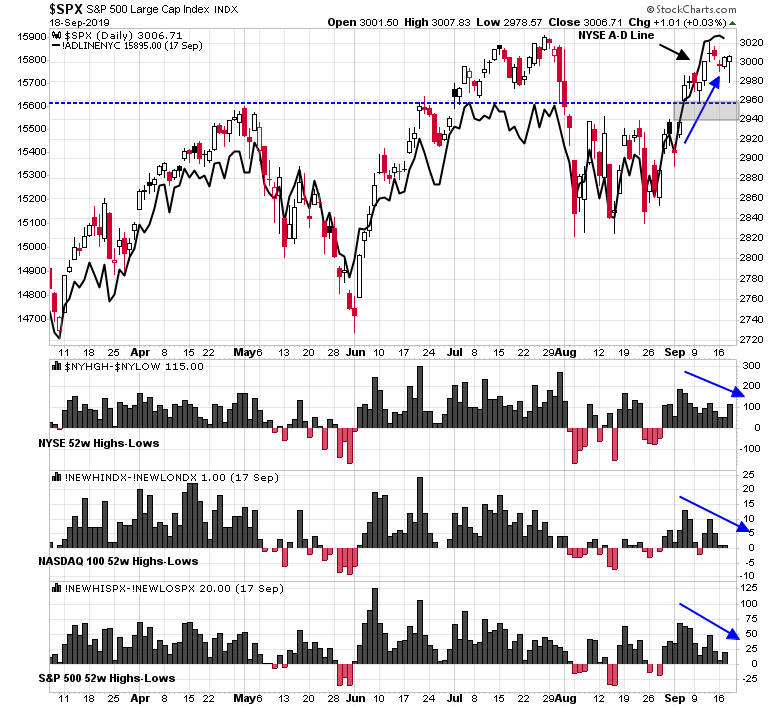
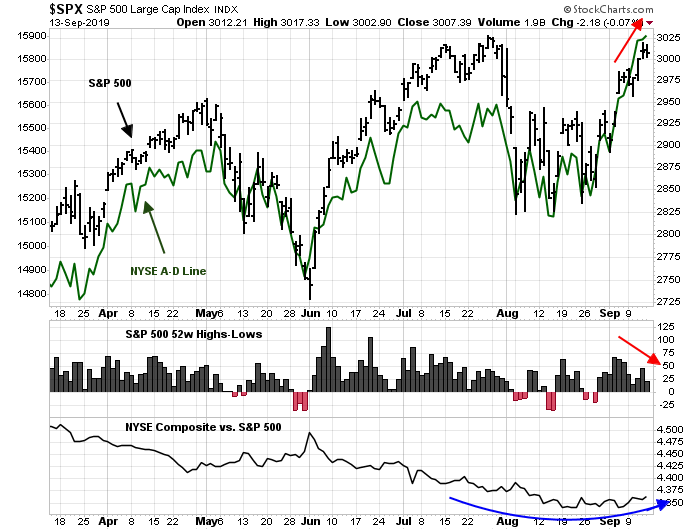
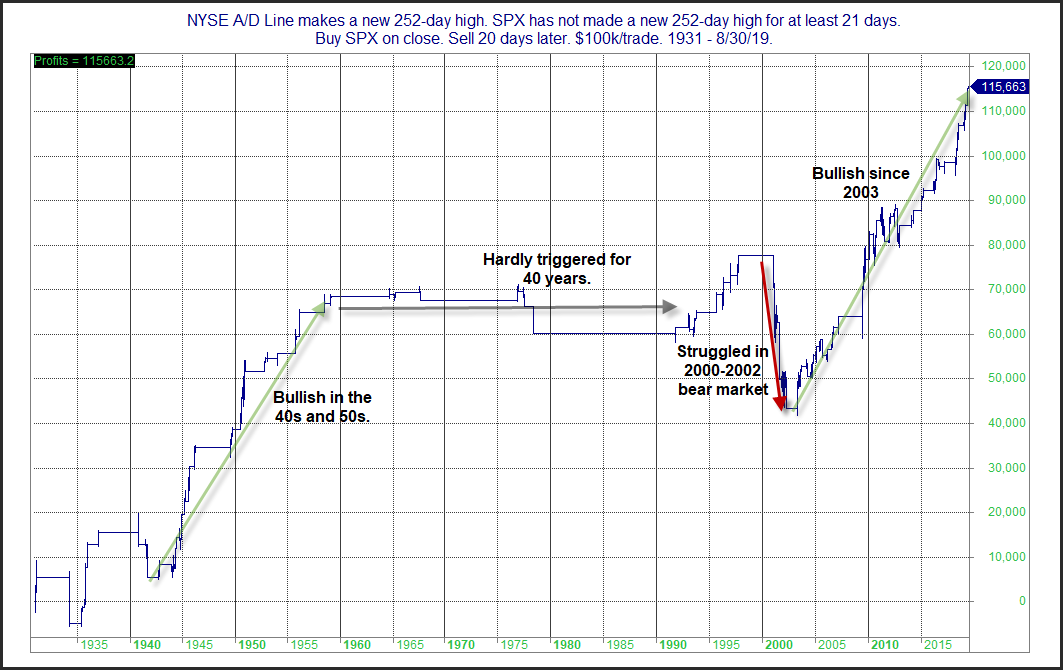
Which breadth indicator should you believe? On one hand, the NYSE Advance-Decline Line (green line) has risen to new all-time highs. On the other hand, net highs-lows (middle panel) are tracing out a declining pattern even as the S&P 500 rose.
Under these circumstances, I prefer to use a close apples-to-apples comparison of market internals, which is the S&P 500 net highs-lows, because they are using the same underlying stock components. As the bottom panel shows, the NYSE Composite had been underperforming the S&P 500 for several months, until it began to bottom out and turn up in September. The differences between the two indices could lead to distortions in the NYSE A-D Line.
I am keeping an open mind, and the A-D Line signal should not be dismissed out of hand. Rob Hanna at Quantifiable Edges studied the market’s behavior when the NYSE A-D Line made a fresh high while the S&P 500 did not. The results were unabashedly bullish – but there’s a catch. The history of this signal has been very bullish since 2003, but Hanna characterized the experience prior to that was “streaky and unreliable”.
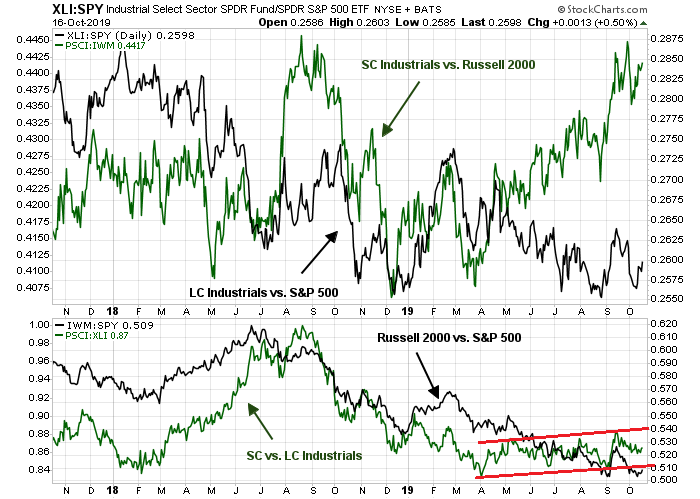
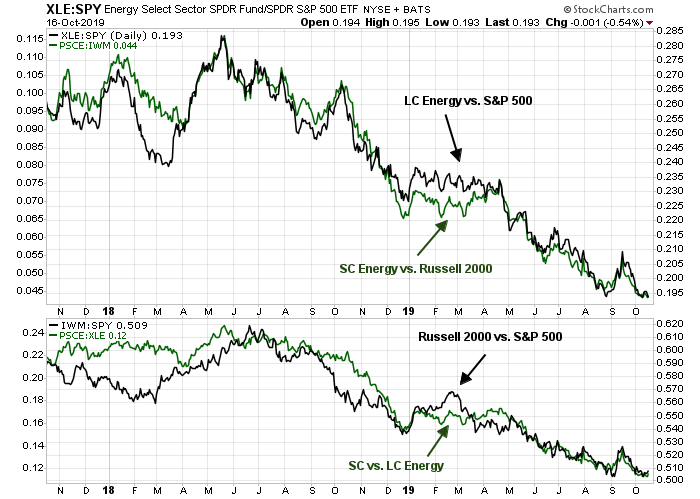
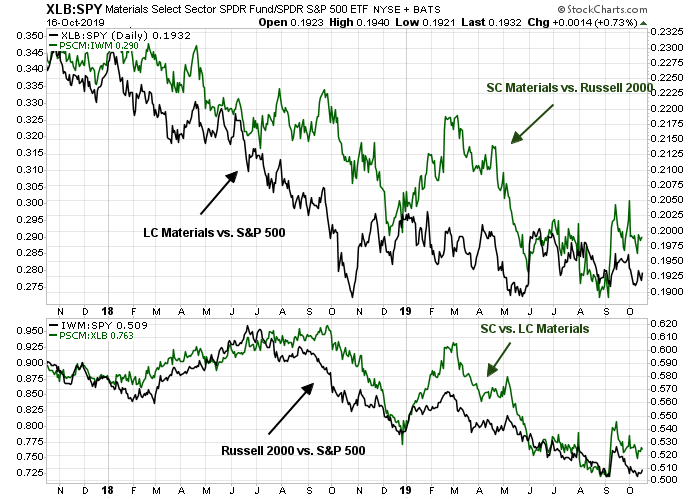
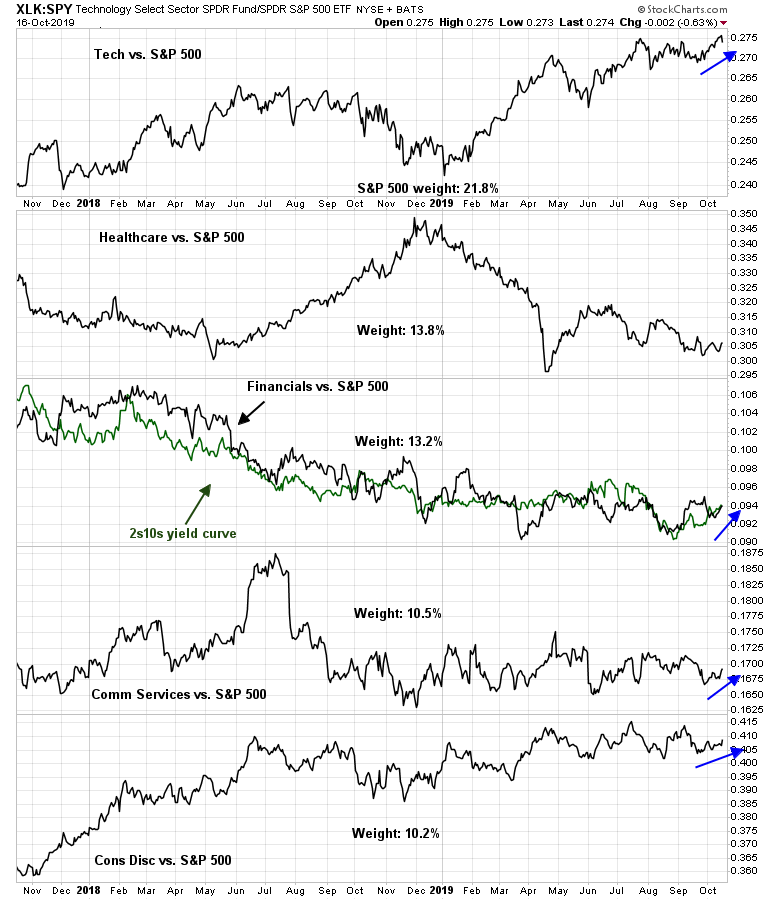
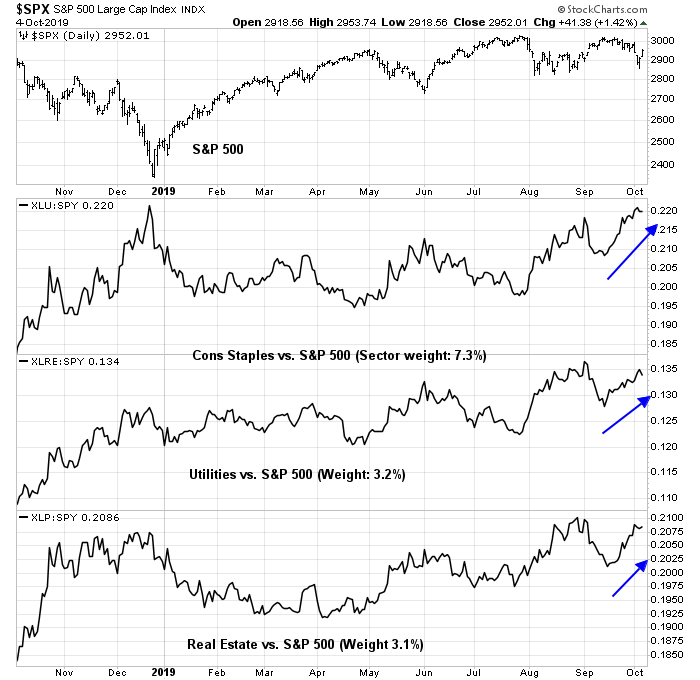
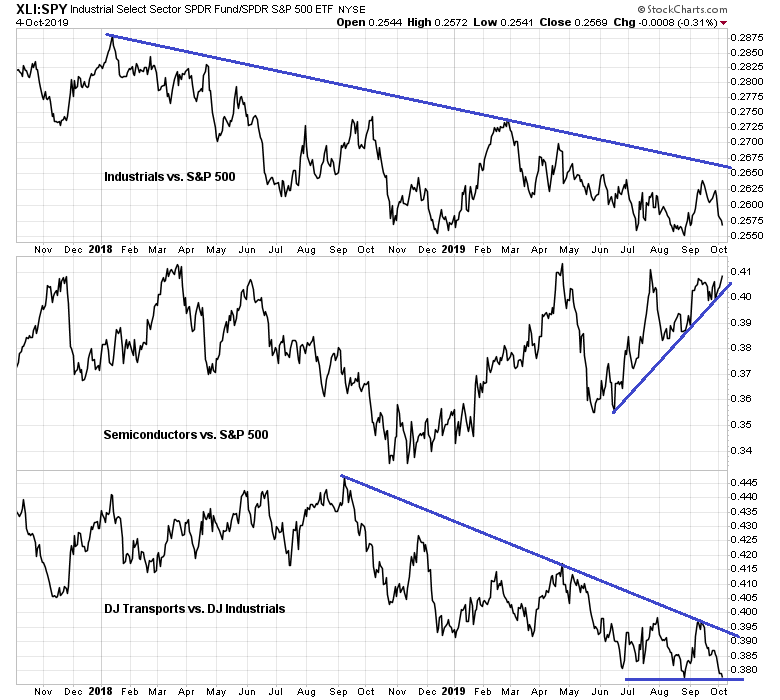
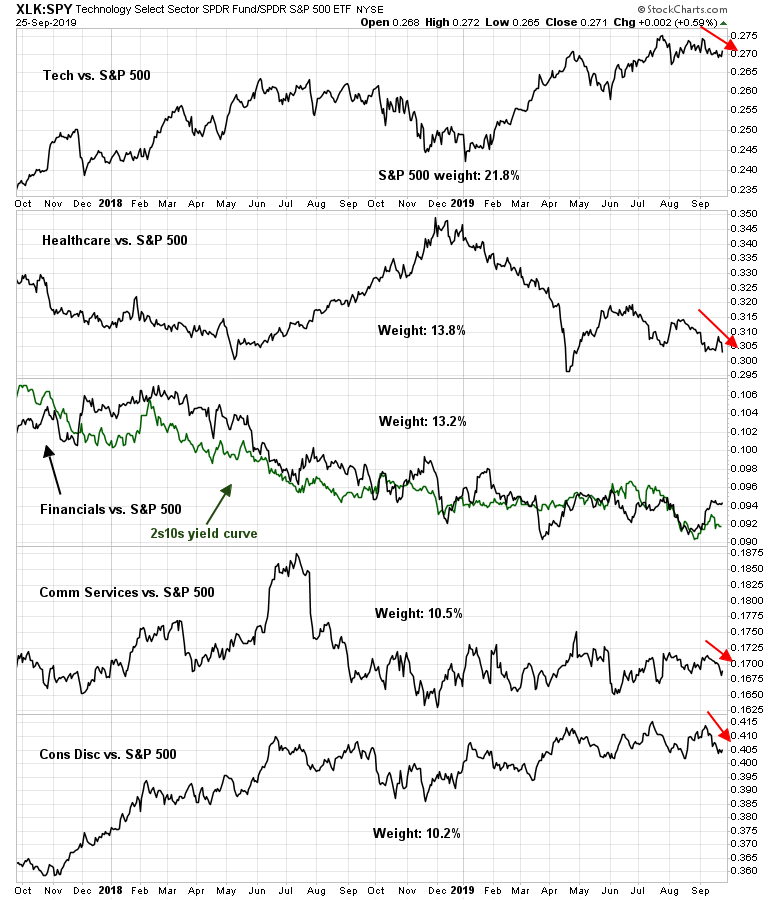
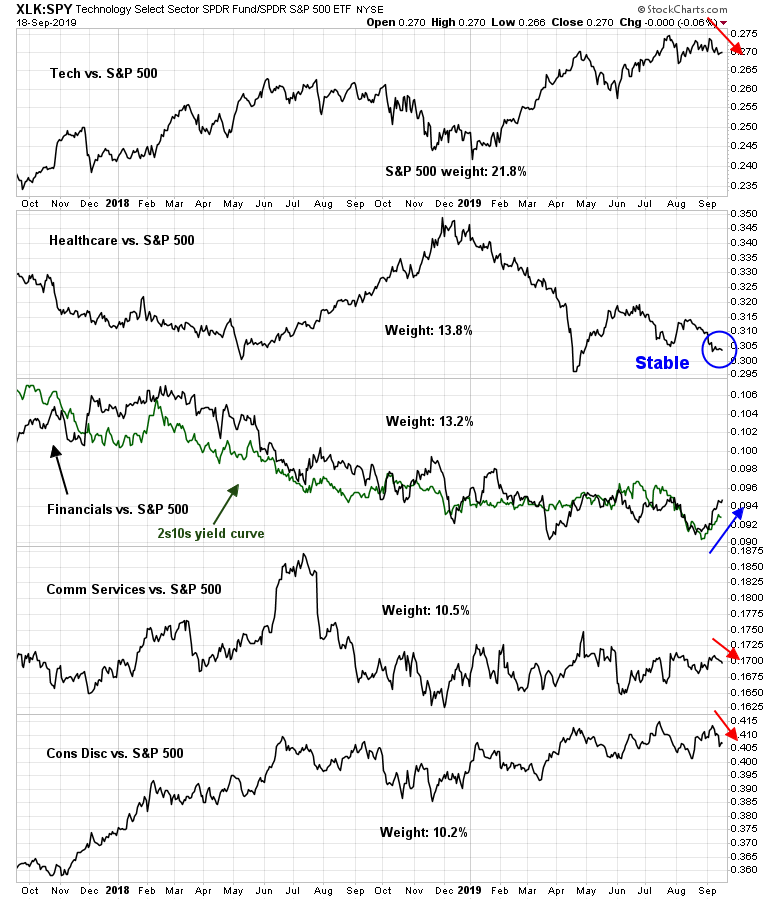
When in doubt, I also like to analyze the market relative strength of top sectors. Of the top five sectors that comprise nearly 70% of index weight, only one is showing positive relative strength. It is difficult to see how the index could advance in a sustainable way without the participation of most of the heavyweight sectors.
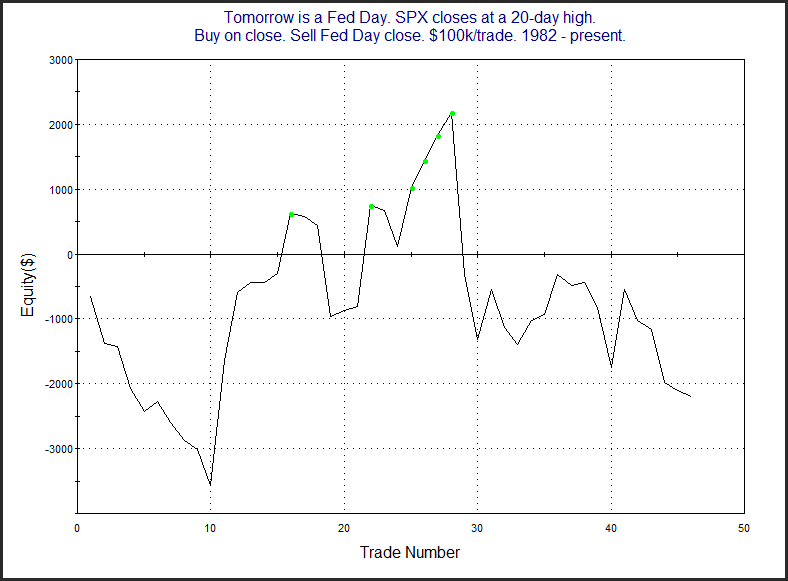
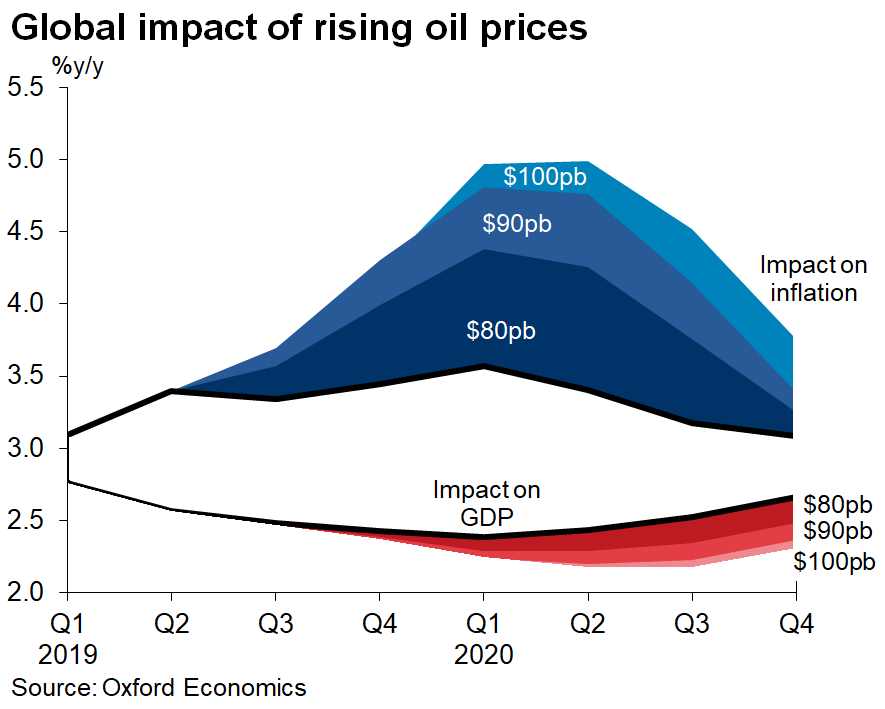
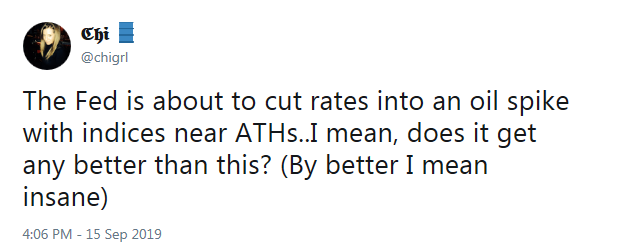
Notwithstanding the likely market anxiety over the attack on Saudi oil facilities, the major market event in the upcoming week will be the FOMC meeting. Make no mistake, the Fed will cut the Fed Funds rate by a quarter-point, as expected. The Fed has shown that it does not like to disappoint the market. However, it may use the opportunity to guide expectations in a hawkish manner. Currently, the market is discounting a quarter-point cut at the September meeting, followed by a quarter-point at the December meeting, with no further changes thereafter.
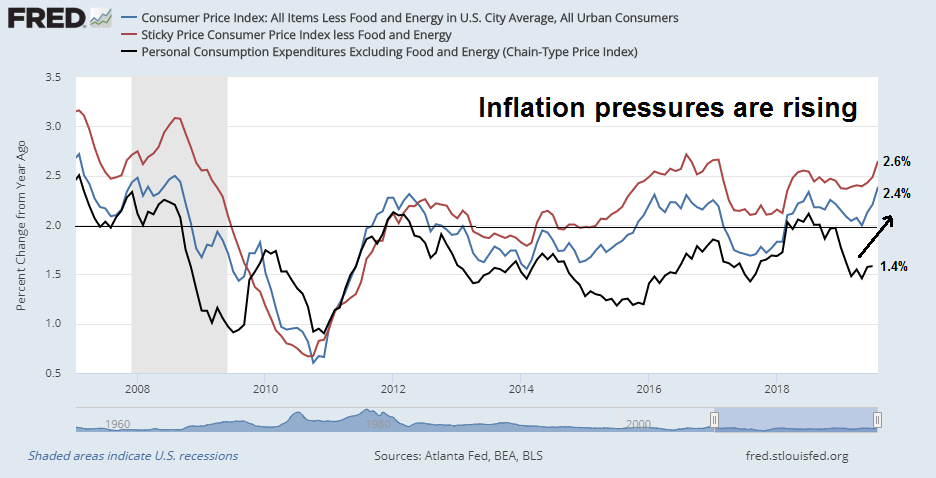
In the absence of trade tensions, it is difficult to see how the Fed could justify easing monetary policy. Inflation pressures are rising, as evidenced by the upward pressure in core CPI (blue line, 2.4%), core sticky price CPI (red line, 2.4%), and core PCE (black line, 1.4%).
Indeed, Fed Funds expectations for next 6 and 12 months shows the odds of more aggressive rate cuts are receding.
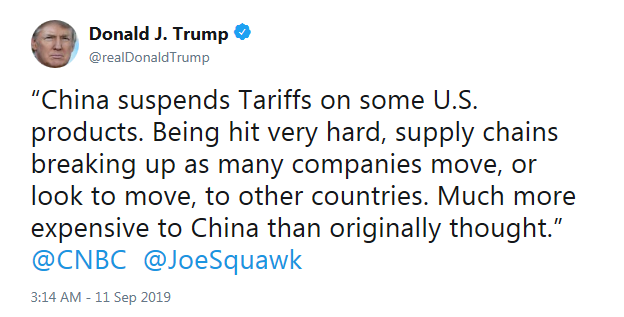
The future of Fed policy will depend on progress in Sino-American trade negotiations. Both sides made conciliatory goodwill gestures last week, and apparent tensions are falling. Watch for language from the Fed that the combination of strengthening inflation and falling trade tensions will compel the central bank to put monetary policy on hold.
The wildcard will be Trump. As the stock market recovers, Dow Man will be under less pressure, and he may decide to hibernate. The risk is Tariff Man will feel comfortable with the cushion afforded by the strong economy signaled by stock prices to make an appearance and derail negotiations.
In short, the risks are asymmetric, and tilted to the downside.
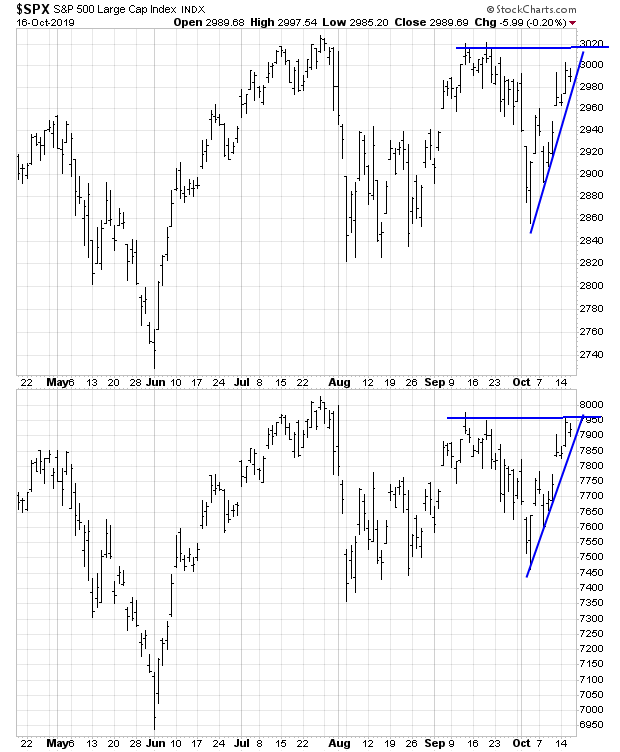
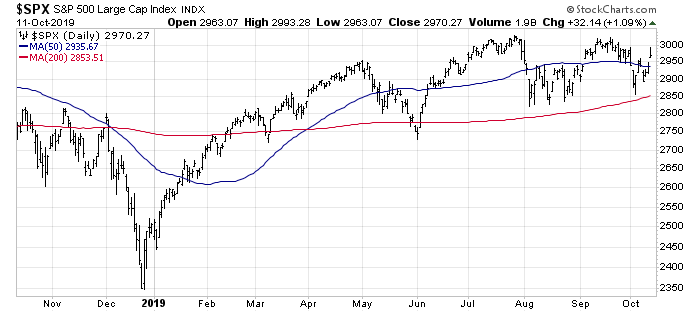
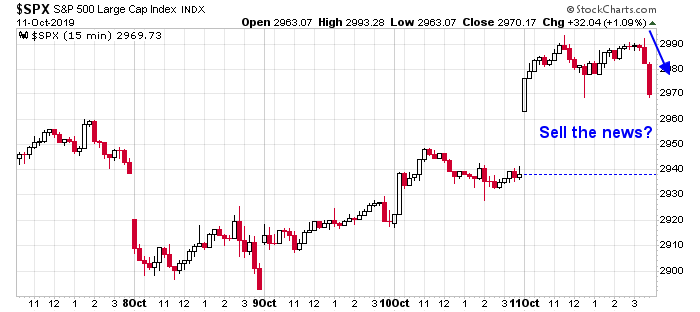
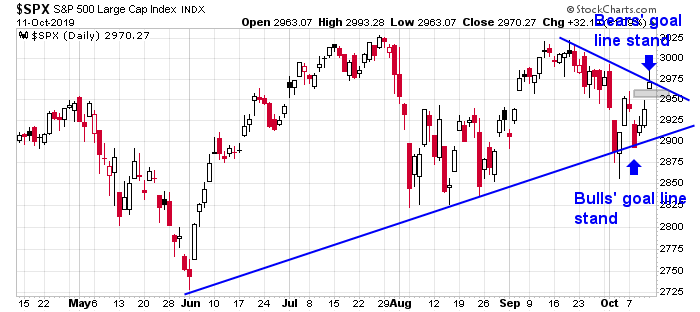
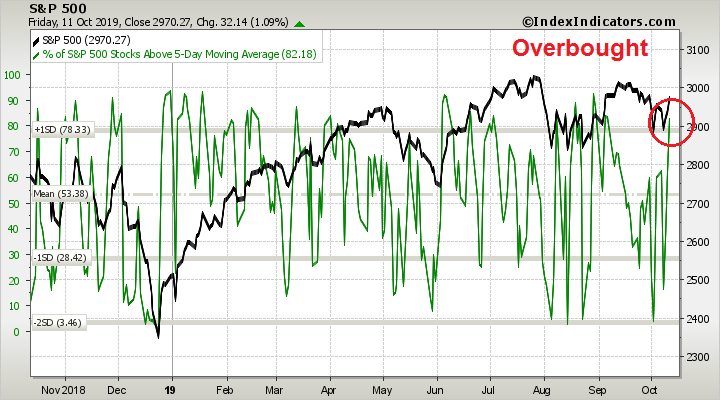
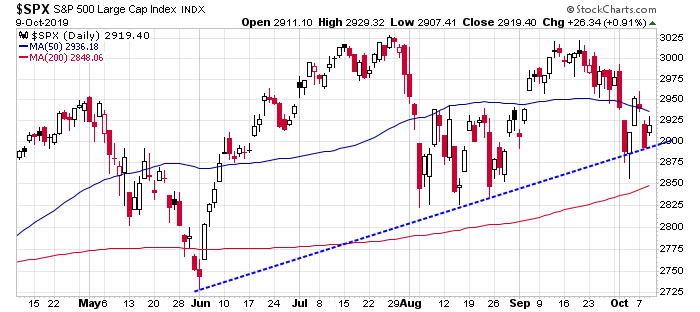
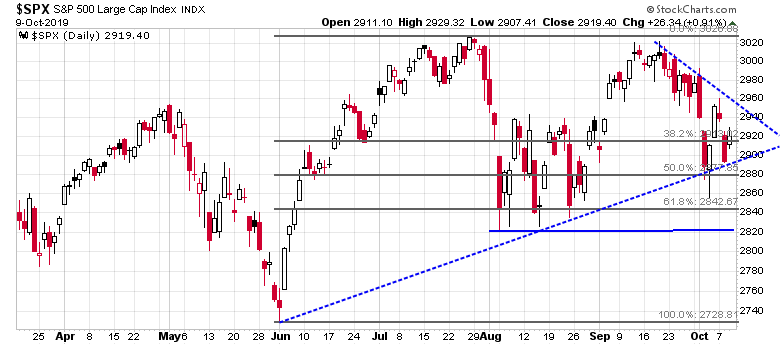
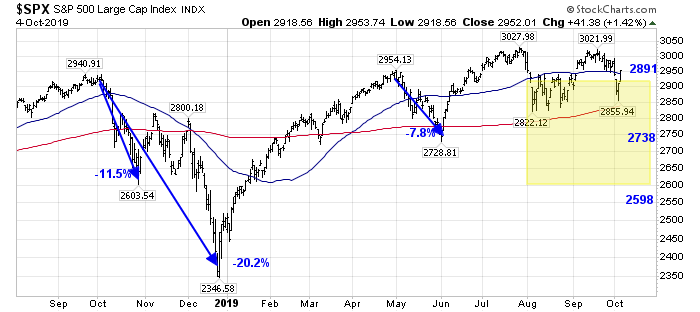
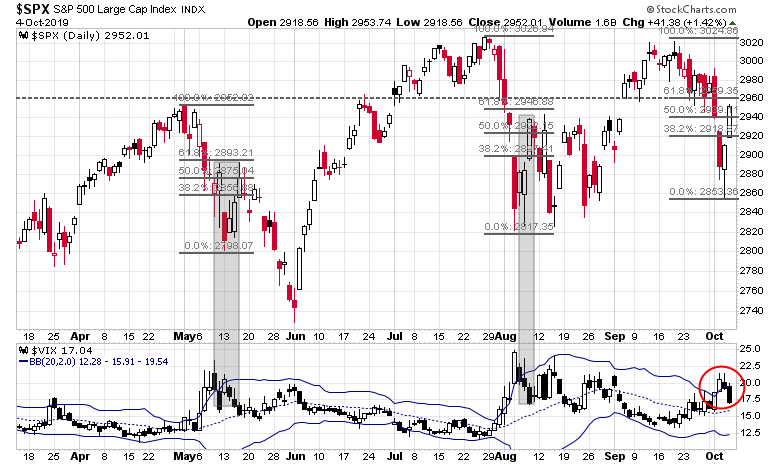
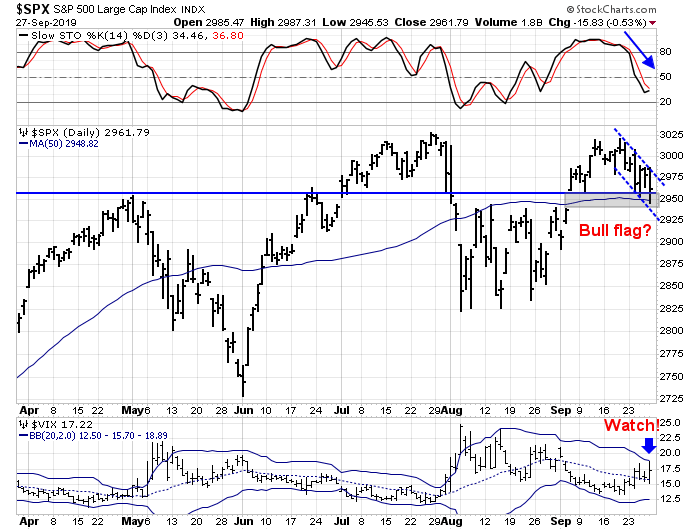
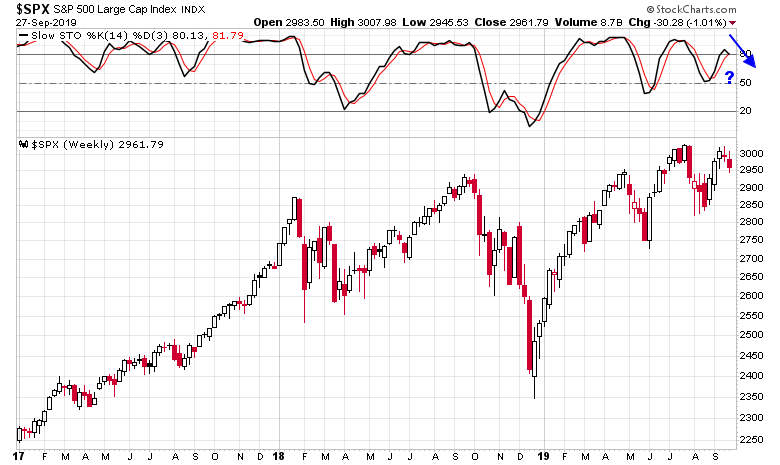
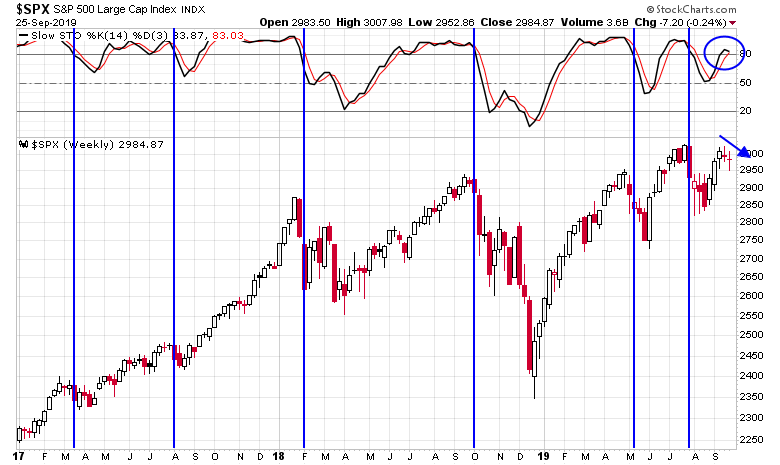
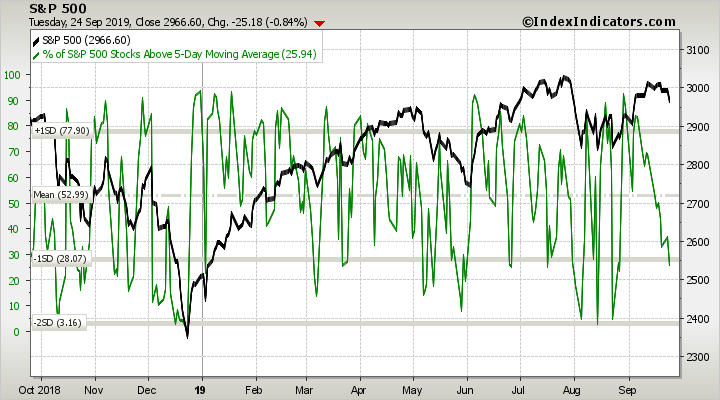
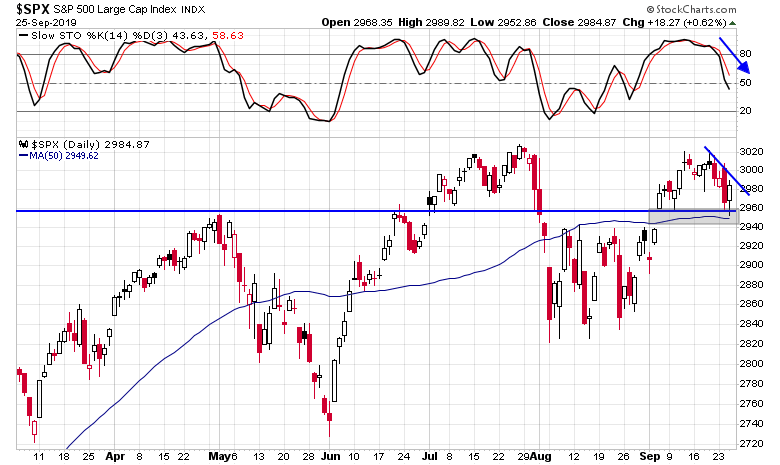
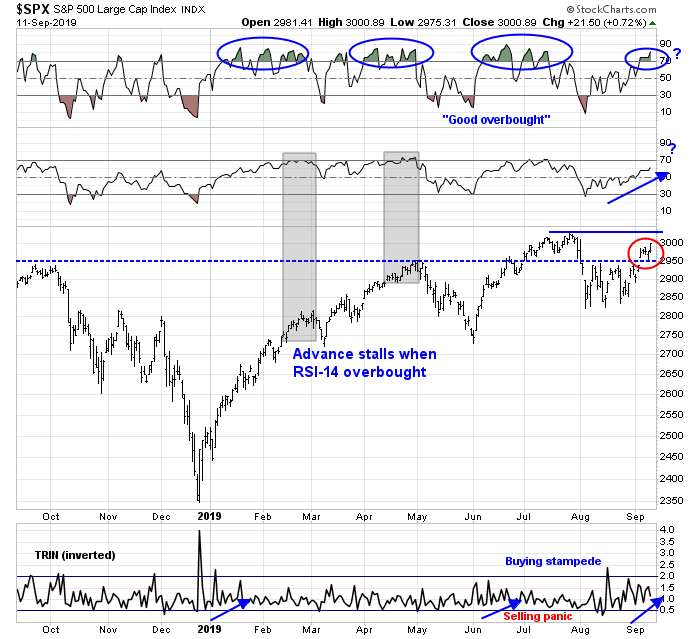
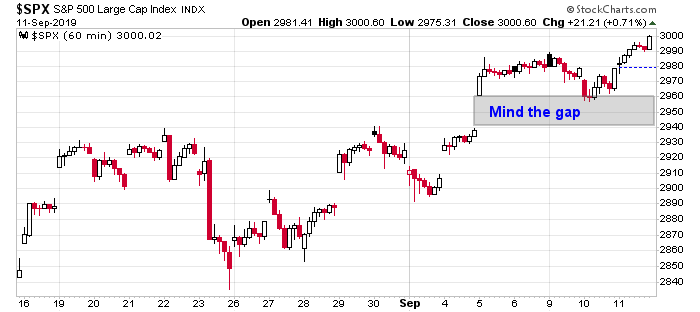
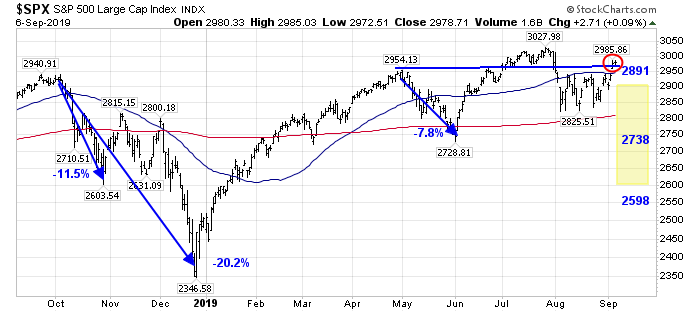
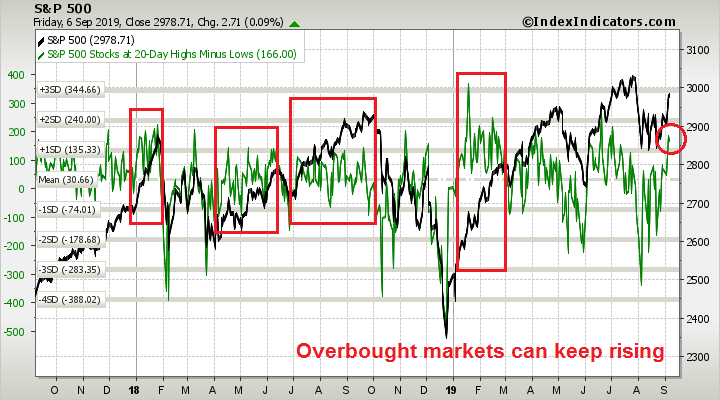
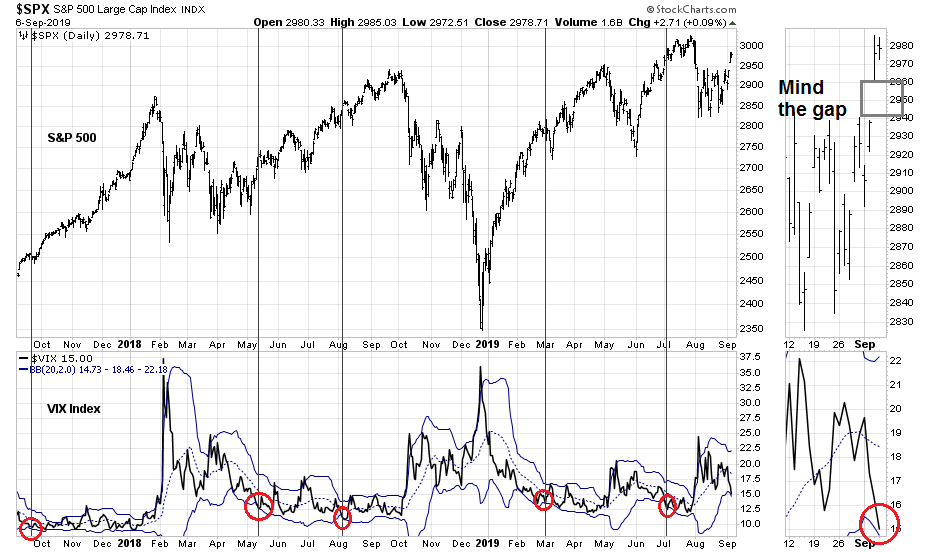
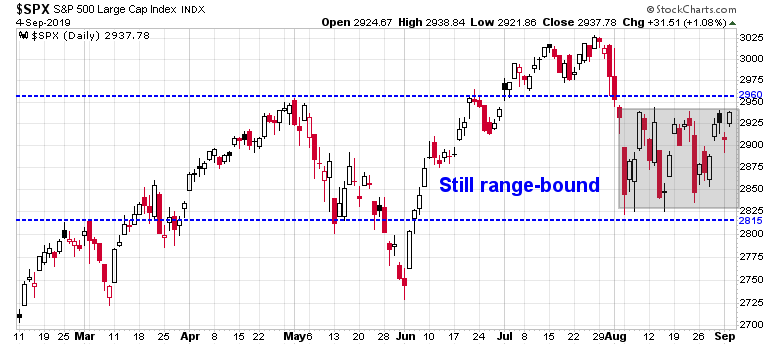
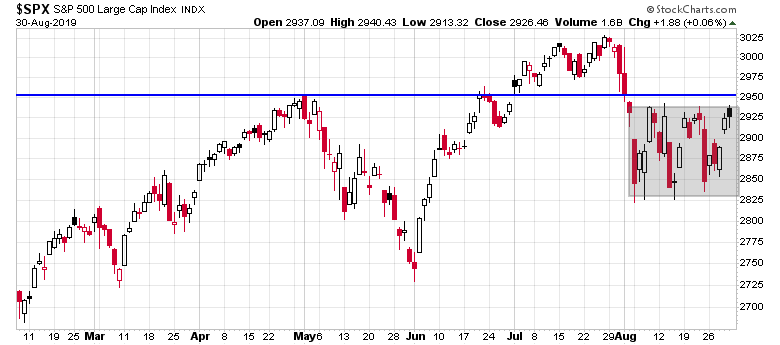
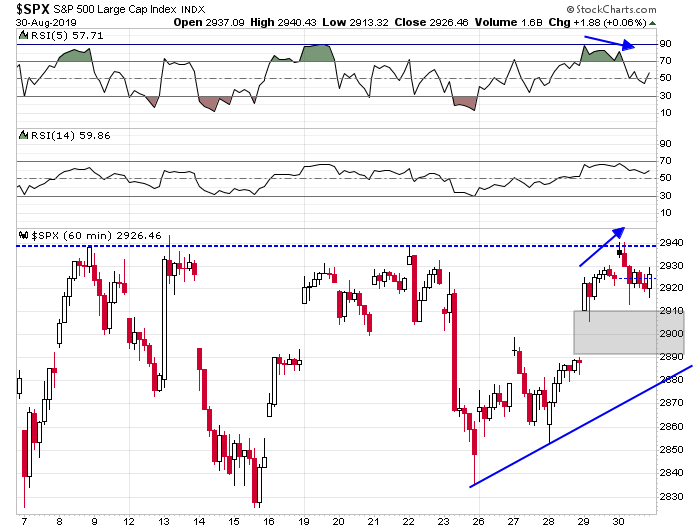
Tactically, the market is overbought, but indicators have not recycled from an overbought condition to neutral, which would be a sell signal. There is support at 2960, with a gap below in the 2940-2960 zone.
The market is already vulnerable to a pullback. The news of the attack on Saudi oil facilities could be the catalyst for a risk-off episode.
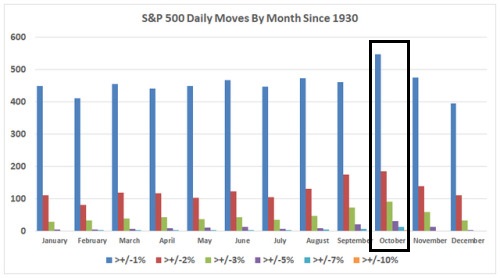
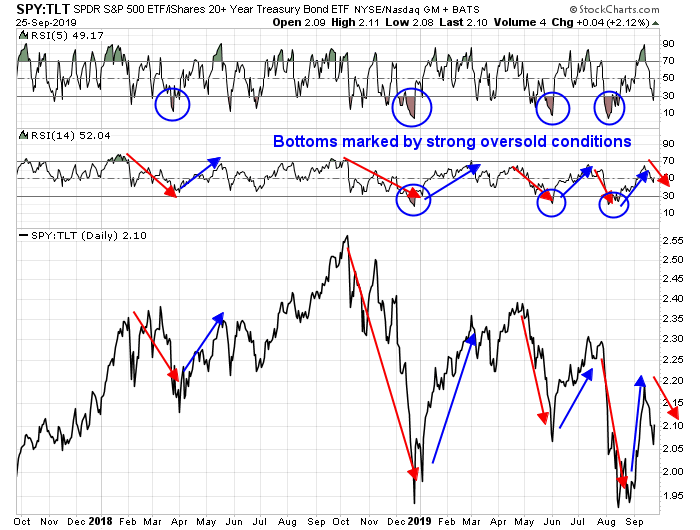
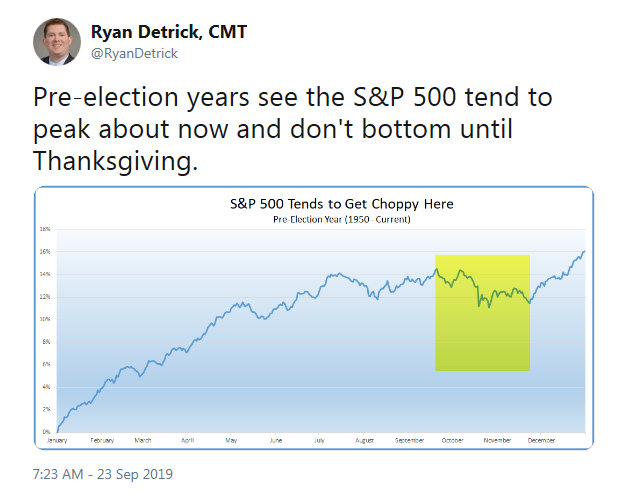
Ryan Detrick observed that we are nearing the peak of the September seasonality for the last 20 years. If history is any guide, the rest of the month will have a bearish bias.
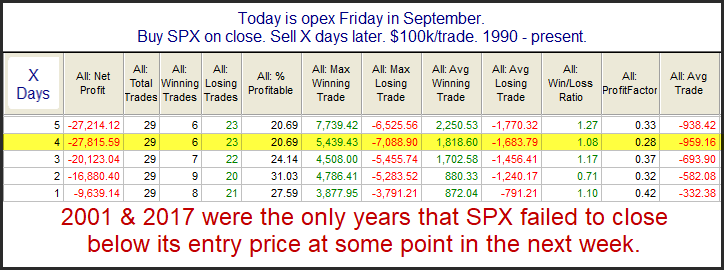
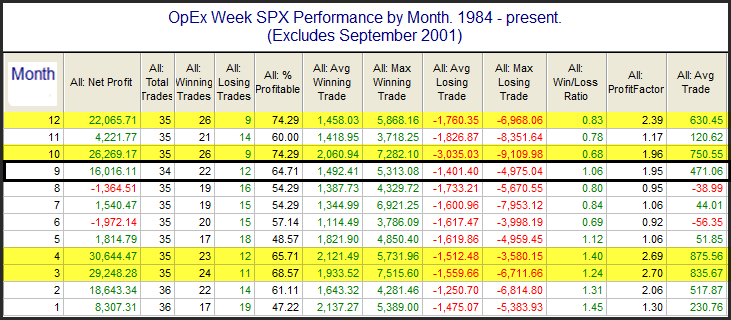
Next week is also option expiry (OpEx) week. Past September OpEx weeks has shown a bullish bias, but the market reaction to the FOMC meeting could easily negate those seasonal patterns.
My inner investor remains cautiously positioned, and he is underweight stocks. Subscribers received an email alert Friday morning indicating that my inner trader had taken an initial short position. We may see further volatility in the early part of the week, and he will use any strength as an opportunity to add to his short position.
Disclosure: Long SPXU