Preface: Explaining our market timing models
We maintain several market timing models, each with differing time horizons. The “Ultimate Market Timing Model” is a long-term market timing model based on the research outlined in our post, Building the ultimate market timing model. This model tends to generate only a handful of signals each decade.
The Trend Model is an asset allocation model which applies trend following principles based on the inputs of global stock and commodity price. This model has a shorter time horizon and tends to turn over about 4-6 times a year. In essence, it seeks to answer the question, “Is the trend in the global economy expansion (bullish) or contraction (bearish)?”
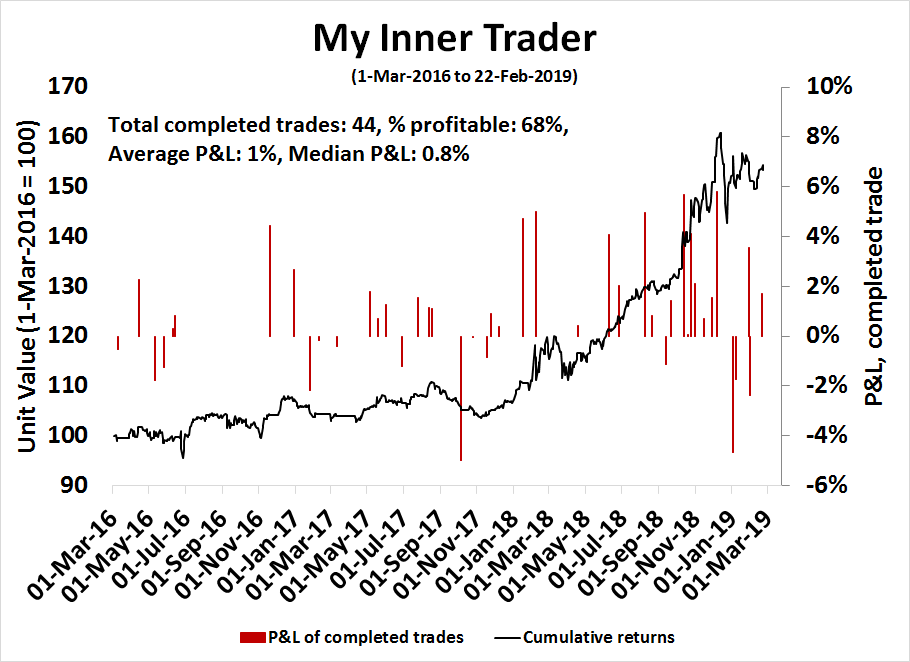
My inner trader uses a trading model, which is a blend of price momentum (is the Trend Model becoming more bullish, or bearish?) and overbought/oversold extremes (don’t buy if the trend is overbought, and vice versa). Subscribers receive real-time alerts of model changes, and a hypothetical trading record of the those email alerts are updated weekly here. The hypothetical trading record of the trading model of the real-time alerts that began in March 2016 is shown below.
The latest signals of each model are as follows:
- Ultimate market timing model: Sell equities
- Trend Model signal: Neutral
- Trading model: Bearish
Update schedule: I generally update model readings on my site on weekends and tweet mid-week observations at @humblestudent. Subscribers receive real-time alerts of trading model changes, and a hypothetical trading record of the those email alerts is shown here.
Take some chips off the table
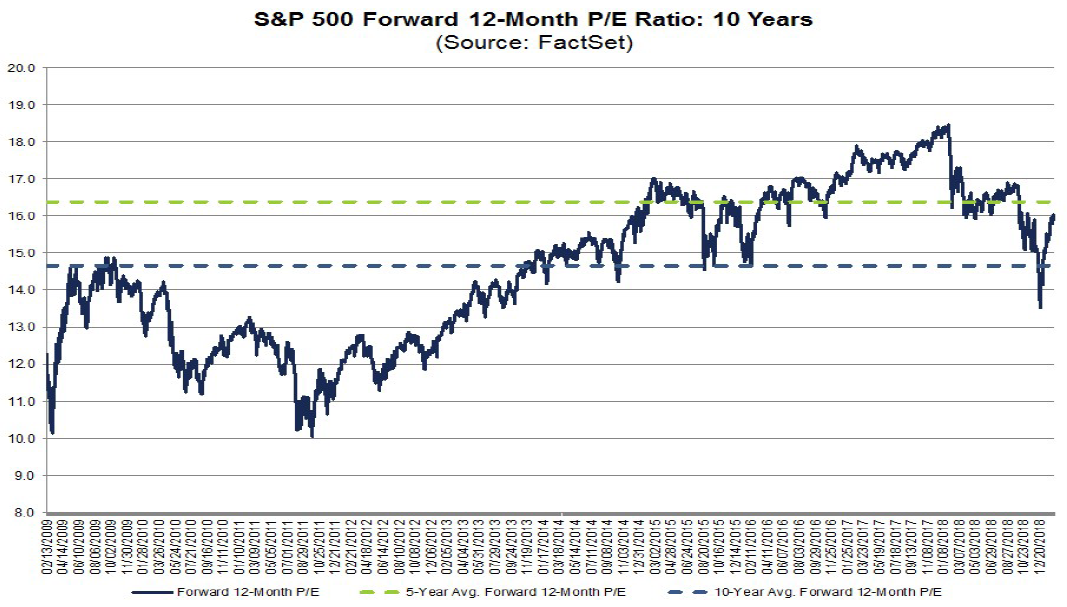
Don’t get me wrong. I haven’t turned bearish. The US equity market is no longer wildly cheap. The current forward P/E is now 16.2, which is between its 5-year average of 16.4 and 10-year average of 14.6. It is a far cry from the sub-14 multiple seen at the December lows.
When I turned bullish in mid-January 2019 (see A rare “what’s my credit card limit” buy signal and Ursus Interruptus), my model portfolio became overweight equities in the snapback rally. Its equity weight would have drifted to either the top or above its asset allocation range. Now that the market is no longer cheap, it is time to trim equity weights back to a more neutral position.
This is not a bearish call. The US stock market is not going to crash, and it should be higher a year from now. This is just a call to reduce risk, and near-term risk levels are rising. Looking to the next few months, a number of risks have appeared.
- Rising financial stress
- Weak market internals and negative divergences
- US-China trade deal blowback
- USD strength is a threat to stock prices
Rising financial stress
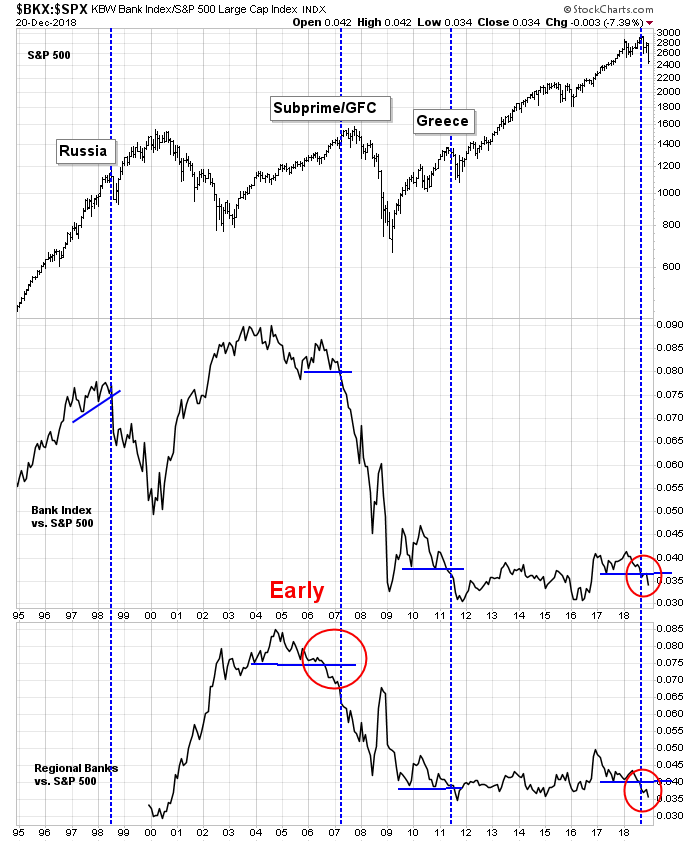
Most notably, signs of systemic financial risk are showing up all over the place. In the past, stock prices have stumbled after the relative performance of bank stocks have breached technical support. Will this time be any different?
An equally worrisome sign is the bifurcation of the paths taken by the stock and credit markets. As global stock prices have rebounded from their December lows, the credit market is marching to a different drummer. A BAML survey of investment grade bond managers reveals their biggest worry is a global recession.

Stock prices staged a strong rally since the Christmas Eve low, but bond yields have been declining and continue to decline since early November. In addition, the 2s10s yield curve began to steepen slightly in December prior to the stock market low, and flattened again in January. These are all signs that the bond market expects slower growth, both in the US and globally. So why are stock prices rising?

The WSJ reported that the percentage of negative yielding bonds have actually risen since mid-January, and most of the rise has come from Europe. Does this look like the picture of a global growth revival?
Negative-yielding government bonds outstanding through mid-January have risen 21% since October, reversing a steady decline that took place over the course of 2017 and much of last year, according to data from Bank of America Merrill Lynch. While the stock of negative-yielding debt still remains below its 2016 high, the proliferation of these bonds—which guarantee that a purchaser at issuance will receive less in repayment and periodic interest than they paid—underscores the uncertainty over the growth prospects in much of the developed world.
As for China, the latest round of stimulus is starting to kick in, and the authorities are pulling out all stops to ensure that growth doesn’t tank ahead of the 70th anniversary of the founding of the People’s Republic of China on October 1, 2019. However, stimulus is going to be front-end loaded this year, and further analysis reveals that about interest payments amount to roughly 70% of new financing, as measured by total social financing (TSF).

Weak market internals
Even as stock prices have rallied, the behavior of some market internals are unconvincing. In particular, the relative performance of high beta groups has been mixed, which is not a bullish signal for equity market risk appetite.

Cyclical indicators are still weak, indicating expectations of decelerating global growth. Global industrial stocks have rebounded strongly, but the rally looks like a dead-cat bounce in the context of a slowing global economy.

The industrial metals to gold ratio is another indicator of global cyclical growth and correlates well with risk appetite. This ratio remains in a downtrend.

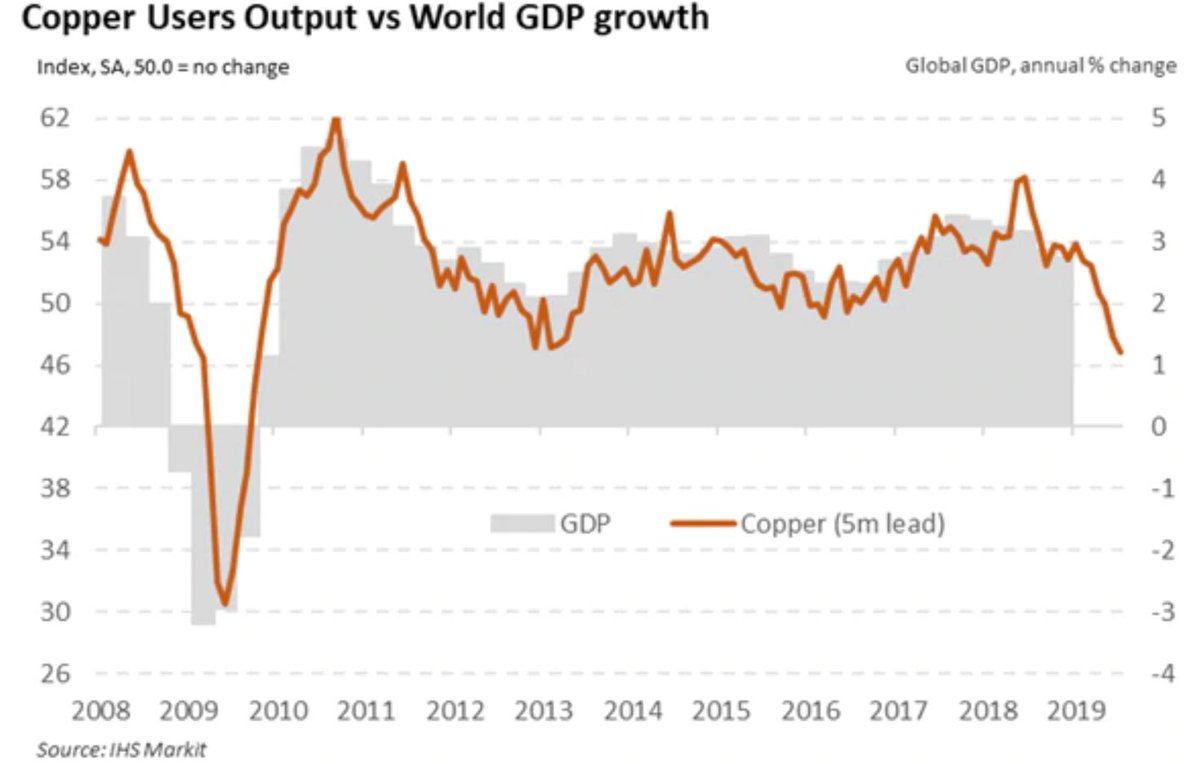
The commodity markets are flashing other cautionary signals. Copper prices is indicating a slowdown in global growth.
Trade deal blowback
One key component of any US-China agreement is the reduction of the trade deficit. China will have to divert imports from other regions of the world to the US. Analysis from Barclays shows that the EU will be the biggest loser in such an arrangement.

The latest release of Eurozone PMI shows a rebound in Composite PMI, led by services, but manufacturing has been slow, and exports have been especially weak. A US-China trade deal will serve to further weaken European manufacturing, The German economy, which has been the growth locomotive of Europe, narrowly avoided a technical recession in Q4. Further reduction of German exports could push Germany and Europe into recession, which would expose more cracks in the European banking system.

So far, the relative performance of European financial stocks has been roughly in line with American financials, but investors should keep an eye on any possible negative developments on this front.

What about the US Dollar?
Another effect of a possible US-China trade deal is a widening growth differential between the US and other non-Chinese economies, and that would serve to put upward pressure on the USD. Moreover, the Fed’s neutral monetary policy stance, in contrast to the easy nature of other major central banks, will also serve to buoy the greenback. In the past, sustained USD strength has seen equity prices take a tumble.

A rising USD would also put downward pressure on earnings growth, as 38% of S&P 500 sales come from non-US sources.

Why I remain bullish
Despite all these concerns, I remain constructive on the outlook for stock prices. I do not believe the bounce off the December low is a bear market rally for two reasons.
The first is the Fed policy. The minutes of the January FOMC meeting makes it clear that a Powell Put is in place. There was a great deal of concern about “market stability”, and “volatility” [emphasis added].
Among those participants who commented on financial stability, a number expressed concerns about the elevated financial market volatility and the apparent decline in investors’ willingness to bear risk that occurred toward the end of last year. Although these conditions had eased somewhat in recent weeks, a couple of participants noted that the strain in financial markets might have persisted or spread if it had occurred during a period of less favorable macroeconomic conditions. A couple of participants highlighted the role that decreased liquidity at the end of the year appeared to play in exacerbating changes in financial market conditions. They emphasized the need to monitor financial market structures or practices that may contribute to strained liquidity conditions. A few participants highlighted the importance of ensuring that financial institutions were able to withstand adverse financial market events–for instance, by maintaining adequate levels of capital.
Remember how the market took fright at Powell’s comment about balance sheet normalization being on autopilot? Here is how they changed their tune at the January meeting:
Almost all participants thought that it would be desirable to announce before too long a plan to stop reducing the Federal Reserve’s asset holdings later this year. Such an announcement would provide more certainty about the process for completing the normalization of the size of the Federal Reserve’s balance sheet.
Here is the key passage which indicates that some members of the FOMC are closely watching the stock market [emphasis added]:
Following the briefing, participants raised a number of questions about market reports that the Federal Reserve’s balance sheet runoff and associated “quantitative tightening” had been an important factor contributing to the selloff in equity markets in the closing months of last year. While respondents assessed that the reduction of securities held in the SOMA would put some modest upward pressure on Treasury yields and agency mortgage-backed securities (MBS) yields over time, they generally placed little weight on balance sheet reduction as a prime factor spurring the deterioration in risk sentiment over that period. However, some other investors reportedly held firmly to the belief that the runoff of the Federal Reserve’s securities holdings was a factor putting significant downward pressure on risky asset prices, and the investment decisions of these investors, particularly in thin market conditions around the year-end, might have had an outsized effect on market prices for a time. Participants also discussed the hypothesis that investors may have taken some signal about the future path of the federal funds rate based on perceptions that the Federal Reserve was unwilling to adjust the pace of balance sheet runoff in light of economic and financial developments.
The markets throw a tantrum, the Fed responds. The Powell Put is firmly in place.
The late 2018 market dip, coupled with the dovish shift in Fed policy, is somewhat reminiscent of Fed policy in 1998, when the Fed eased in response to the Russia Crisis. Stock prices recovered, and then bubbled up to the NASDAQ top about 1 1/2 years later. This monetary backdrop argues for a strong market into 2020.
History doesn’t repeat, but rhymes, and I am neither forecasting a bubbly rise in stock prices, nor am I forecasting the timing of the ultimate equity market top. Further, I am not implying that the Powell Fed is becoming a carbon copy of the Greenspan Fed of 1998-2000. This rather frank Brookings Institute podcast interview with Janet Yellen reveals that the former Fed chair was highly sensitive to foreign economic developments. Reading between the lines, a Yellen Fed today would probably behave in the same way as the Powell Fed did. Nevertheless, the 1998-2000 period can serve as a useful template for thinking about how stock prices might behave in the future.
Indeed, the market’s recent recovery was accompanied by a strong breadth thrust, with the percentage of stocks above their 50 day moving average rising to about 90%. While the market is overbought, past episodes have tended to resolve bullishly over a one-year time horizon.
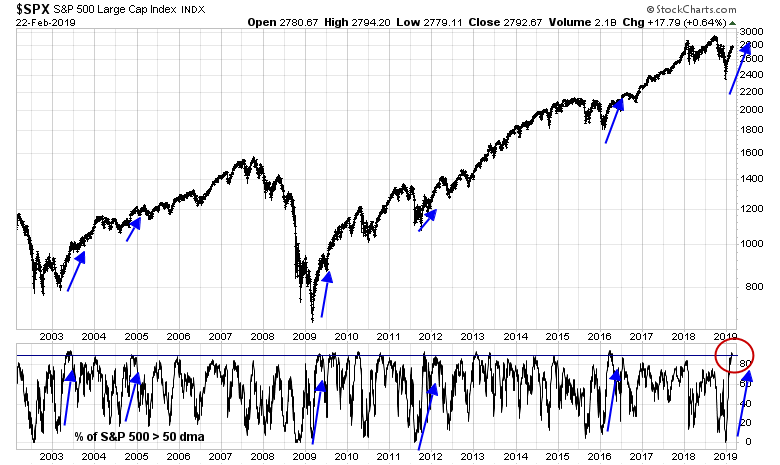
I studied the period from 2001 to the present, and found 12 instances with non-overlapping periods where this indicator exceed 90%. The market performed very well over a one-year time horizon, but that does not preclude a corrective period within a shorter two month period.

Another analysis of strong market momentum illustrates my point of near-term weakness. The chart below depicts the ratio of stocks above their 50 dma to stocks above their 200 dma as a measure of momentum. Past episodes have seen the market advance either stall or correct when momentum starts to peter out, but prices are generally higher a year later.

In conclusion, the US equity market has moved from being cheap to roughly fair value in a very short time, while a number of near-term risks are appearing on the horizon. While I do not believe any of these risks pose an existential threat to the bull market, they do have the potential to cause some dislocation over the next few months. Investors should therefore adjust their asset allocations accordingly to a more neutral position should a corrective episode manifest itself.
The week ahead: Vulnerable to a setback
Looking to the week ahead, the US equity market appears vulnerable to a setback. Traders can often discern the tone of a market by the way it responds to news. The stock market only ground out a marginal recovery high and stalled at resistance in the face of bullish trade news and FOMC minutes. The stall occurred just as RSI-14 neared 70, which is a level that past advances ran out of steam in the past year.

Short-term breadth readings are also suggesting a downward bias to stock prices, as the percentage of stocks above the 5 dma is rolling over after hitting overbought territory.

At times like this, a useful question traders can ask is what could go right, and what could go wrong. One scenario could see the US-China trade discussions fall apart, which would be catastrophic for risk appetite. On the other hand, the upside from a deal appears limited, as much has already been discounted. This WSJ report seems to suggest that Trump is eager for a deal, but the market reaction so far has been tepid:
President Trump, citing progress in U.S.-China trade talks, said he is looking at extending a deadline to raise tariffs and hoping to meet next month with Chinese leader Xi Jinping to complete a broad trade agreement.
His comments in the Oval Office followed four days of talks between U.S and Chinese negotiators, which Mr. Trump extended through the weekend. “We’re having good talks, and there’s a chance that something very exciting can happen,” he said.
Among the accomplishments that Mr. Trump cited was a pact with Beijing to curb currency manipulation, which Treasury Secretary Steven Mnuchin called “one of the strongest agreements ever on currency.”
More importantly, Trump sounds ready to throw the China hawks like Robert Lightizer under the bus:
China hawks in the business community, the administration and in Congress say they are troubled by what they see as Mr. Trump’s growing impatience for a deal, and are urging him to stand firm and insist China make fundamental changes in its industrial policies…
The prospective deal also reflects a growing divide between Mr. Trump and Mr. Lighthizer, say people familiar with the administration deliberations. During the past year, Mr. Lighthizer has successfully recommended to Mr. Trump that he impose tariffs on Chinese goods over the objections of Mr. Mnuchin.
But after the stock market nose-dived late last fall, Mr. Trump’s appetite for a tariff battle with China diminished, say administration officials. Recently, the U.S. Trade Representative’s office has been making thank-you calls to those who appear on television or in the press calling for the administration to take a tougher stance on China.
“Lighthizer had previously been getting his way by mastering the inside game,” said Gene Sperling, a former senior economic official in the Clinton and Obama administrations, who has negotiated China trade deals. “As Trump gets more eager for any deal, he is now being forced to play an outside game to keep the pressure on.”
Should the US and China conclude an agreement, attention will turn next to the US trade negotiations with the EU with a particular focus on autos. In addition, greater scrutiny will be given to China’s import diversions in order to satisfy their agreement with the US, and one of the biggest losers will be Europe. This would be a bearish development for European stocks, and neutral to bearish for US equities.
One little known source of geopolitical risk, at least to the residents of Europe and North America, is the growing tension between India and Pakistan. This article from The Economist summarized the situation well:
A huge car bomb struck a convoy of paramilitary police in Indian-administered Kashmir on February 14th, killing at least 40 paramilitary police. The suicide attack, claimed by a Pakistan-based Islamist terror group, was the deadliest single blow to Indian security forces since the start of unrest in Kashmir 30 years ago.
Amid public outrage in India, and with national elections approaching in April, Narendra Modi, India’s prime minister, has promised a “jaw-breaking response”. Having boosted his nationalist credentials by ordering retaliatory “surgical strikes” across the Pakistani border following a similar attack in 2016, Mr Modi will be pressed to react even more harshly this time. Chronically tense relations between India and Pakistan, both nuclear-armed states, appear headed towards a dangerous showdown.
Indian officials were quick to underline Pakistan’s links to Jaish-e-Muhammad (JeM), the group that claimed responsibility for the attack. Its leader, Masood Azhar, “has been given full freedom by the government of Pakistan…to carry out attacks in India and elsewhere with impunity,” declared a statement from India’s foreign ministry. Many Indians have also expressed anger with China, which has repeatedly blocked Indian efforts to get Mr Azhar included on the UN Security Council’s list of designated terrorists. Pakistan, a close ally of China, condemned the attack but in the same breath rejected “insinuations” of any link to the Pakistani state.
So far, only South Asian specialists appear to be paying any attention to this story, but events have the potential to spiral out of control very quickly. A conflict between two nuclear-armed neighbors is never a welcome development for market risk appetite.
A conflict could serve to spike risk premiums, and gold prices. However, gold has been behaving in an unusual manner, as it has been rising in line with stock prices. In the past, gold has acted as a safe haven during periods of stock market turmoil, and the long-term correlation of stocks and gold has been slightly negative. However, recent episodes of high stock and gold correlations have tended to resolve themselves in a stock price trend reversal. A near-term decline in equities may be on the horizon.

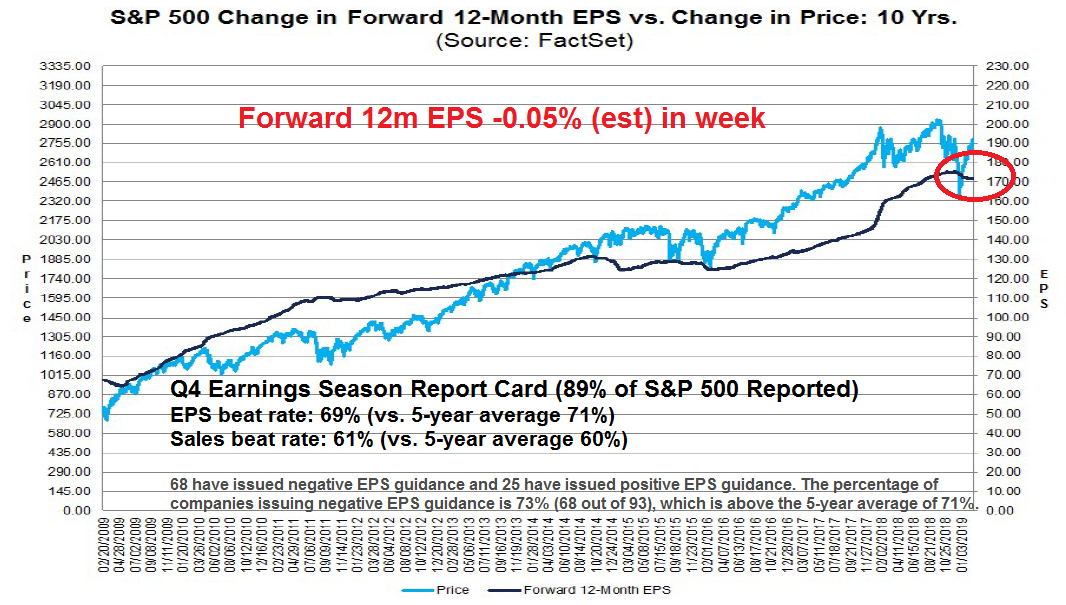
Another source of vulnerability comes from fundamentals. The latest update from FactSet shows that Q4 is nearly over. While sales and EPS beat rates are roughly in line with historical averages, forward EPS are being revised downwards, and Q1 guidance is below average. The recent market advance in implies that price gains are the result of multiple expansion in the face of a deterioration in fundamentals.
While I would not discount the possibility of further upside next week on the news of a definitive US-China trade deal, risk/reward is not favorable for the bulls, at least in the short run.
My inner investor is trimming back his equity exposure, which has drifted upward as the market rallied. He is targeting a neutral asset allocation position, as specified by his investment policy. My inner trader began dipping a toe on the short side last week, and he is prepared to add to his shorts should the market advance further.
Disclosure: Long SPXU
You clearly called a market buy mid-January yet your Market Trend Signal remains ‘neutral’. What will it take t move it Bullish?
The Trend Model would turn bullish when we get a bit more strength from the overseas equity markets and commodity prices. That said, the market looks extended and due for a pause or correction, so even if I would tend to discount the short-term outlook even if we get a bullish signal.
Picture the situation at the turn century 1900 with Britain the leading economy and the pound the reserve currency. Upstart, USA gradually takes the lead and by the 1920’s is the stock market with the greatest global impact. Brits would be seeing their markets take strange turns they can’t explain but are the result of a new powerful, growing economy, the USA.
I believe this is happening now. We are trained to watch the American market but the Chinese economy and stock market are increasing their influence. This will only become a greater influence in future.
I believe and have said in this blog that China started a new bull market on October 29. The market had all three of my Big Picture pluses, VALUE (cheap), SENTIMENT (pessimism after 30% drop) and ECONOMIC LEADING INDICATORS (China Central Bank turning to easing and tax cuts for consumers).
This will boost the global economy and prevent the current weak outlook for Europe and the US to become a full-fledged recession. This is brand new. In the past, China and the world were in sync cyclically and we couldn’t see its influence.
Here is a chart of the Chinese ETFs I track.
https://tmsnrt.rs/2GE8tHL
Note I don’t track the Chinese tech ETFs. For tech, I use American.
My favorites are Consumer and Small Cap. My momentum research says small caps outperform in the first year of a new bull market cycle. Consumer benefits from the government policy thrust to raise consumer spending’s portion of GDP to reduce dependence on exports and infrastructure.
Chinese markets were up almost 6% last night to start the week.
I was asked to suggest a book on behavioral economics (investor psychology). Better still, here are some YouTube videos that will give you the info.
Daniel Kahneman is only the second non-economist to win the Nobel for economics. His Book: Thinking Fast and Thinking Slow is great but this video will give you the ideas fast.
https://www.youtube.com/watch?v=CjVQJdIrDJ0
He has some that are pointed to investing. Here is one.
Thinking Fast/Slow for Investors
https://www.youtube.com/watch?v=cuj2Kq8rvGw
Robert Shiller is the king of behavior for investors. His book Irrational Exuberance is a classic. Here is a video.
https://www.youtube.com/watch?v=bVdtPLPcM4o
I suggest you watch many of his videos.
I find many books are very wordy and the ideas could be put into an article instead or better still, a video of a speech by the author or an in depth interview video.
Call me lazy.
Ken, Thank you for sharing the information.
This week’s missive from Cam is of tight formation, precisely to the point. Excellent work.
China is playing a long game. Ken is right, China is likely to be the beneficiary of the end of trade war, and not the other way around.