Preface: Explaining our market timing models
We maintain several market timing models, each with differing time horizons. The “Ultimate Market Timing Model” is a long-term market timing model based on the research outlined in our post, Building the ultimate market timing model. This model tends to generate only a handful of signals each decade.
The Trend Model is an asset allocation model which applies trend following principles based on the inputs of global stock and commodity price. This model has a shorter time horizon and tends to turn over about 4-6 times a year. In essence, it seeks to answer the question, “Is the trend in the global economy expansion (bullish) or contraction (bearish)?”
My inner trader uses a trading model, which is a blend of price momentum (is the Trend Model becoming more bullish, or bearish?) and overbought/oversold extremes (don’t buy if the trend is overbought, and vice versa). Subscribers receive real-time alerts of model changes, and a hypothetical trading record of the those email alerts are updated weekly here. The hypothetical trading record of the trading model of the real-time alerts that began in March 2016 is shown below.

The latest signals of each model are as follows:
- Ultimate market timing model: Sell equities
- Trend Model signal: Neutral
- Trading model: Bullish
Update schedule: I generally update model readings on my site on weekends and tweet mid-week observations at @humblestudent. Subscribers receive real-time alerts of trading model changes, and a hypothetical trading record of the those email alerts is shown here.
Why I turned bullish
A number of readers were surprised by my change of recent change of view (see A rare “what’s my credit card limit” buy signal), I had been adopting a cautious tone since August (see Market top ahead? My inner investor turns cautious).
The September to December decline had been highly ambiguous. I believed that unless I could pinpoint the reasoning behind the risk-off episode, it was impossible to call a market bottom. However, US equity prices had already fallen about 20% on a peak-to-trough basis, and the historical evidence indicates that such a decline is already discounting a mild recession. How much worse can it get?

In addition, technical signals such as the Zweig Breadth Thrust (see A rare “what’s my credit card limit” buy signal) indicate that psychology is washed-out and turning around. The statistical odds favor high prices over a one-year time frame.
That said, I stand by my assertion of a choppy market for the next few months. Even though the odds are in the bulls favor, key risks remain unresolved and they are likely to weigh on the market in the near term.
- Negative fundamental momentum, in the form of downward earnings revisions and a decelerating macro outlook;
- China and the trade war;
- Trump’s likely confrontation with the Democrats may lead to a political risk premium; and
- Credit markets remain unsettled, and monetary policy could put downward pressure on stock prices.
What is the market discounting?
FT Alphaville reported that Nikolaos Panigirtzoglou at J.P. Morgan Securities calculated the recession probabilities embedded in different asset classes, and most asset classes were already pricing in recession odds of over 50%.

More importantly, earnings are already discounting a mild recession:
As some recessions are shallower than others, Panigirtzoglou breaks down the historical data even further: deep versus mild. A deep recession is one in which the S&P 500 earnings fell by more than the median amount of bygone recessions — typically this occurs when the S&P 500 drops 33 per cent. A mild one is the reverse and an average slide of 18 per cent. Given this, Panigirtzoglou calculates that if a recession comes, the chances of it being a mild one sit at 88 per cent.
With respect to earnings, a mild recession is already priced in. In the 11 recessions since 1948, S&P 500 earnings have fallen an average 18 per cent from their peak. Given that prices average 26 per cent, Panigirtzoglou reckons that earnings account for 70 per cent of the decline in equity prices during recessions. Therefore, with the 16 per cent slide in US equities since their peak, markets are already pricing in an 11 per cent decline in earnings — two percentage points more than what normally happens during a mild recession.
The price action of the US equity market are pricing in a 16/18=88% chance of a mild recession or a 16/33=48% chance of a deep recession.

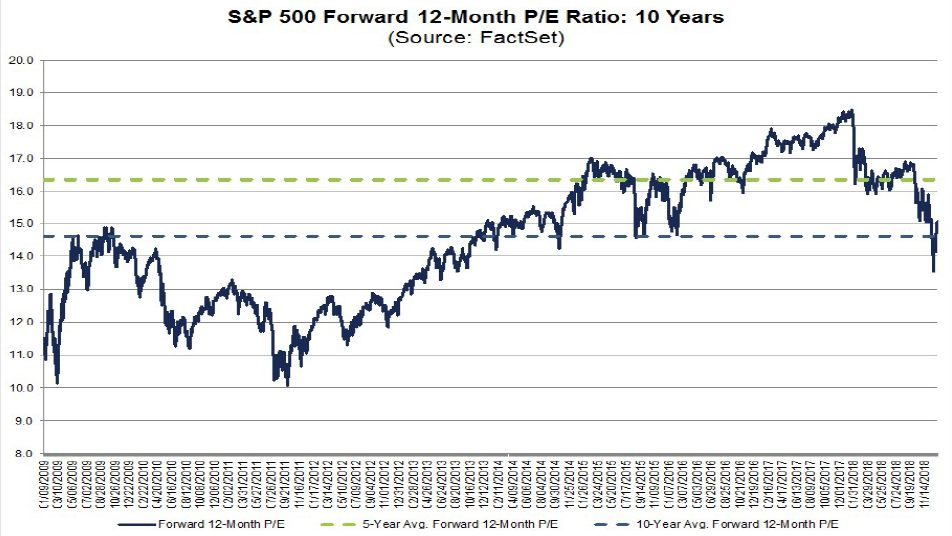
How bad can expectations get? In order to be bearish, you would have to be betting on a deep recession and a catastrophic outcome. The latest update from FactSet shows that the market is trading at a forward P/E of 15x, which is slightly above its 10 year average.
My set of long leading indicators designed to spot a recession in advance were deteriorating for most of 2018, but bottomed out just short of a recession reading in Q4 2018. While the recession warning panel is still flickering, it did not turn red and it has begun to improve marginally. New Deal democrat, who monitors high frequency economic data and splits them into long leading, short leading, and coincident indicator, gave a similar assessment:
While the nowcast remains positive, there are changes in both the long and short leading forecasts. The bad news is that the short-term forecast (roughly through summer) moved from neutral to negative this week. The good news is that the long-term forecast, for the first time in many months, moved back to slightly positive.
In summary, the stock market has valuation support. The market is moderately cheap, and it is already discounting a mild recession.
Bullish breadth thrusts
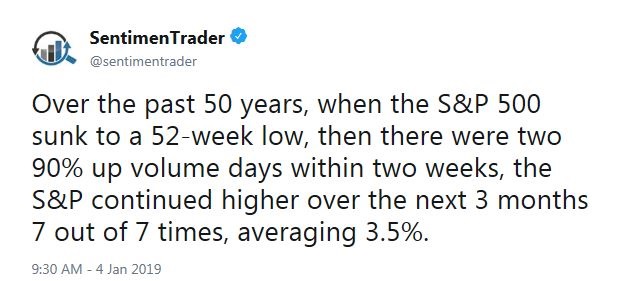
The technical picture for stock prices is also constructive. The market has exhibited a number of breadth thrusts which indicate strong upward price momentum indicator bullish conviction. The Zweig Breadth Thrust is only one of many ways that the strong price momentum is showing up. SentimenTrader also observed two strong 90% up volume days within two weeks following 52-week lows have been strongly bullish.
Wally Deemer also pointed out that the market recently experienced an episode of breakaway momentum. There have only been 11 such episodes in the last 40 years, and they have tended to be bullish.


While the market never goes up in a straight line, the historical experience of the intersection of breakaway momentum and ZBTs have resolved themselves bullishly (x-axis = trading days, y-axis=% gains).

In short, the market is enjoying valuation support and positive price momentum, which has historically been a bullish sign. What more could a bull ask for?
Negative fundamental momentum
However, some near-term risks remain. As we enter earnings season, estimate revisions have been falling, and stock prices have tended to move coincidentally with forward 12-month estimates.

In addition, top-down data has been missing expectations, as evidenced by the falling Citigroup US Economic Surprise Index (ESI), as well as global non-US ESI.

Regular readers know that commodity prices is a key input to my trend model. IHS Markit reports that its Global Metal Users PMI, which is a leading indicator of World GDP growth, is falling.

In addition, the relative returns of global industrial stocks relative to MSCI All-Country World Index (ACWI) are tracing out a rounding top, indicating cyclical deceleration.

The upcoming Q4 earnings season will be a key test for the market. It is unclear how much of a decline is already priced in. John Butters of FactSet pointed out that Q4 guidance was roughly in line with historical average:
The earnings guidance issued by S&P 500 companies for Q4 has been slightly more positive than average, while revenue guidance issued by S&P 500 companies for Q4 has been slightly more negative than average.
Watch China!
China also poses a high degree of tail-risk for investors. The Chinese economy accounted for roughly one-third of global growth and about half of global capital expenditures. This is the China bear’s favorite chart, which indicates the precarious nature of her over-leveraged economy.

In the past, Chinese debt has been less of a concern for global investors as most of it has been denominated in RMB, and therefore financial contagion risk is low. However, a Bloomberg article pointed out that external debt has ballooned to about USD 2 trillion, which is a significant level even in the context of China’s large foreign exchange reserves.

China’s economy is now showing signs of weakness, and the trade war is making things worse. Caixin reported that a UBS survey indicated that a considerable number of export manufacturers have either moved or considered moving their production out of China:
Most export manufacturers in China have already moved or plan to shift some production outside the Chinese mainland, as the Sino-U.S. trade dispute adds to existing headwinds for businesses, a survey by Swiss investment bank UBS has showed.
Thirty-seven percent of the respondents said they have moved some production out of the mainland in the past year, the bank said in a report released on Friday about the poll. Another 33% of respondents said they plan to do so in the next six to 12 months.
The trade war also creates uncertainties. A mid-level American delegation arrived and concluded a round of constructive talks last week, and the issues are becoming clear for both sides. Here is what the outline of an “easy” trade deal would look like (via the NY Times):
China is buying American soybeans again and has cut tariffs on American cars. It is offering to keep its hands off valuable corporate secrets, while also allowing foreign investors into more industries than ever before.
In addition, Beijing would roll back its retaliation for the first round of American tariffs. In addition, China is has offered some liberalization on investment in the auto and financial services sectors, and loosening of the JV requirement of forced technology transfers, though Beijing has long maintained it never forced technology transfer in the first place, and all deals were voluntary.
In return, the US may or may not roll back tariffs levied on Chinese goods since the start of the trade war.
That’s the easy deal. The difficult issue is an agreement on China’s industrial policy and IP transfer. US chief negotiator Robert Lightizer has pressed for a verification process of China’s commitments to Chinese concessions on these issues.
Leland Miller of China Beige Book appeared on CNBC to state that he believes there is tremendous economic pressure on China to reach a deal, but it will be a deal in name only. In effect, the trade deal will amount to the “easy” deal (my words, not his), and possibly some provisions of the “difficult” deal, but the enforcement of the agreement will be a function of future US-China relations. In a past CNBC appearance, Miller explained that US-China trade frictions will rise in 2020. There is a growing consensus in Washington that China is a challenge for the US, and presidential candidates will all posture to show how tough they are on China. Even if we were to see a trade truce in 2019, friction is likely to rise next year.
Political risk premium
As the Democrats take control of the House of Representatives, the chairs of the various committees are expect to investigation both Trump, his family, and his cabinet. White House staff is preparing for a deluge of subpoenas as Democrats settle into their seats. In addition, the results of the Mueller probe is likely to become public some time in 2019. The combination of all these events are likely to put tremendous political pressure on Trump and how he governs.
We have already seen a brief taste of the conflict between Trump and the Democrats during the latest government shutdown impasse. Trump has threatened to declare a State of Emergency in order to get funding for the border Wall. A decision like that is well outside constitutional norms, and it will likely get challenged in the courts. (Even if you support Trump’s potential declaration of a State of Emergency, would you also support President Hillary Clinton’s declaration under similar circumstances?)
Unilateral declarations of emergency and martial law are what happens in emerging market countries under strongman rule. Most of these markets trade at single digit P/E ratios. Should Trump provoke a such a constitutional crisis, expect the markets to begin pricing in a political risk premium to the US equity market.
Stress in the credit market
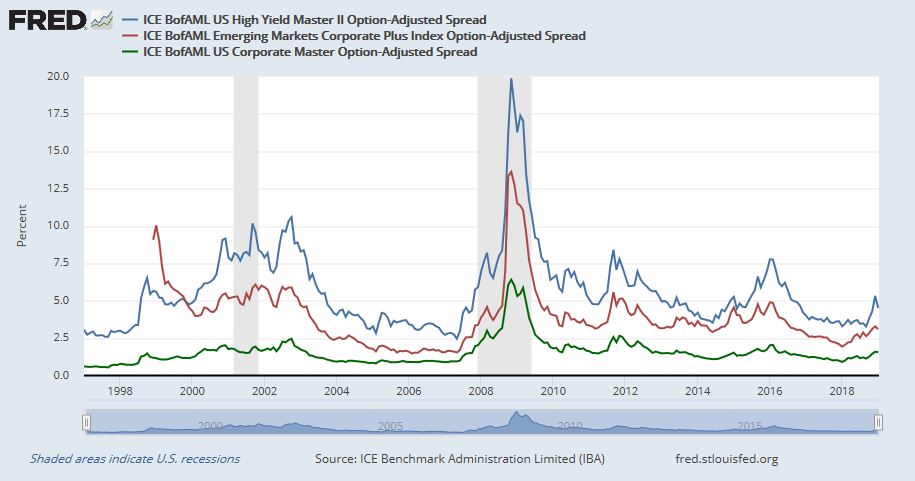
Another source of risk comes from possible stress in the credit market. On the surface, conditions appear benign. Credit spreads have widened and begun to normalize after the December risk-off episode, and levels are nowhere near the high stress readings seen in past recession.
Beneath the surface, however, the internals appear ominous. Median corporate leverage has returned to level equal to or above past market tops.

BBB debt, which is the lowest level of investment grade credit, now dominate the IG bond universe. Should the economy weaken, expect many of the BBB credits to be downgraded to junk, which would flood the junk bond market with supply in an environment of uncertain demand.

At the same time, global central banks are tightening and withdrawing liquidity from the financial system.

Notwithstanding the Fed’s slightly more dovish tone, the Fed’s tightening bias will have a negative effect on the growth of the monetary base. If history is any guide, negative growth in the monetary base has been a headwind to equity prices.

Investment implications
To sum up, what does this all mean?
My previous base case scenario had been a recession in late 2019 or early 2020, with a slowdown that begins in early 2019. Stock prices would decline, first to discount the effects of a slowdown, and later a recession. The recession would serve to unwind the excesses of the previous expansion, notably high leverage in China, and the unresolved banking problems in Europe.
In reality, stock prices declined in Q4 2018 in a steep fashion, and the market is already discounting a mild recession. Technical conditions became washed-out, and different measures of breadth thrusts are pointing to an intermediate term bottom. While a number of risks remain, none of them, with the exception of a growth deceleration, will necessarily be realized in the next six months. It is also unclear how much of the growth slowdown is already discounted in the market. Real GDP growth fell from a 3-4% annualized pace in the latter half of 2018 to about 2% in 2019, which is well above recessionary conditions.
The other risks, namely China, trade war, political risk premium, and credit deterioration from monetary tightening may not fully manifest themselves over the next six months. Undoubtedly, the market will respond to news flow from these sources of risk in the future, but their near-term resolutions are unlikely to be catastrophic for stock prices.
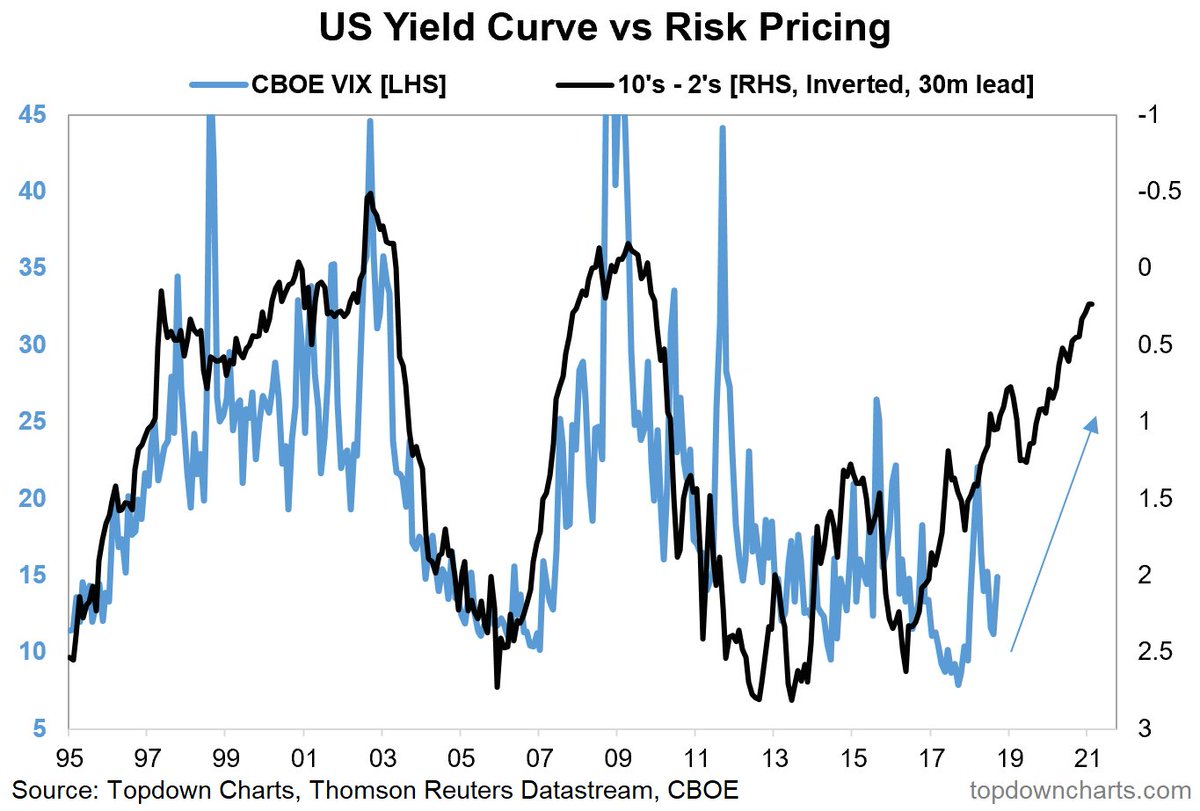
To be sure, the global economy is undergoing a tightening cycle. Callum Thomas has shown that tightening cycles, as proxied by the slope of the yield curve, tends to lead equity market volatility by 2 1/2 years.
In conclusion, I had mainly focused on the risk conditions in the past, while ignoring valuation. Today, the combination of favorable valuation and positive momentum has changed my outlook. Based on these conditions, I would expect stock prices to grind upwards for the remainder of 2019, but in a volatile manner.
Possible roadmaps
As the economy is likely to sidestep a recession, here are some possible historical patterns that the market might follow. These episodes all involved some kind of scare, but the market ultimately avoided a recession.
2011 was the year of the Greek Crisis in Europe, and a budget impasse in Washington. The market dropped, stabilized and chopped around for a few months, rallied, weakened and corrected, and then went on rise into fresh highs.

There was a growth scare at the end of 1994, when the yield curve neared inversion but did not do so. The market made a double bottom before going on to advance to new highs.

1962 was the year of the “Kennedy Slide”. There was no recession but it was accompanied by JFK’s attack on the steel industry and a “businessman’s panic”. The market’s final bottom coincided with the Cuban Missile Crisis.

From a technical perspective, the breadth thrusts were signals of the initial bottom is in, but to expect further volatility in the next few months. Don’t be surprised if the stock prices were to weaken again to test or undercut the December lows in a double or multiple bottom. Looking out 6-12 months, history tells us that returns should be positive.
Model readings
In light of my recent change in investment view, there have been a number of questions about the readings of different models. I will explain how each model is positioned, starting with the one with the longest horizon going to the shortest.
The Ultimate Market Timing Model is an asset allocation model for investors with a long-term horizon. It was designed to avoid the worst of bear markets, and minimize unnecessary trading. Its recent sell signal was based on the combination of a recession forecast, and market action based on trend following models. This model will remain at a “sell” until the composite of global equity and commodity prices start moving above their moving averages. The slow reaction time of this model is a feature, not a bug.
The Trend Model is based on, as stated above, a composite of global equity and commodity prices. Readings have shifted from highly negative to a weak neutral. Investors using this model for asset allocation should re-balance their portfolios from an underweight equity position back to their neutral target weights as specified by their investment policy statement.
The Trading Model is the one with the shortest time horizon. Last week’s powerful Zweig Breadth Thrust signal moved this model from a “sell” to a “buy” signal. Over the next week, the market advance may start to stall as it has reached a key resistance zone.

Short-term momentum (1-2 day horizon) is overbought and starting to roll over.

Longer term (3-5 day horizon) momentum remains overbought, indicating possible downside risk.

As well, the credit market`s rally stalled in the last two days of the week, while stock prices continued to grind upwards. This is another sign that risk appetite is waning.

In light of the unusual breadth thrust activity, it would be premature to turn overly bearish in the short-term. The market may pause and consolidate, or stage a minor pullback, under these circumstances. An upside breakout through the resistance zone would be highly bullish, and I am keeping an open mind as to short-term direction. Corrective action should be bought, and downside risk is likely to be restricted to only 1-2% in the coming week.
Disclosure: Long SPXL
Cam, I’m curious if you’d share with us what your personal view of neutral and minimum equity % are in trend model and Ultimate Market Timing Model. Ie neutral may be 100% normal weight in equities (for your equity component), and if bearish one might only go down to 50% equities vs your normal benchmark… I realize this may be different for every investor, but an interesting discussion possibly
These questions are really a function of any account’s investment policy, so I can’t really address that issue without knowing all the details.
Here is just a generic example (that may not be appropriate for everyone).
Target weights
60% stocks
40% bonds
Neutral weight: 60% stocks
Max weight: 80%
Min weight: 40%
How you determine the target weights is a result of the financial plan, and without a financial plan, I can’t really advise anyone.
There are some useful tools at different robo advisors for making your own financial plan. This UBS 3L approach is also a useful framework for making a plan
https://tinyurl.com/yafxpvjt
Thanks Cam. I wonder if going (for example) from 60% equity to 40% equity in a bear market is enough to meaningfully reduce drawdown for an individual investor …It certainly helps reduce career risk though for a professional investor.
As the theory goes, stock and bond prices are either uncorrelated or negatively correlated. If stocks go down, bonds either rise or do their own thing. Therefore a lower weight in equities will mitigate the effects of an equity market decline.
As for your question, it is impossible to answer without knowing the investor’s investment objectives and profile. Supposing that stocks were to fall 20%, but the overall portfolio is down 10%, is that good, bad, or ugly?
There is no good answer to that. It all depends on an individual’s pain threshold, time horizon, and other objectives. For example, selling out to take a profit may be negative for the investor, as he gets saddled with a tax liability, even assuming that he knew ahead of time the market is going to fall.
It also depends on the investor’s time horizon. If you are 35, do you really care that much about a 10% blip in your retirement portfolio as long as asset prices behave the way you expect them to over the next 30 years?
If readers have taken Cam’s advice, they would have been underweight equities going into this 20% decline. The shortness of the decline, three months, followed by the speed of the thrust up has likely left many, no most, still underweight and wondering what to do now.
This leads to a whole suite of behavioral economic biases to make an investor make mistakes. One’s first instinct is to hope for a pull-back to buy at a lower price. This is called anchoring bias. A person anchors on a previous low price rather than the bigger picture. Then we have confirmation bias which will have us reading with great interest all things that confirm what we are hoping. This blog post has two parts. The first is a long explanation of why we likely made a firm intermediate low. The second is why markets might still go down which includes some stats on a decent chance of a double bottom. Confirmation bias will have the pull-back section resonating for you. Behavioral forces urge us to wait for that.
But, the Sentimentrader newsletter talks about extremely high percentages of higher markets six and especially one year from these lows. Stepping back, should an investor possibly miss a very good long term gain by hoping for a 50% chance of a pull-back. Is this not an example of “Perfect is the enemy of the good”?.
Let me say this, if an investor does try for a pull-back and instead markets go up., it’s virtually impossible to jump onto the train again any time soon. Been there, done that.
It’s all behavioral. I strive not to put myself into these future impossible situations.
In my experience, the longer term portion of a portfolio is best treated like turning a big ship. The shorter term trading portion is where an investor should aim for timing perfection.
Great point. The hardest trade to make here is to go long into a highly overbought (short-term) market coming off a v-bottom. The easy trade is to wait for the “inevitable pullback”… Since when does the market make it easy?
One thing I’m wrestling with is the Fed Funds Futures market.
If the Fed meets and actually drops the Fed Funds Rate several times over many meetings, this is a very bullish signal to kick off a new bull market. It cures the ills of the important interest rate sensitive sectors of the economy like housing and autos. It unleashes consumer spending.
But what if, as we’ve seen lately, there is just a huge drop Fed Funds Futures that predicts a future drop without any action by the Fed? Should we treat this the same as a bull market indicator as in the first example?
I’m truly scratching my head here. Please let me know any ideas.
I don’t think the market needs rate cuts here. It just needs the hikes to stop. Fed won’t be raising until at least the June meeting. And likely we will be seeing the slowdown in the lagging data reports in June so Fed will have an excuse to take a pass. IMHO September of December is the soonest we could see additional hikes but only if the marketing is trading at new highs by then.