Preface: Explaining our market timing models
We maintain several market timing models, each with differing time horizons. The “Ultimate Market Timing Model” is a long-term market timing model based on the research outlined in our post, Building the ultimate market timing model. This model tends to generate only a handful of signals each decade.
The Trend Model is an asset allocation model which applies trend following principles based on the inputs of global stock and commodity price. This model has a shorter time horizon and tends to turn over about 4-6 times a year. In essence, it seeks to answer the question, “Is the trend in the global economy expansion (bullish) or contraction (bearish)?”
My inner trader uses a trading model, which is a blend of price momentum (is the Trend Model becoming more bullish, or bearish?) and overbought/oversold extremes (don’t buy if the trend is overbought, and vice versa). Subscribers receive real-time alerts of model changes, and a hypothetical trading record of the those email alerts are updated weekly here. The hypothetical trading record of the trading model of the real-time alerts that began in March 2016 is shown below.

The latest signals of each model are as follows:
- Ultimate market timing model: Sell equities
- Trend Model signal: Neutral
- Trading model: Neutral
Update schedule: I generally update model readings on my site on weekends and tweet mid-week observations at @humblestudent. Subscribers receive real-time alerts of trading model changes, and a hypothetical trading record of the those email alerts is shown here.
Confident about a slowdown?
Recently, a number of prominent investors and analysts, including Jeff Gundlach, David Rosenberg, and Ed Yardeni, have warned about an ominous recession signal from the Conference Board’s consumer confidence survey. Ed Yardeni’s analysis of the present situation to expectations spread was especially ominous for equity investors.
Fuggedaboutit! The American economy isn’t going into recession. Call me bullish, but with a caveat.
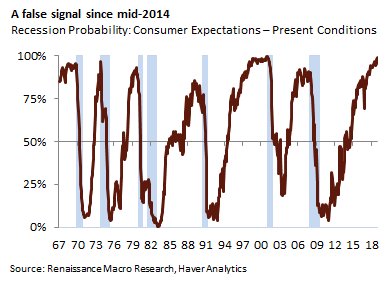
A false signal
To be sure, there are numerous signs that confidence indices of all stripes are rolling over, starting with the University of Michigan consumer confidence index.

NFIB small business confidence is coming off its highs.

However, Renaissance Macro pointed out the recession probability signal based on present conditions to expectations spread recession indicator is at 100%, but it has been elevated since mid-2014. This is not a reliable and actionable indicator.
The consumer revival
If you are worried about the American consumer, then ask yourself why real retail sales are continuing to make new highs? Past recessions have usually been preceded by a peak in real retail sales.

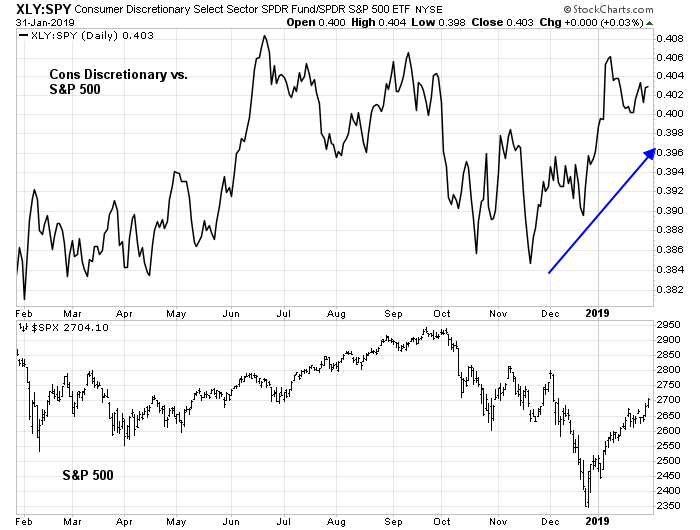
Over on Wall Street, the relative performance of consumer discretionary stocks have been rising. Most notably, the turnaround even as stock prices plunged in December and continued as the market rallied.
In addition, the housing sector, which is the ultimate form of cyclical consumer durable, is showing signs of a turnaround. November new home sales surged and handily beat Street expectations last week. In addition, the relative performance of homebuilding stocks have begun to turn up as long rates have fallen. Similar the pattern of consumer discretionary stocks, this group’s relative uptrend occurred ahead of the stock market selloff last December.
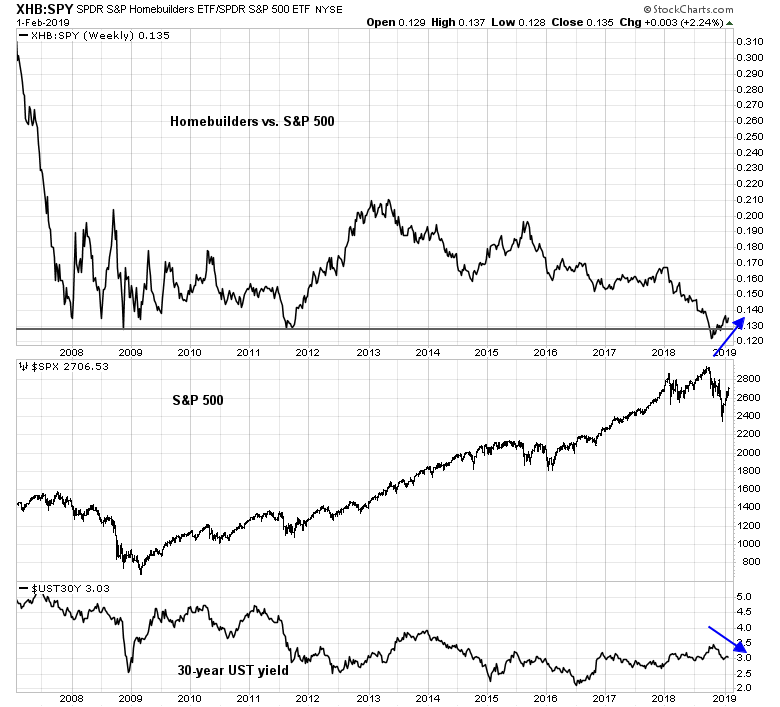
Do these charts look the market signals of a weak consumer to you?
Possible growth scare ahead
This doesn’t mean that equity investors should entirely shrug off downside risk and the bulls won’t have clear path up to all-time highs. Prepare for some volatility as there may be a growth scare ahead.
I am indebted to the work of New Deal democrat, who has been monitoring high frequency economic data and categorizing them into coincident, short leading, and long leading indicators. This framework is highly useful for understanding the growth outlook in different time frames. His latest update has pointed to persistent readings of short-term weakness that will become evident mid-year, but a long-term (one-year) strength indicating low recession risk.
The long-term forecast and the nowcast are slightly to the positive side, while the short term forecast is slightly negative for the fourth week in a row. Some of this is due to the government shutdown, so we will have to wait several more weeks to see is the changes are real.
The signs of short-term weakness into mid-2019 could be mistaken by analysts as the basis for a possible recession. Cue the growth scare going into Q2. Troy Bombardia also observed that the ECRI Weekly Leading Indicator has been consistently negative, which is another worrisome sign.

Another warning sign for equity investors is the continuing downgrade in forward 12-month EPS estimates. To be sure, stock prices have held up well during a Q4 earnings season whose beat rates are roughly in line with long-term averages, but how long can stock prices defy the gravity of negative fundamental momentum?
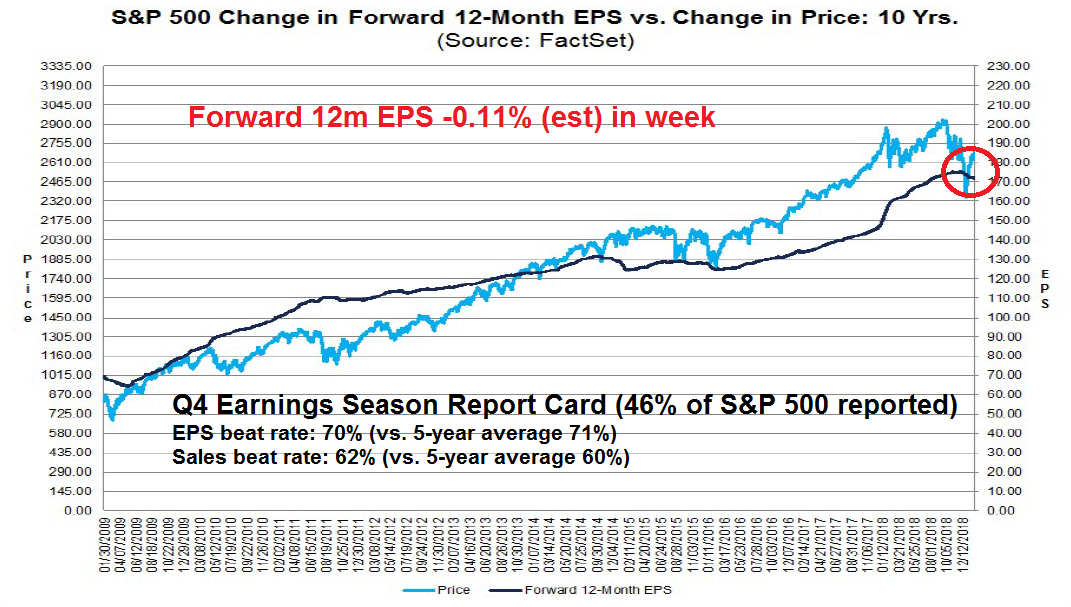
The chart below depicts quarterly actual and estimated earnings. If New Deal democrat is right about economic weakness in Q2, then equity investors should be prepared for either downward revisions in Q2 EPS estimates, or downside reporting surprises.

Waiting for the “you won’t want to buy” moment
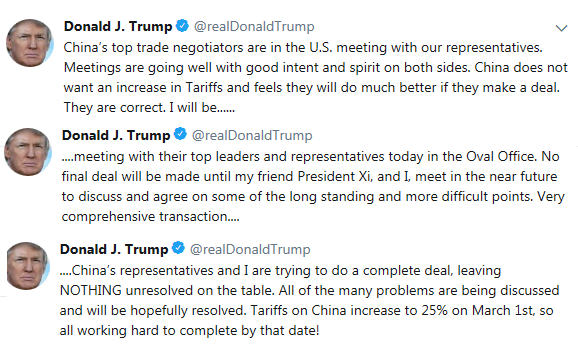
For now, the current newsflow of a dovish Fed and a likely US-China trade deal is tilting sentiment and price momentum bullishly.
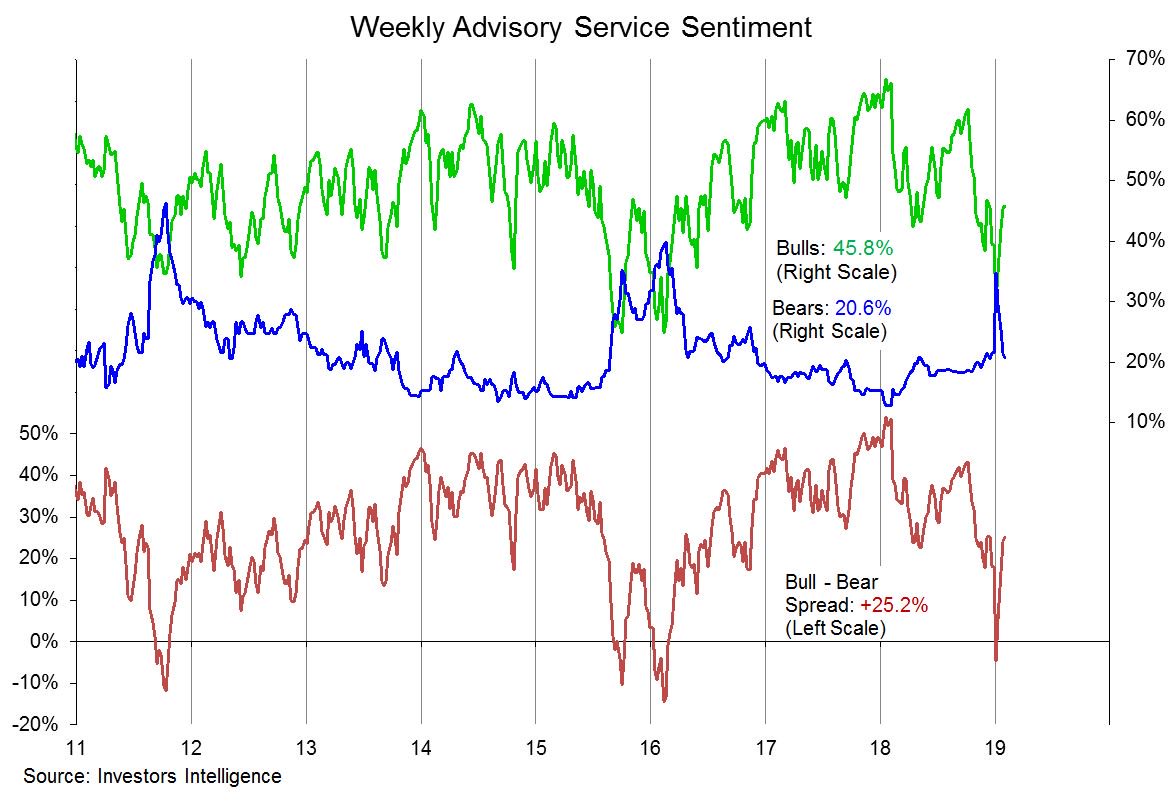
However, I am concerned that the late December bottom seemed too easy. II sentiment has normalized, and % bears spiked only briefly above % bulls. These readings are inconsistent with past durable intermediate term bottoms.
Another worrisome sign evident during this rebound rally is the lack of apparent leadership. The relative performance of NASDAQ and small caps are not showing signs of sustainable leadership. If this rally were to carry itself further, what’s going to lead the way?

There is a trader’s adage on Wall Street that when it’s time to buy, you won’t want to. There are too many investors and traders who are too eager to buy the dip.
It is difficult to see how the market could fall without some bearish catalysts. We have to wait for the “you won’t want to buy moment”, which may occur when the market hits the growth scare speed bump in the coming weeks.
In conclusion, the US economy is unlikely to enter a recession based on long leading indicators, barring a full-blown trade war. However, investors should expect a growth scare going into Q2. In light of the powerful short-term price momentum in stock prices, timing the inflection point between rebounding optimism and a growth scare will be a tricky task.
I remain cautiously intermediate term bullish on equities. However, should the growth scare become the dominant narrative in the coming days and weeks, it could become the trigger for a re-test of the December lows. If that were to occur, investors should look through the “you won’t want to buy” fears to step up and load up on equities.
The week ahead
Looking to the week ahead, the market may be nearing a key technical inflection point. Rather than make a decision on the likely direction, my inner trader believes it would be more prudent to allow the market action tell us the likely short-term direction.
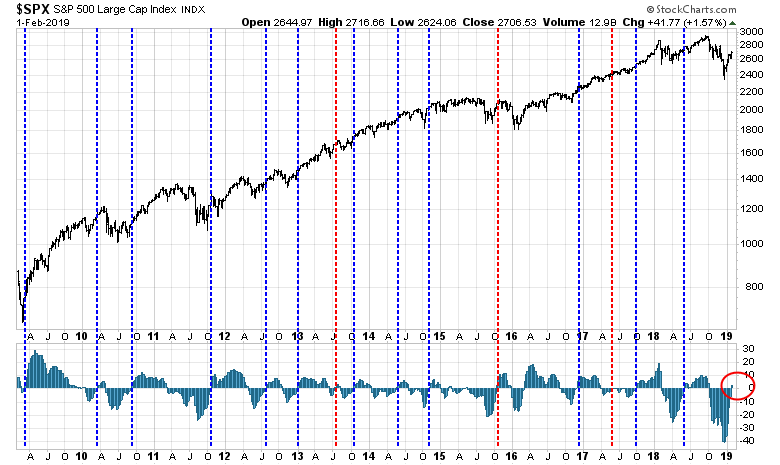
The intermediate term bull case rests with the continuation of positive price momentum. The SPX exhibited a positive MACD crossover on the weekly chart. The 10-year record of past signals have been mostly bullish (blue vertical lines) with only a small minority that resolved bearishly (red lines).
On the other hand, I remain open to the possibility of a W-shaped bottom, especially in light of the likely economic softness starting Q2. A study of market history by Andrew Thrasher concluded that the market needs to clear the 100 and 200 dma in order to reduce the risk of a re-test of the December lows.
Going back to 1960, after a 15+% decline while the market has remained below its 100-day and 200-day Moving Average, the risk of a retest or a lower high were high. But once we cleared these intermediate and long-term MAs then the risk diminished.
Troy Bomardia’s historical studies came to a similar conclusion. Most retracements of “crash and rally” patterns stall either at the 50% retracement or 200 dma. However, they can turn back higher, and strength can persist all the way to all-time highs before retreating.
So where does that leave us? The SPX rallied through a key downtrend last week, indicating persistent strength, which is bullish. However, the index ended the week just below its 100 dma, as well as the 61.8% Fibonacci retracement level. In addition, the VIX Index (bottom panel) closed Friday just shy of its lower Bollinger Band, which are levels where past stock market rallies have begun a pullback.

Breadth indicators offer little clue to direction. On one hand, the market is overbought, but one of the most bullish things a stock market can do is become overbought and stay overbought. On the other hand, readings have pulled back from an extreme overbought condition that is reminiscent of the pattern displayed after the last Zweig Breadth Thrust buy signal in 2015 when the rally stalled and prices pulled back.

My inner investor is neutrally positioned at roughly his policy asset weights. My inner trader is stepping aside until the market can flash further clues to market direction.
5 thoughts on “Recession ahead? Fuggedaboutit!”
Comments are closed.
What is happening now is very similar to early 2016 with an outcome then that led to a new bull market starting.
At that time we had the first Fed rate hike in seven years in December 2015. The Dot Plot and investors projected higher and higher Fed rates into the future. Then miraculously, bond interest rates FELL almost one percent rather than going up. The Fed had stayed dovish because of stock market turmoil including junk bond spreads blowing out.
In late 2018, we saw the same surprising turn dovish from Powell’s Fed with Fed Futures plunging from two expected increases in 2019 to one projected drop. Rosenberg has looked at Powell’s comments in Fed meetings going back since he joined the Fed as a governor and he expected Powell to be a hard-nosed hawk that wouldn’t cave to market pressures. He was wrong. It’s one thing to comment on another Fed chief’s program and a different thing when any recession/depression mistake is on you for history to judge. This new dovish Fed Chair is the biggest new factor.
In early 2016, I was saying that we were in a new environment, a Moonless economy and stock market. This is one where the Moon (the Fed) is gone and the tides no longer cause general big swings in the economy and stock market like they did when the Moon caused huge interest rate waves to hit all sectors every cycle. I thought maybe a Powell Fed would bring the Moon back, but no. We are Moonless.
In a Moonless economy/stock market industry sectors go through their own business and bull/bear stock market cycles. For example, housing has gone through a recession over the last year as mortgage rates went up. Now with rates falling, they start their own bull market. In 2018, retail got a boost from low gasoline prices and confident post-taxcut optimism that are now ending and maybe they have their own recession/bear market. I see energy and mining are leaders from the low. Are commodities going into a bull market with the global economy set to turn up?
You get my drift. Look at each sector on its own rather than as part of an ocean of stocks waiting for the Moon to shift the tides.
In early 2016, a confirmation of a new bull market was the junk bond spread tightening after blowing out big in 2015. We are now seeing spreads fall sharply. This time we didn’t see as big a spread widening as 2015 but it was significant and a worry that is now receding.
In early 2016 as we started that new bull market, I was saying at the time that a new bull market stocks stays overbought so waiting for an oversold pullback like we used to get prior to the important low like Demember 24th, is not a good idea. Cam is saying the same thing in this blog.
Consumer spending is over 70% of the U.S. economy so a mild recession in that sector would be a challenge for other sectors (including other countries) that are growing to offset to keep a bull alive. But back in 2015/16, stable areas of the S&P 500 in that Moonless market (tech, healthcare, staples, utilities), offset the depression in oil and commodity sectors and recession forces in global stocks.
Welcome back to the Moonless economy and stock market. Thank you Mr. Powell. You had us worried for a while but thanks.
Thanks Ken, for your insights, and also your take on our Del Norte friend David Rosenberg. Like early 2016, you made a point of a new bull meet starting, you are making a similar case now. I quote you;
“Cam is saying the same thing in this blog”.
Reading through what Cam has written, with due respect, I do not see if you and Cam are on the same page. Cam is making the classic argument of a significant GDP pull back in Q2, pulling down earnings per share. This would in turn make equity pricing look expensive likely causing a retest of the Christmas (to remember) 2018 bottom. He has supported his argument with many technical indicators, in a manner that is par excellence. ECRI’s data, the massive retracement to 100-200 DMA, or Fibonacci retracement of 61.8%, the long term weekly bull-bear numbers (with too few bears), all pointing to a bottom that appears to be less than durable. For sustained equity highs, there has not been sufficient pain in the markets. Bulls are still leading the ship, but with no leadership (yes, your sectorial analysis is well received; tech on one end of the volatility spectrum, staples and utes on the other end of the volatility barbell and healthcare, nicely in the middle and we can forget the other sectors of the economy; housing is just to volatile with low margins).
Cam, it would help your readers, if you would clarify your position. Thanks again, for another fine write up of underlying technicals of the market.
To clarify, I am bullish and bearish over different time frames.
Bullish longer term: The ZBT signal means that the market is well supported and likely higher by year-end.
Cautious over the next 2-4 months: Expecting a stall near term, and a correction with a possible re-test of the December lows. No guarantees that it will pull back that far, it will depend on the bearish catalyst, and how panicked the market gets.
Thanks.
Wild cards:
Unrelated to my comments above, I remain circumspect whether the Fed is going to be that benevolent. I feel as though the Fed remains a big wild card.
Janet Yellen’s yesterday’s comments that the Fed is ‘seen” to be independent (= above political influence), to inspire confidence in the US, is what I believe will be the guiding hand. Yes, the Fed, for now, may have thrown a lifeline to the stock market, but in the end, it must slowly, deliberately, reduce its balance sheet, try and push Fed funds rates towards beyond neutral, so that it has enough fire power, to stave off the next recession.
Ken talks about a commodity cycle turning up (this has been talked about for a few year now). Presuming, that were to happen, it would be dollar bearish, and inflationary. Both would also be recessionary to the US (as commodity cycle upturn would be driven by non-US actors, indicating higher non-US growth, relative to the US). Such events would push the Fed to raise rates.
So, where does China and India (=commodity users and higher spectrum of global growth) fit into all this?
Let us take the case of China first. China is likely to use satellite economies (= entire Asia and Europe), to raise economic activity and profits for Chinese companies). The Belt and road initiative is one cog in this wheel. Chinese capital investments in Emerging Europe, and Asia, will be one tool for China to keep expanding its GDP. Such growth is not likely to come out of mainland China itself. Trump polices to cordon off China and protect “American” intellectual property may be successful in the mid term. China is going to counterbalance this by investing in other avenues I have noted here, including Australia, and Canada (read oil and gas, rail roads, mining, farming, if permitted).
India remains on a growth trajectory, especially if 2019 elections put Modi and his party back in power. Despite political morass, India remains on a sustained secular growth trajectory, for the foreseeable future. All bets are off, if Mr. Modi, were to loose in 2019. So far, India has not promoted significant Chinese capital investment. China and India could deliver 6-8% GDP growth for the foreseeable future (China at the lower end of that spectrum).
Hard Brexit (and Britain) does remain a significant side issue and possibly a catalyst for Cam’s double bottom, circa mid year 2019. China will make a foray to wave a carrot to an Emerging Britain. It may open doors for Chinese capital to find its way into UK. If there is a messy Brexit, the pound needs to approach parity to the US $ or lower. Britain will need to gain its own credit rating. British bonds/guilds could become attractive investments as prices come down. And yes, it will be inflationary, impoverishing the common English citizen. Britain will need to raise capital in a hurry by selling family silver and China will be there with capital to invest. We saw such a situation in New Zealand circa 1984 (though NZ is a no nothing handkerchief of an economy), but the conditions are similar. NZ sold off NZ telecom (to Ameritech and Bell Atlantic), NZ rail (to Wisconsin rail), NZ Air (to public), Forestry (to public), and other assets that I do not remember off hand. Yes, Britain will need this mechanism to shore up its coffers, support the pound and stave of a massive sell off in the pound (we saw the Kiwi $ meet a similar fate in 1984). I am sure China will be very interested in investing in British assets, owned by the Crown, as they come into liquidation. Another outcome to Brexit could be “throwing the can down further” and we shall be back to the same quagmire where we are in now, and if that were to happen, nothing of what I have written would see the light of the day.