Preface: Explaining our market timing models
We maintain several market timing models, each with differing time horizons. The “Ultimate Market Timing Model” is a long-term market timing model based on the research outlined in our post, Building the ultimate market timing model. This model tends to generate only a handful of signals each decade.
The Trend Asset Allocation Model is an asset allocation model which applies trend following principles based on the inputs of global stock and commodity price. This model has a shorter time horizon and tends to turn over about 4-6 times a year. In essence, it seeks to answer the question, “Is the trend in the global economy expansion (bullish) or contraction (bearish)?”
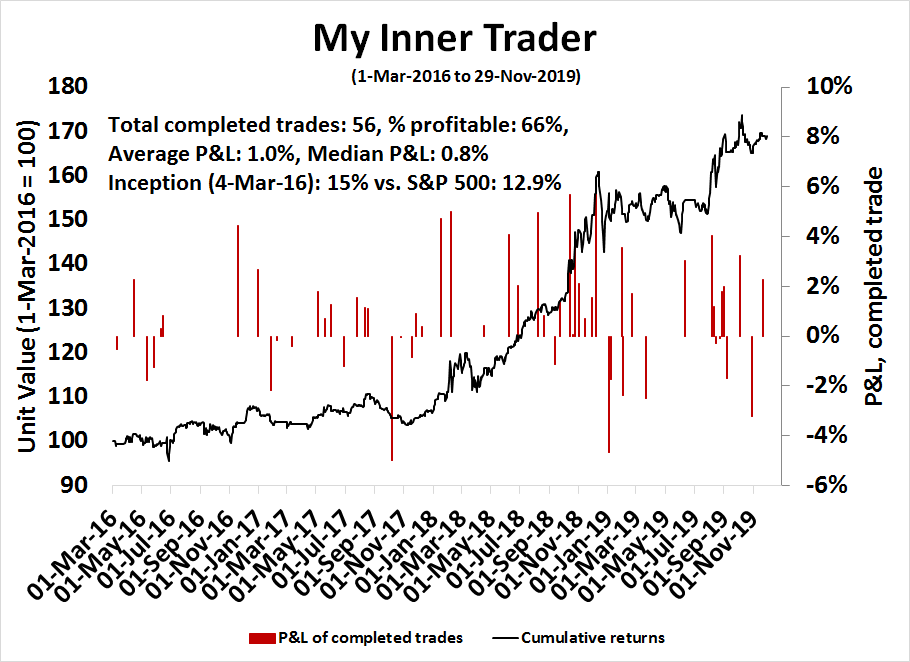
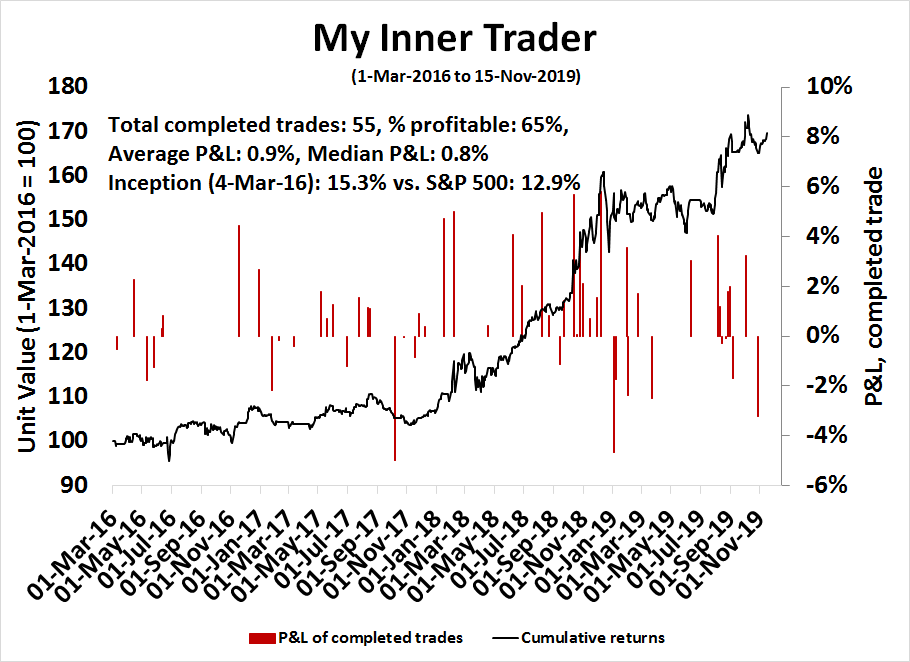
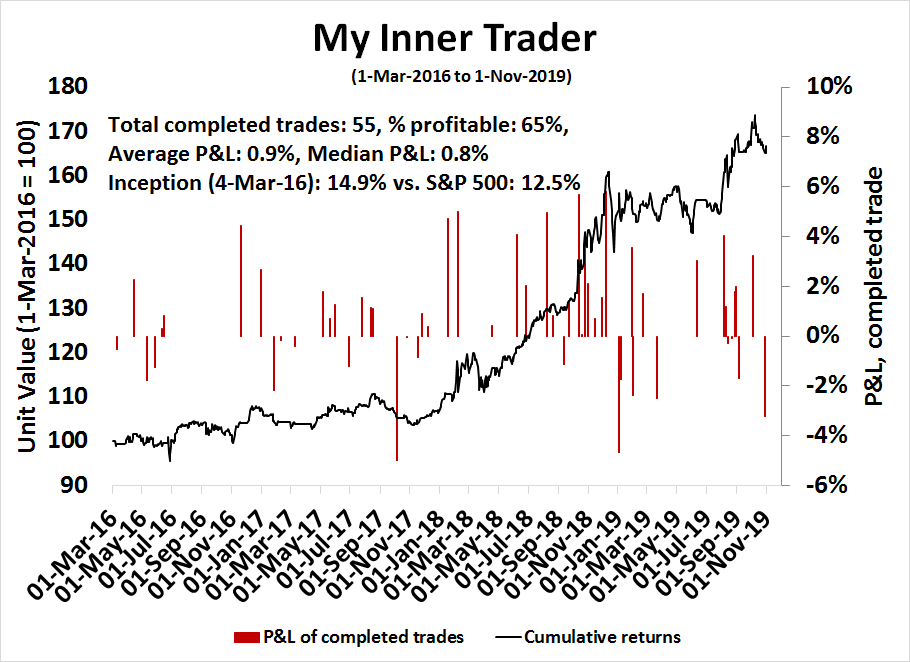
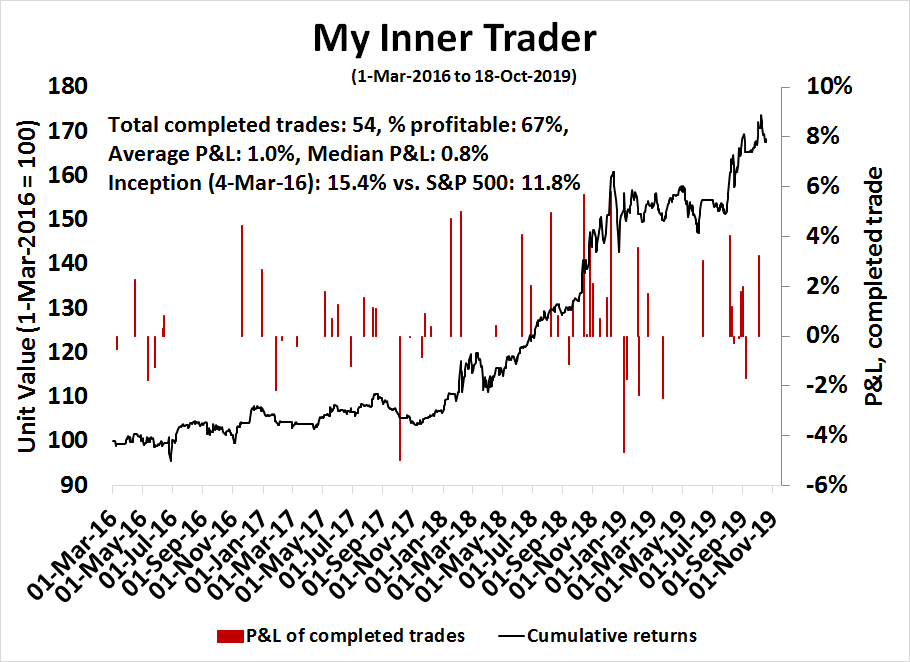
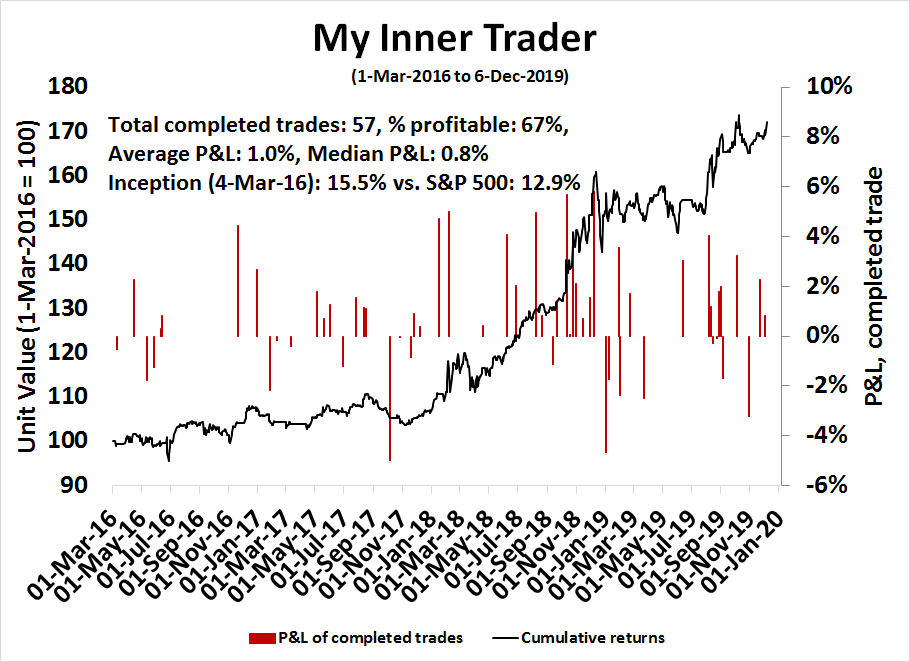
My inner trader uses a trading model, which is a blend of price momentum (is the Trend Model becoming more bullish, or bearish?) and overbought/oversold extremes (don’t buy if the trend is overbought, and vice versa). Subscribers receive real-time alerts of model changes, and a hypothetical trading record of the those email alerts are updated weekly here. The hypothetical trading record of the trading model of the real-time alerts that began in March 2016 is shown below.
The latest signals of each model are as follows:
- Ultimate market timing model: Buy equities
- Trend Model signal: Bullish
- Trading model: Bullish
Update schedule: I generally update model readings on my site on weekends and tweet mid-week observations at @humblestudent. Subscribers receive real-time alerts of trading model changes, and a hypothetical trading record of the those email alerts is shown here. As well, please join and “like” our Facebook page here.
Tariff Man returns
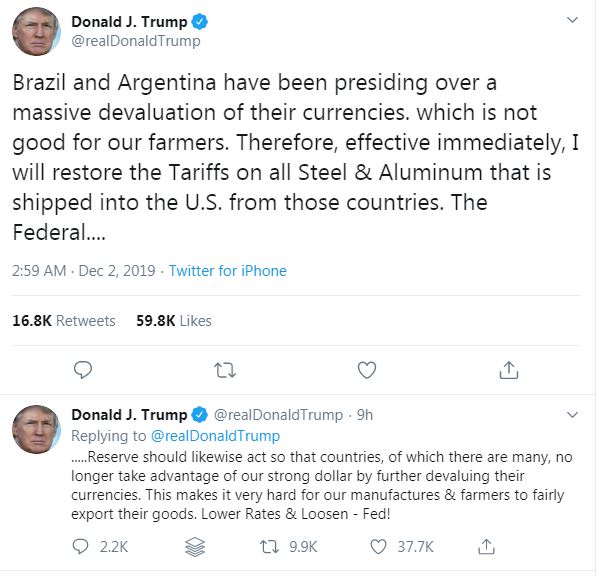
The markets took on a decided risk-off tone early last Monday when President Trump, aka the Tariff Man, made an early morning tweet to announce steel and aluminum tariffs on Brazil and Argentina.
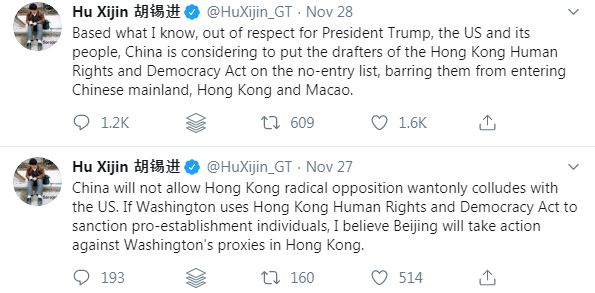
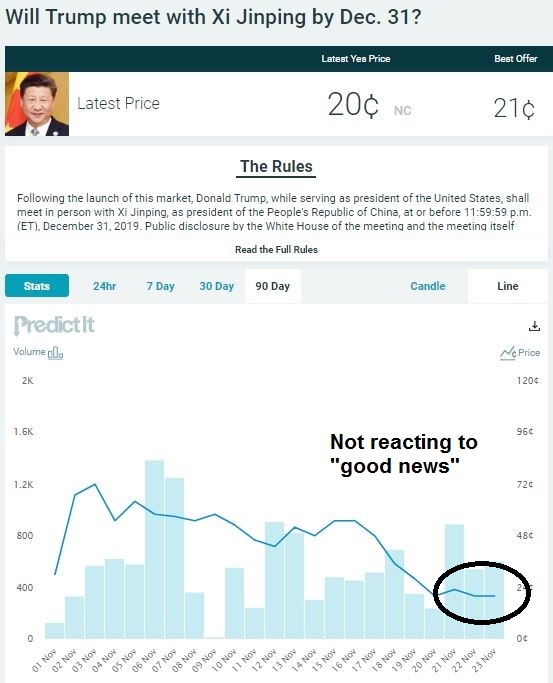
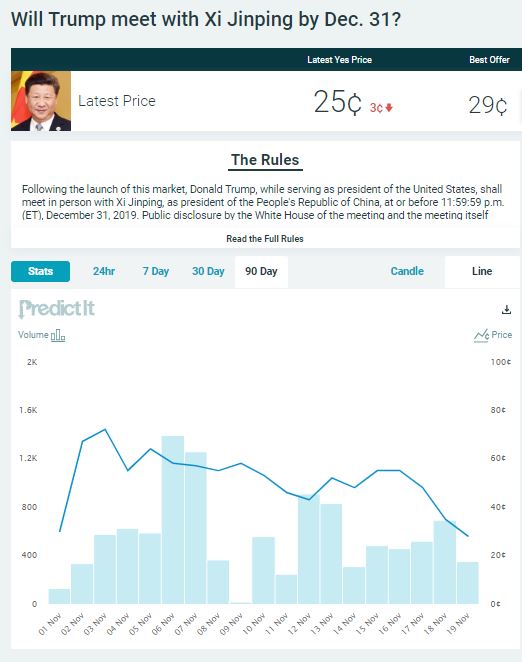
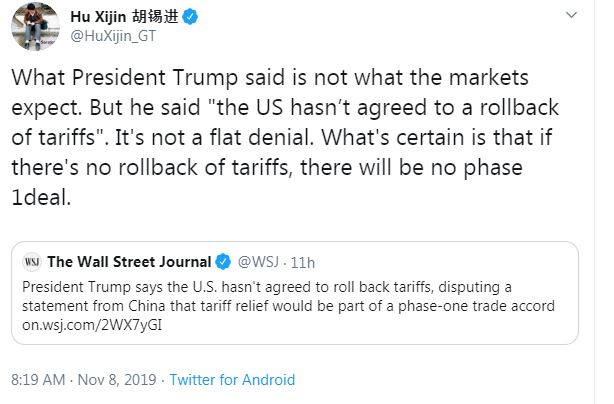
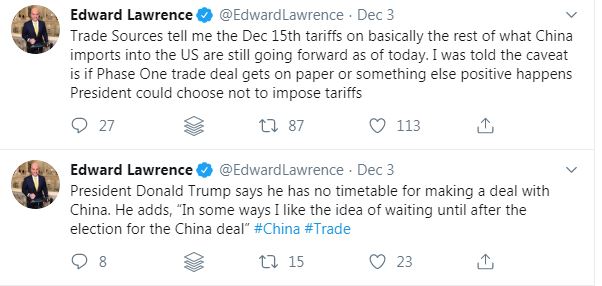
The markets took further fright based on Trump’s comment that he had no timetable for a trade deal with China, and he was willing to wait until after the 2020 election to conclude an agreement. More importantly, Edward Lawrence of Fox Business reported that there are no current plans to delay the next round of tariffs scheduled for December 15, which is an unanticipated development as the market consensus was they would be delayed.
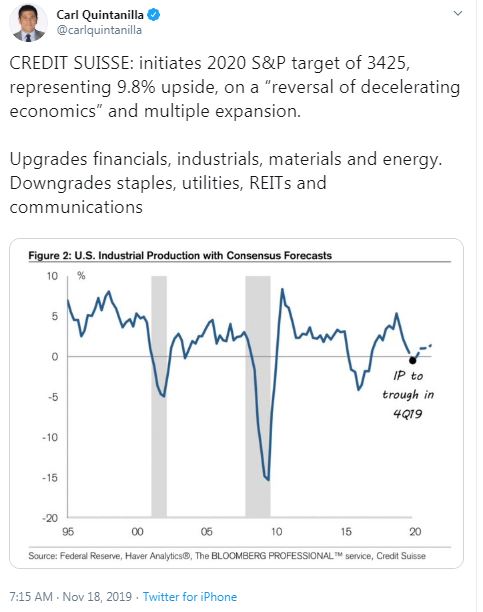
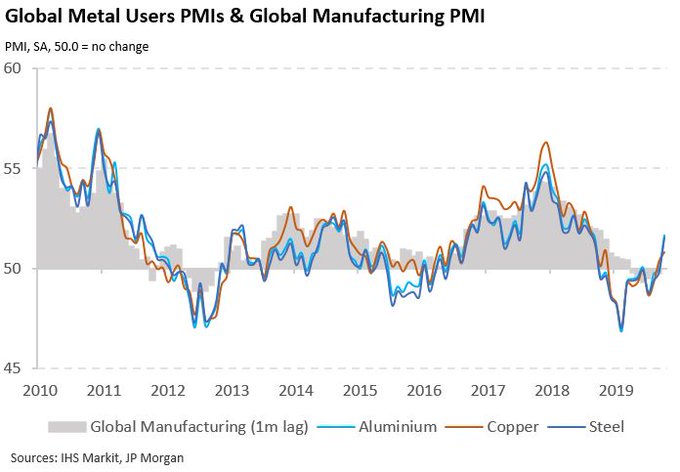
If the December 15 tariffs are enacted, what is the expected damage? How will that affect my thesis of a cyclical rebound (see An upcoming seismic shift in factor returns)?
I conclude that the reflation thesis is still intact. Both Fed policy and European fiscal policy stand poised to offset the negative effects of Tariff Man’s threats. In addition, the Fed’s study concluded that most of the negative effects on business confidence has already been felt, and stock prices have risen during that period despite Trump’s trade war.
Assessing the damage
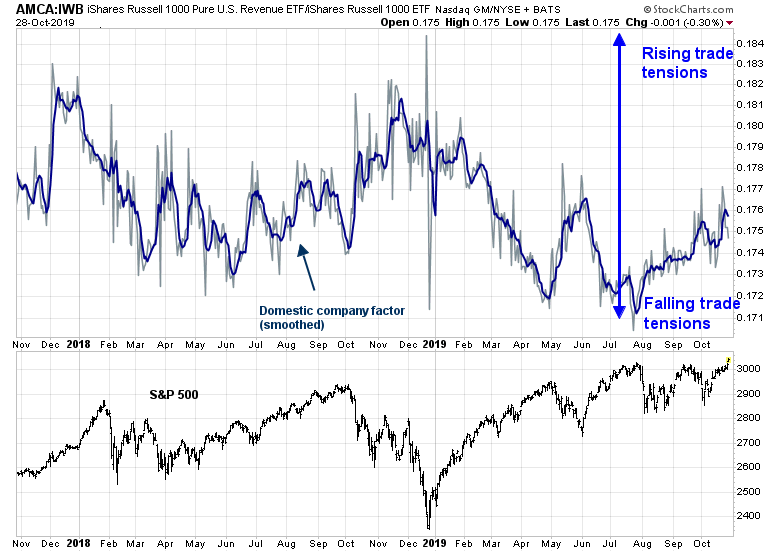
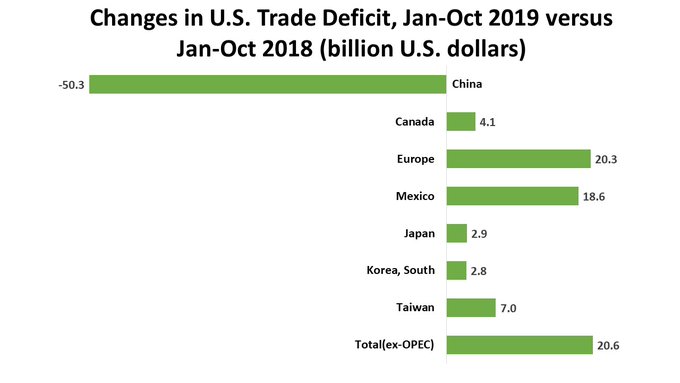
What’s the damage from the trade war? Analysis from David Dollar of the Brookings Institute finds that the direct effects of the tariffs may be less than meets the eye. To be sure, the Sino-American trade war has depressed Chinese imports into the US. But instead of achieving his objective of bringing manufacturing jobs back to America, Trump’s trade has become a game of whack-a-mole as imports from other countries have risen to compensate. Another way of thinking about the issue is the capital account, which is the mirror image of the current account, which is composed of trade of goods and services. Tariffs on goods shifts the pattern of trade, but they have relatively little effect on the capital account.
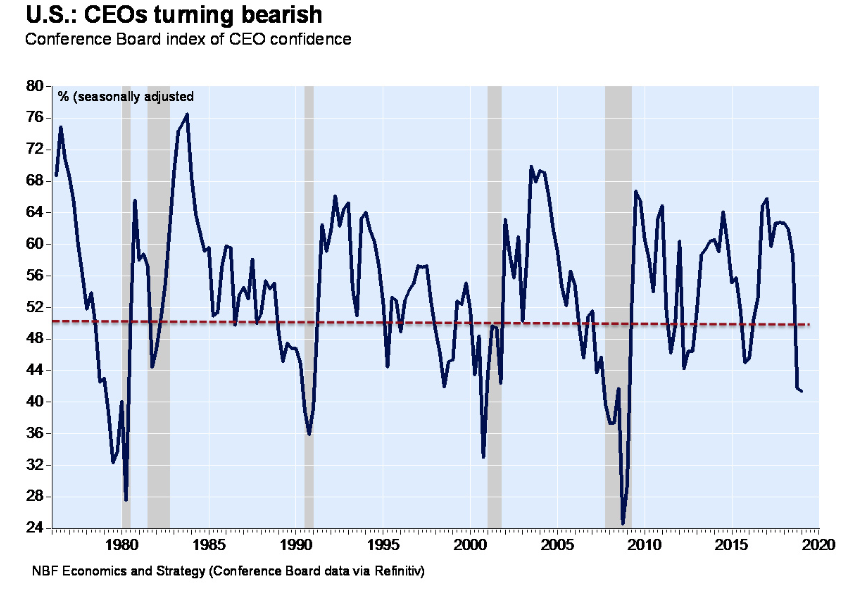
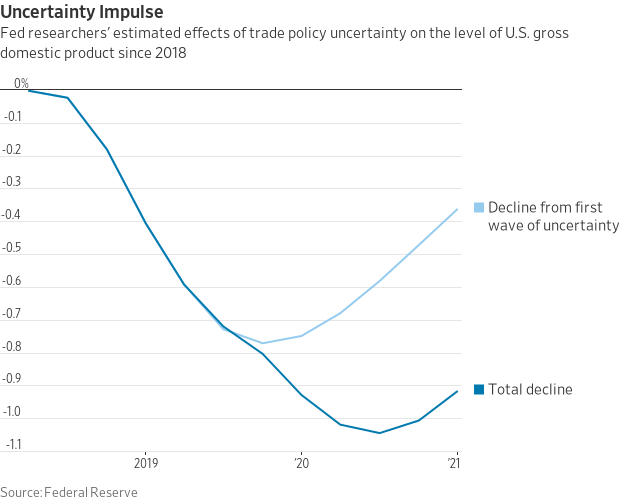
The indirect effects of the trade war has been on business confidence, which slowed business investment. A recent Fed study tried to assess the likely damage to business confidence from the tariffs. It concluded that the current tariff regime had decreased GDP growth by 0.7-0.8%. The implementation of the scheduled December 15 tariffs would take an additional 0.3% off GDP by mid 2020. In other words, most of the negative effects of the trade war has already been felt. Remember, the current regime of tariffs on about $350 billion on Chinese goods in a trade war would have been between a medium risk and worst case analysis in 2017.
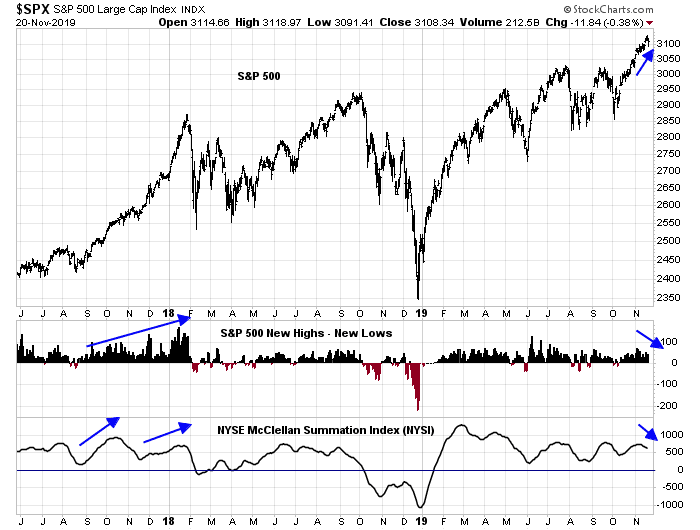
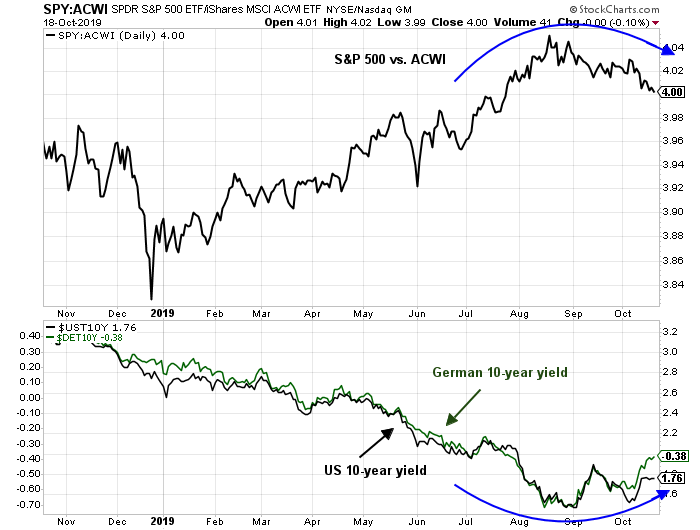
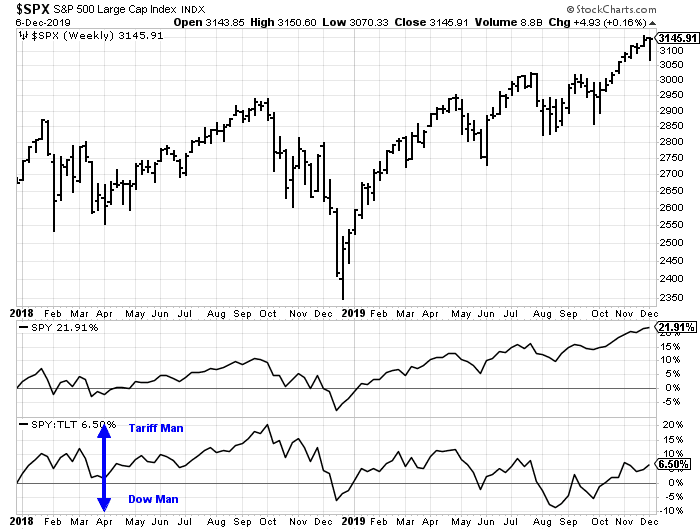
What does that mean for stock prices? The empirical evidence says, “Not much.” SPY has risen about 22% on an unannualized basis during that period. The bottom panel of the chart shows the relative returns of SPY relative to long Treasuries (TLT), and stocks are still ahead of bond by 6.5%. A strong SPY to TLT ratio gives room for Trump’s Tariff Man persona to be dominant, as he will believe the market and economy are strong enough for him to flex his economic muscles. By contrast, a weak SPY to TLT ratio will cause the Dow Man persona to emerge, as Trump has shown himself to view the stock market to be a barometer of his Presidency.
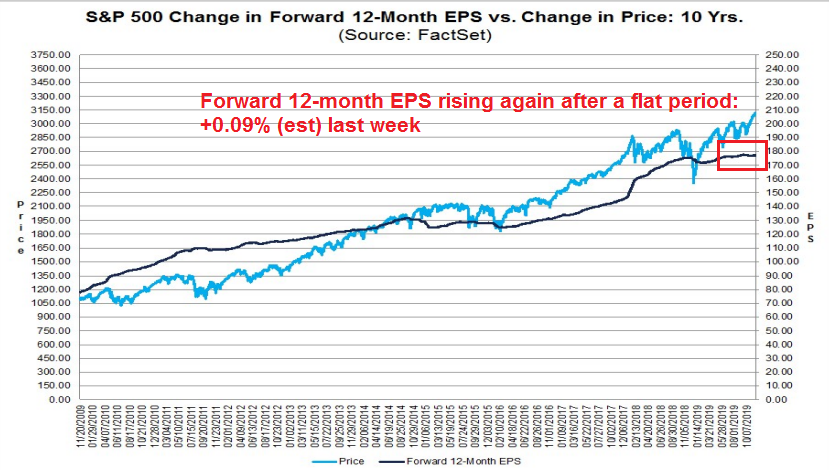
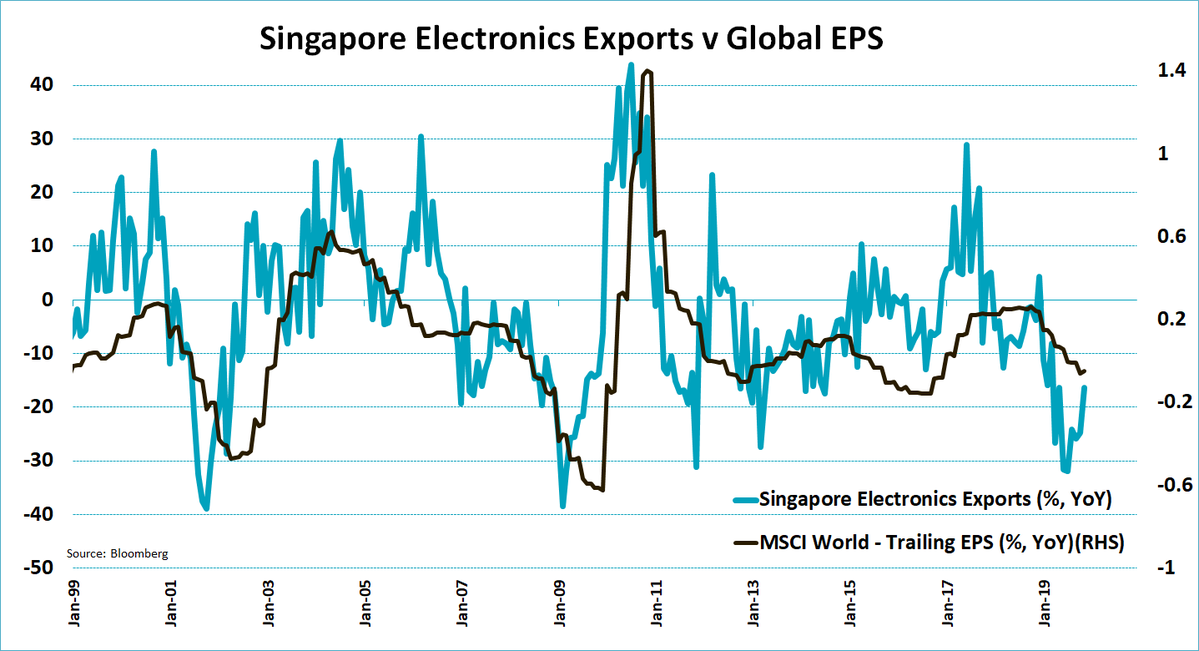
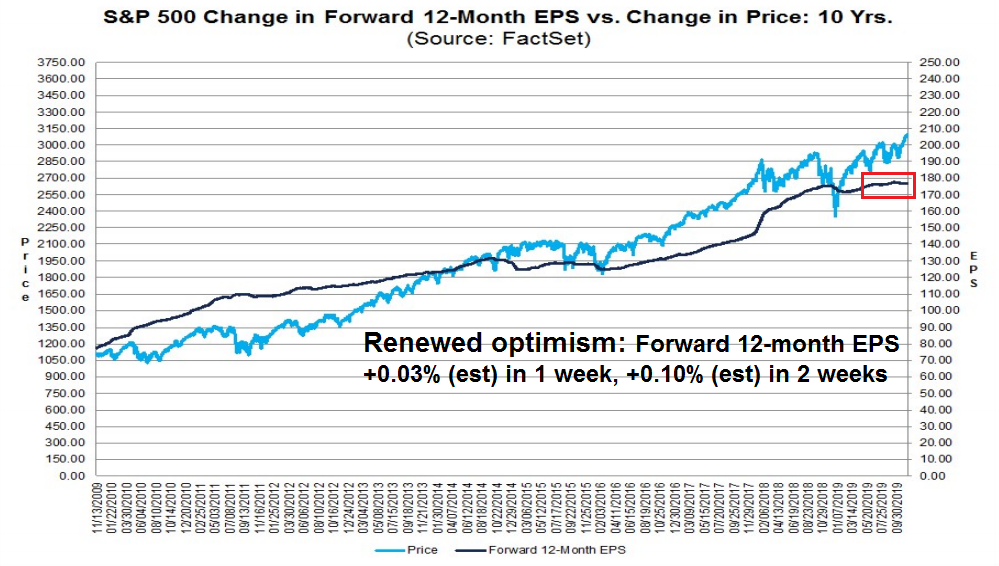
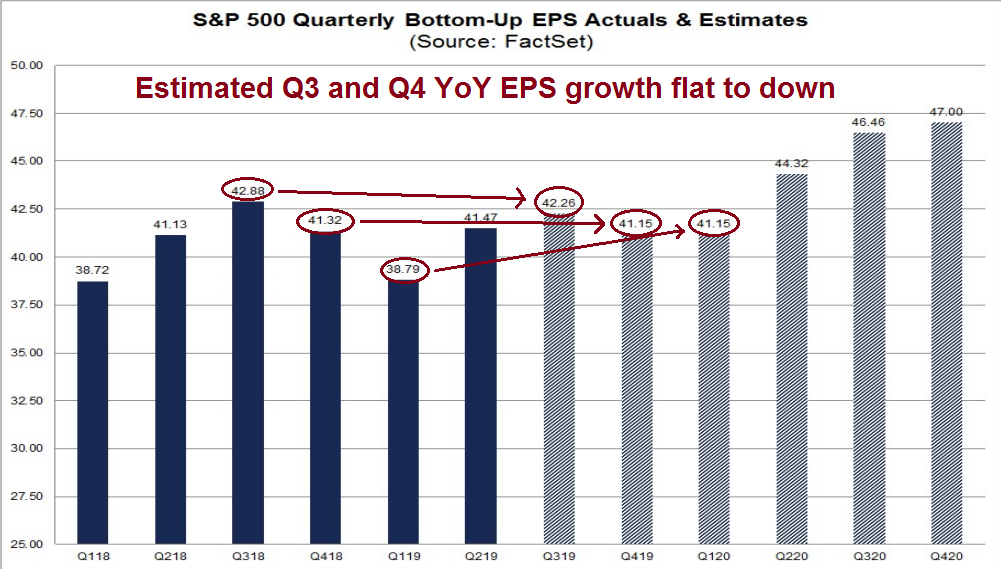
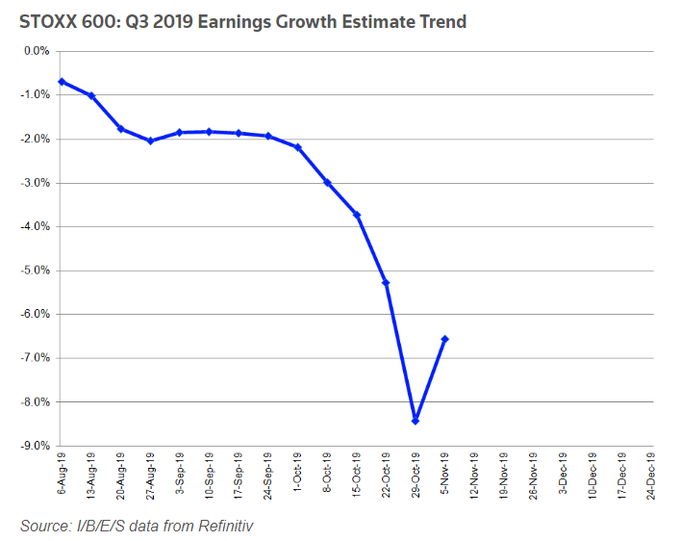
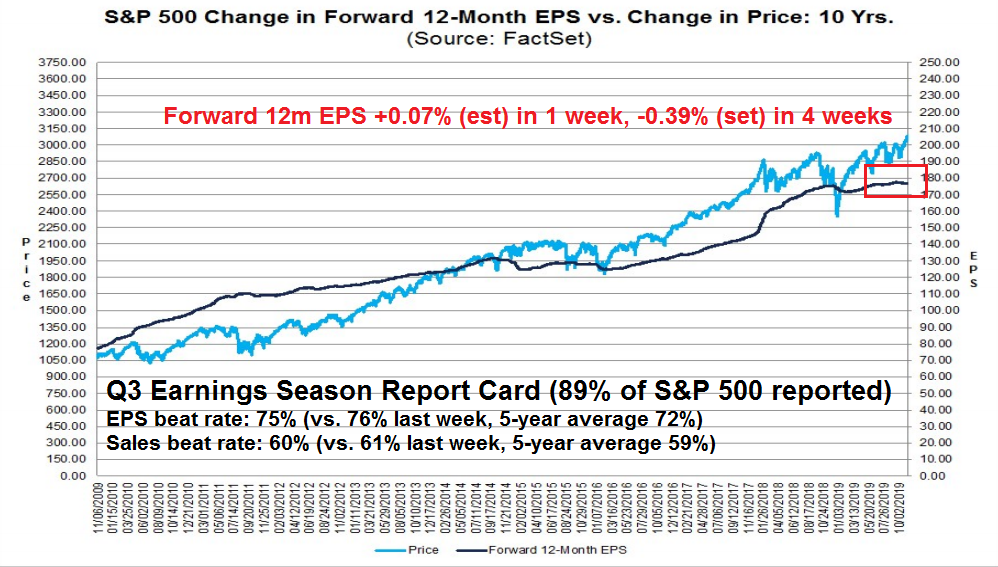
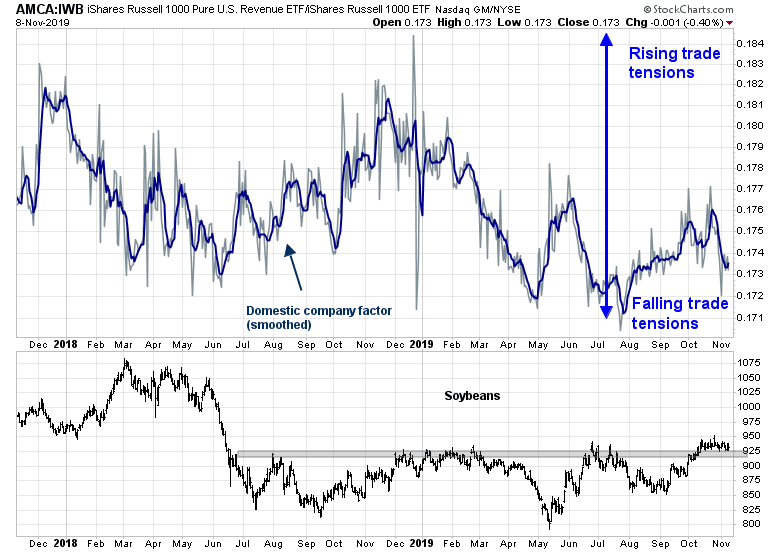
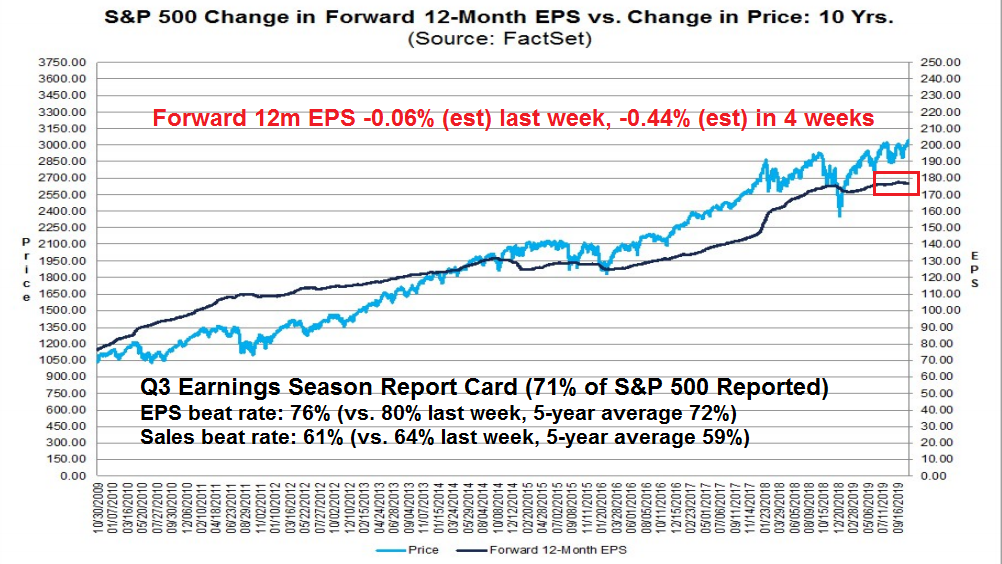
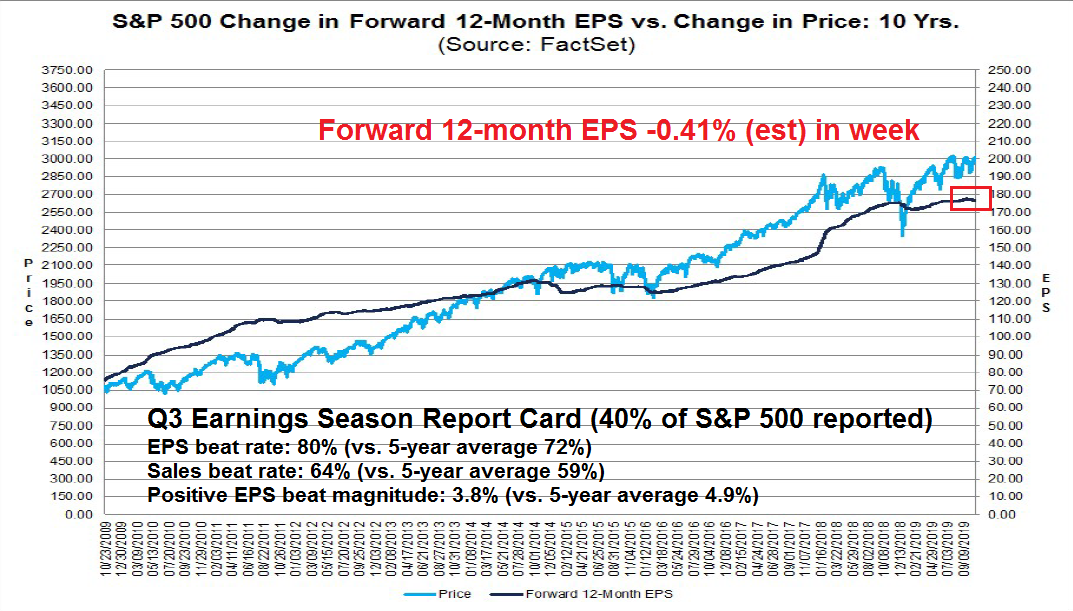
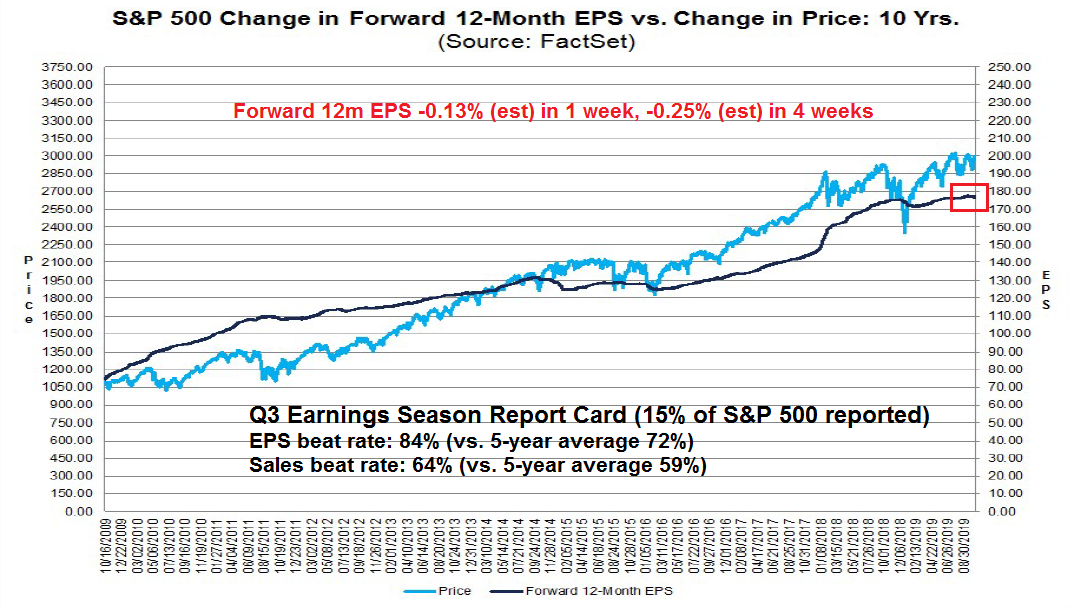
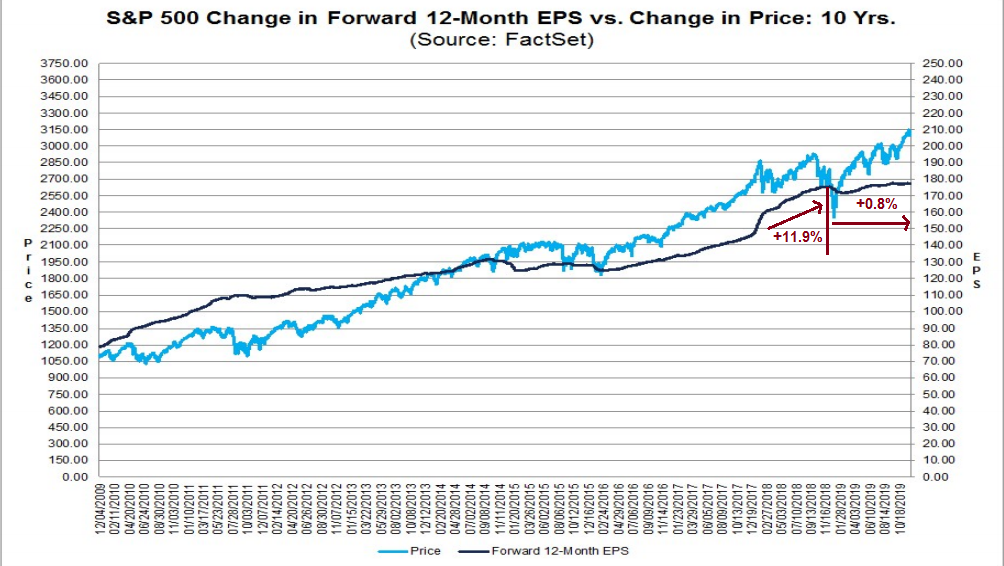
From a fundamental viewpoint, we can get some hints on how the Street’s estimates of forward 12-month earnings evolved during the same period. We begin our analysis in early 2018, after analysts had factored the one-time effects of Trump’s corporate tax cuts. From the time EPS estimates began to stabilize in early 2018 to November 2018, which is when the market was beset by the twin worries of the negative effects of the trade war and a hawkish Fed, forward EPS rose 11.9%. From November 2018 to today, forward EPS estimates are flat, rising only 0.8%, despite the Fed’s dovish about face. We therefore attribute most of the lack of forward earnings growth to waning business confidence from the trade war.
Based on that experience, we can see the imposition of the current tariff regime, which the Fed estimates to have slightly more than double the effect on business confidence as the December 15 tariffs, resulted in flat to slightly positive forward EPS growth. We can make a guesstimate that the December 15 tariffs, which would impose at 25% tariff rate on the remainder of Chinese imports, to result in flat to slightly positive forward earnings growth of no more than 2%.
The Powell Put
If the December 15 tariffs were to be implemented, what other policy actions could act to mitigate of offset the negative effects of the tariffs? I can offer two possibilities. The first is a dovish Fed.
The Powell Fed has taken a decided dovish pivot in the past few months. During his October 31 press conference, Powell emphasized the symmetric nature of the 2% inflation target [emphasis added].
We’re also, as part of our review, looking at potential innovations, changes to the way we think about things, changes to the framework that would lead us—that would be more supportive of achieving inflation on a 2 percent—on a symmetric 2 percent basis over time. That’s at the very heart of what we’re doing in the review. It’s too early to be announcing decisions. We haven’t made them yet. But we’re in the middle of thinking about ways that we can make that symmetric 2 percent inflation objective more credible by achieving symmetric 2 percent inflation. And it comes down to using your policy tools to achieve 2 percent inflation, and that is the—that is the thing that must happen for credibility in this area. So we’re committed to doing that.
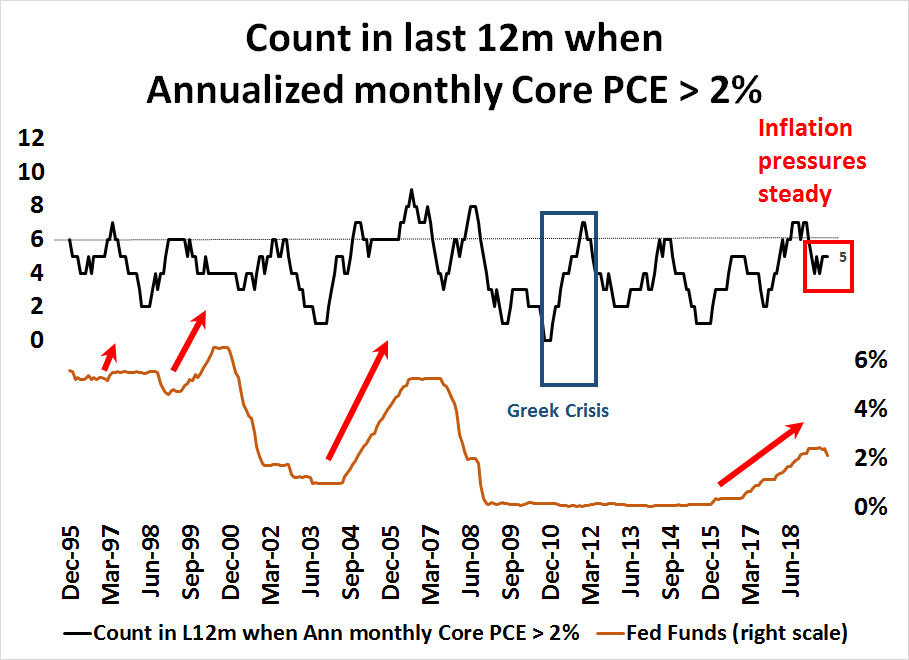
After years of undershooting the target, the Fed is becoming more tolerant of a hotter inflation regime above 2%. The 2% target is not a ceiling, but an average inflation target.
Fed governor Lael Brainard added more color to the shift in thinking in a recent speech. First, she admitted that the December 2015 liftoff in rates was a policy mistake (ZLB = zero lower bound):
Forward guidance on the policy rate will also be important in providing accommodation at the ELB. As we saw in the United States at the end of 2015 and again toward the second half of 2016, there tends to be strong pressure to “normalize” or lift off from the ELB preemptively based on historical relationships between inflation and employment. A better alternative would have been to delay liftoff until we had achieved our targets. Indeed, recent research suggests that forward guidance that commits to delay the liftoff from the ELB until full employment and 2 percent inflation have been achieved on a sustained basis—say over the course of a year—could improve performance on our dual-mandate goals.
She went on to state that she would be willing to target a higher inflation rate for a set period of time if inflation had been undershooting for a similar period.
I prefer a more flexible approach that would anchor inflation expectations at 2 percent by achieving inflation outcomes that average 2 percent over time or over the cycle. For instance, following five years when the public has observed inflation outcomes in the range of 1-1/2 to 2 percent, to avoid a decline in expectations, the Committee would target inflation outcomes in a range of, say, 2 to 2-1/2 percent for the subsequent five years to achieve inflation outcomes of 2 percent on average overall.
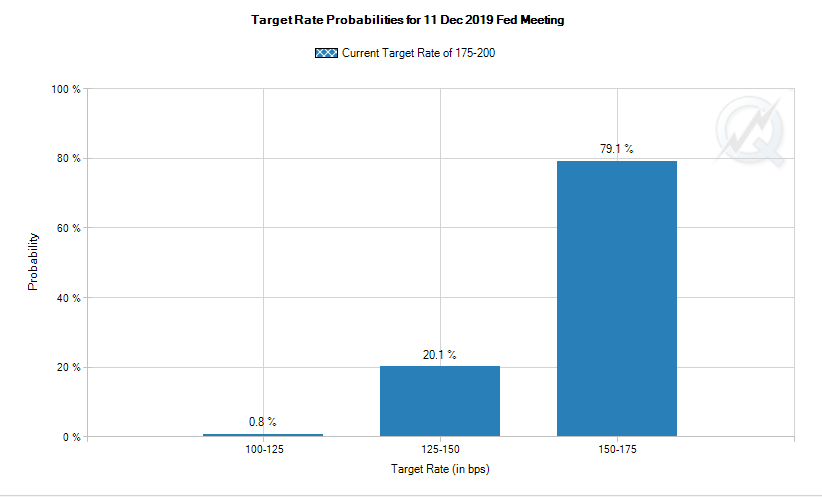
Today, the Fed has signaled that it is done cutting rates, and the hurdle for raising rates is quite high. How would it react if economic growth began to soften because of falling business confidence from rising tariffs? Already, the Fed’s balance sheet has been rising.

At a minimum, expect a Powell Put to mitigate some of the damage from rising tariffs.
Fiscal policy to the rescue
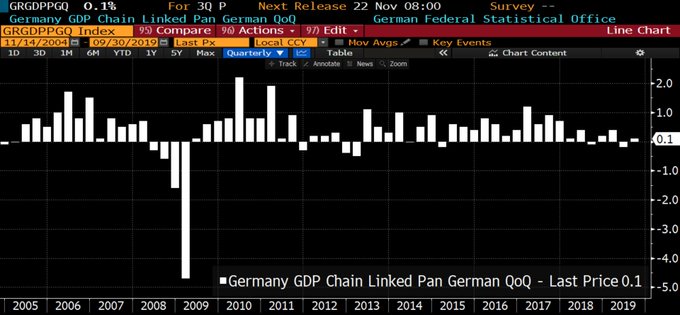
I have written that I expect that the cyclical rebound to be global in scope. One of the evolving tailwinds for global growth is fiscal policy. Reuters reported that Japan has launched a 13.2 trillion yen fiscal stimulus package to offset a possible post 2020 Olympics slump. However, the more promising policy development is European fiscal policy.
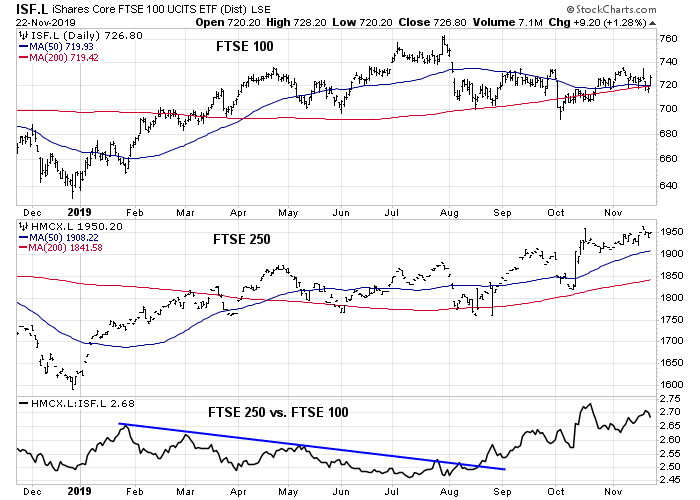
Joe Wisenthal at Bloomberg recently commented on the possibility of UK fiscal expansion.
These days everyone (including me) is talking about the eventual hand-off from monetary to fiscal policy, as rates go lower and lower with seemingly little growth to show for it. But when and where it will actually happen is still to be determined. The thing with fiscal stimulus is that it’s not enough to say it’s justified, necessary or doable, a country also needs the political capacity to make it happen. So, for example, in a politically divided country (such as the U.S.) opposition parties are usually going to oppose it. It seems there’s a growing view that the U.K. may be the first out of the gate. In an interview this morning on Bloomberg TV, Saxo Bank CIO Steen Jakobsen said that he expects a Boris Johnson government to unleash the biggest fiscal expansion since the 1970s and enough growth to heal deep divisions in the U.K. Meanwhile just yesterday Steve Englander of Standard Chartered wrote that Britain is the most likely G10 country to turn to fiscal stimulus to cushion the economic impact of Brexit. In other words, between the mediocre economy, and a possible (though anything can happen) Conservative majority, the conditions just might be in place to crank up the spending. While the ongoing U.K. political drama is probably annoying to some, it will at least produce numerous interesting real-life economic experiments for people to analyze for years to come. So at least there’s that.
Across the English Channel and the North Sea, attitudes towards fiscal stimulus are shifting, especially among the Germans. The recent election of Norbert Walter-Borjans and Saskia Esken to the leadership of the SPD, which constitutes junior coalition partner to Angela Merkel’s CDU, has shifted the political winds. The CDU has traditionally been highly fiscally conservative, but Reuters reported that the new wish-list of the new SPD leadership calls for more spending:
INVESTMENT: Massive investment in schools, infrastructure and digitalization. Various figures have been mentioned, including 240 billion euros ($264.53 billion) for schools, roads, railways, and 100 billion euros for digitalization. DEBT: To pay for the investment, they want to drop Germany’s strict fiscal rules on borrowing and commitment to a balanced budget, saying this has become a fetish. Although the 2020 budget has been passed, they argue for a supplementary budget. This would break a taboo for many conservatives. Even SPD Finance Minister Olaf Scholz, who lost the leadership contest, has so far stuck to fiscal rigour. CLIMATE PROTECTION: More radical climate protection measures, including raising the price of CO2 emissions to 40 euros a tonne from 10 euros a tonne from 2021. That suggestion is in line with what many climate economists had advocated. There may be some leeway on climate measures, also on the expansion of renewable energy, not least because a 50 billion euros package of measures agreed in September has got stuck in parliament and will have to be tweaked. MINIMUM WAGE: To immediately increase the minimum wage to about 12 euros from just over 9 euros now.
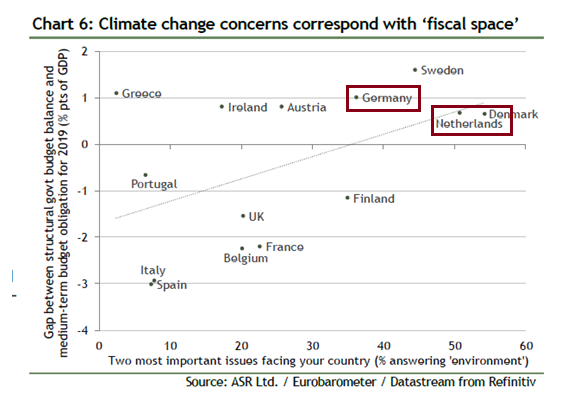
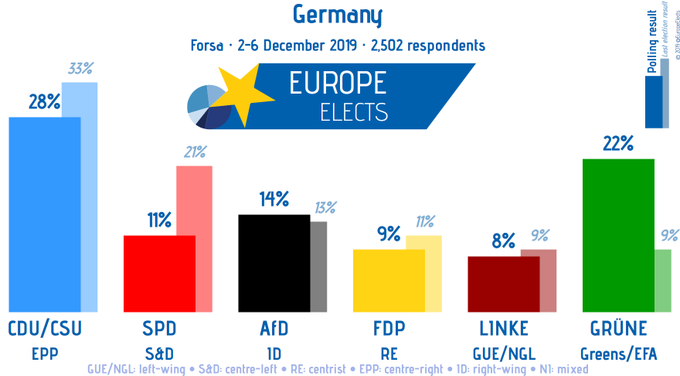
No doubt, there will be the usual back and forth negotiations. There is always a possibility that the coalition falls apart and new elections are called. Should Germans go to the polls in the near future, the country will have to deal with two emergent parties, the right wing and anti-immigrant AfD, and the Greens, who are become a rising force throughout Europe. As a recent poll shows, the Greens are in second place in political popularity in Germany, eclipsing the support of the SPD.
That’s because climate change is regarded as an emergency in Europe, while its effects are still being debated in the US. Bloomberg reported that the EU is pivoting towards an EU Green New Deal.
The European Union is gearing up for the world’s most ambitious push against climate change with a radical overhaul of its economy. At a summit in Brussels next week, EU leaders will commit to cutting net greenhouse-gas emissions to zero by 2050, according to a draft of their joint statement for the Dec. 12-13 meeting. To meet this target, the EU will promise more green investment and adjust all of its policy making accordingly. “If our common goal is to be a climate-neutral continent in 2050, we have to act now,” Ursula von der Leyen, president of the European Commission, told a United Nations climate conference on Monday. “It’s a generational transition we have to go through.”
Translation: The Overton window on European fiscal spending is shifting, and it is colored green.
Investment implication
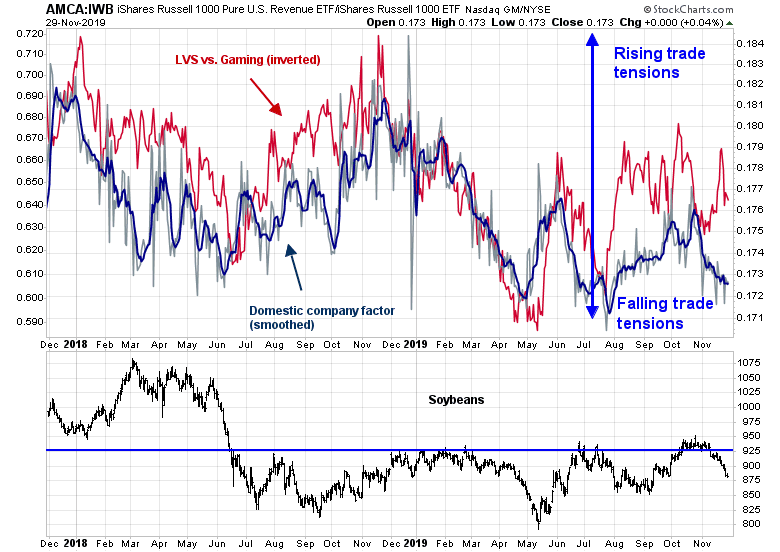
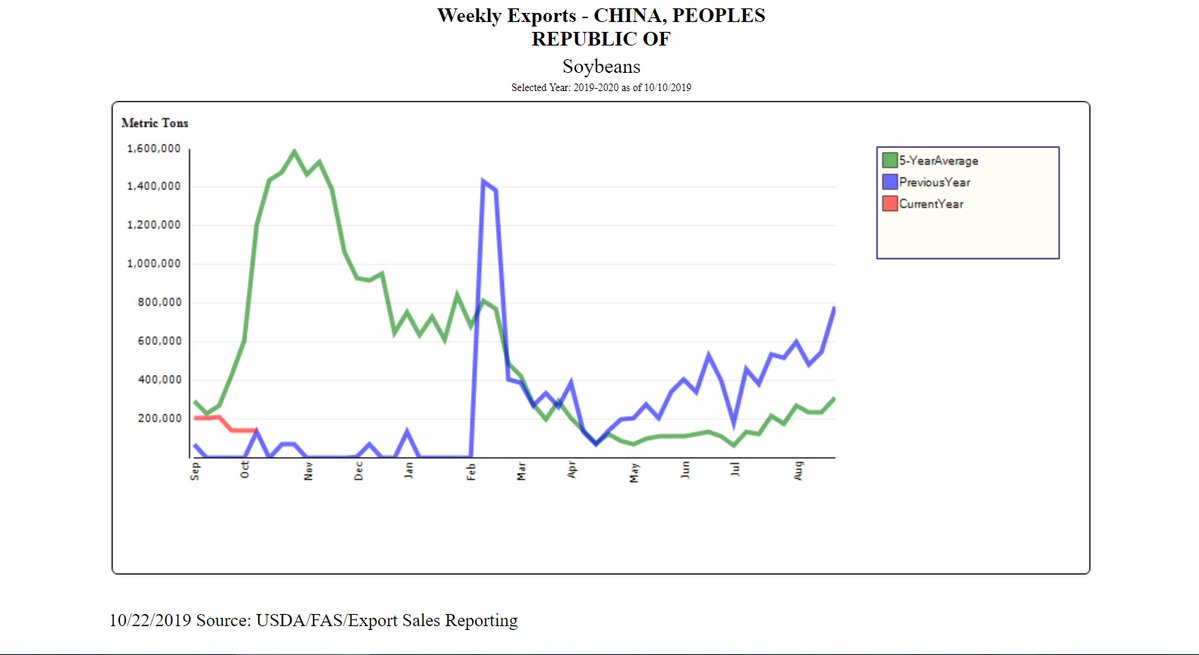
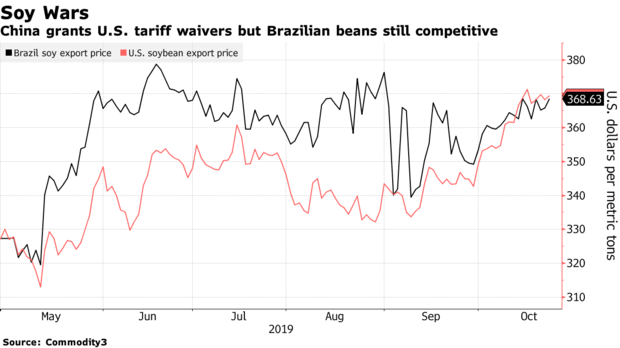
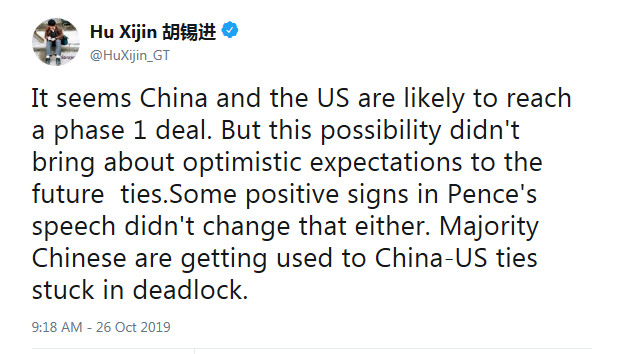
In conclusion, an escalation in the trade war is always possible, but there are offsetting bullish factors to that development. Moreover, American and Chinese negotiators are still talking and it appears that some progress is being made. The latest constructive development was the Chinese decision to waive tariffs on selected US soybean and pork imports as a goodwill gesture.
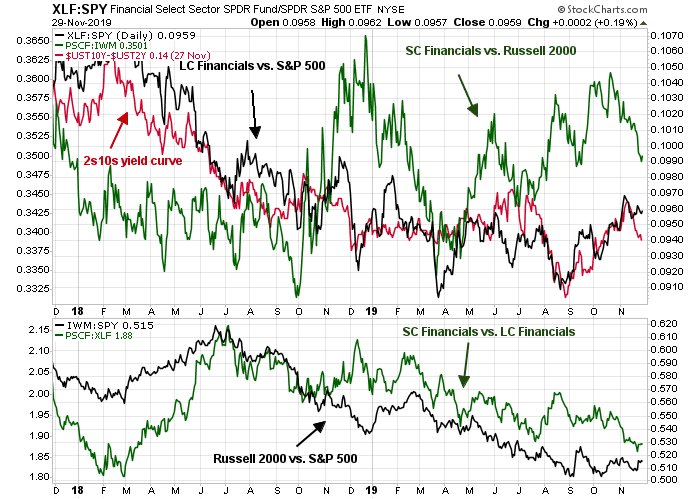
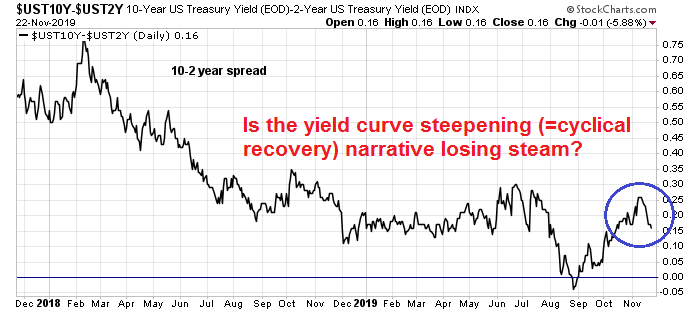
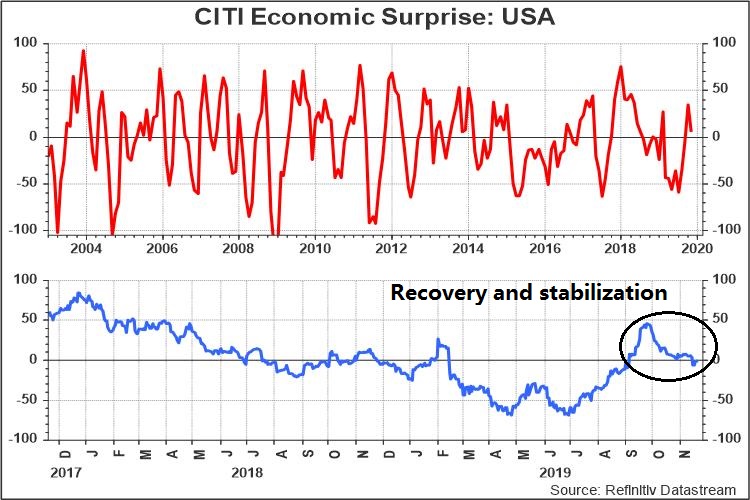
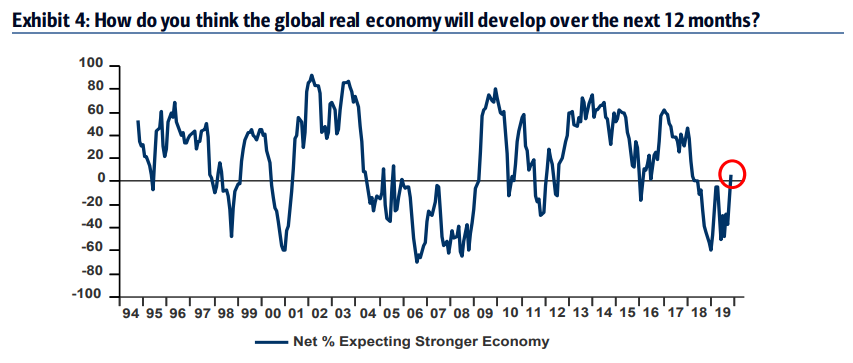
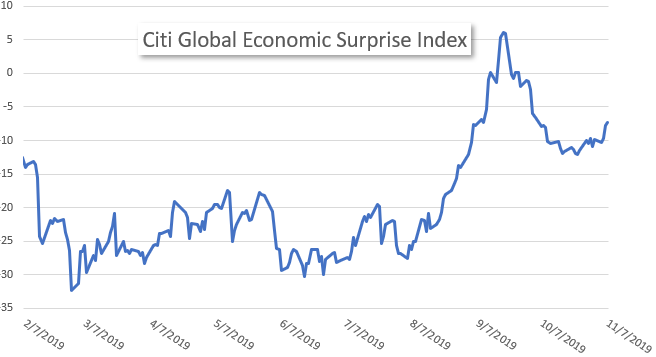
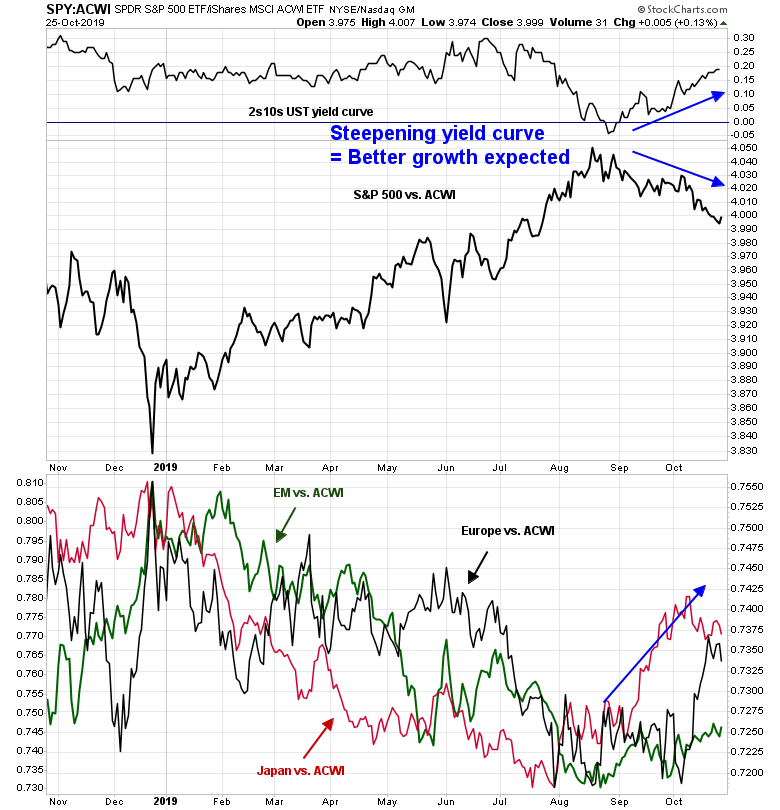
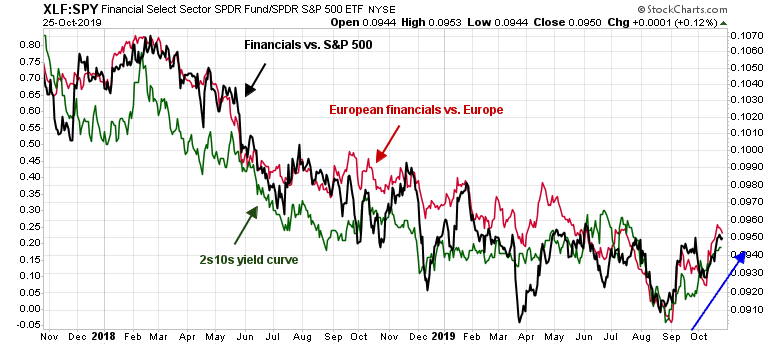
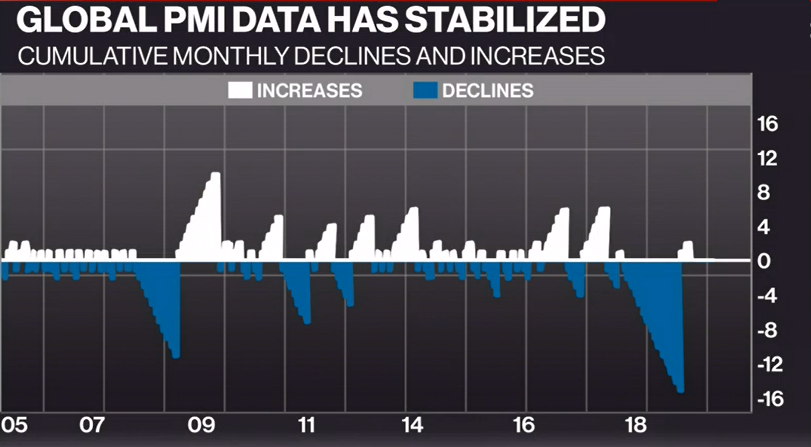
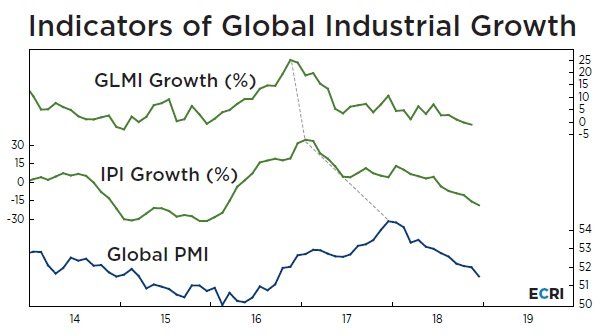
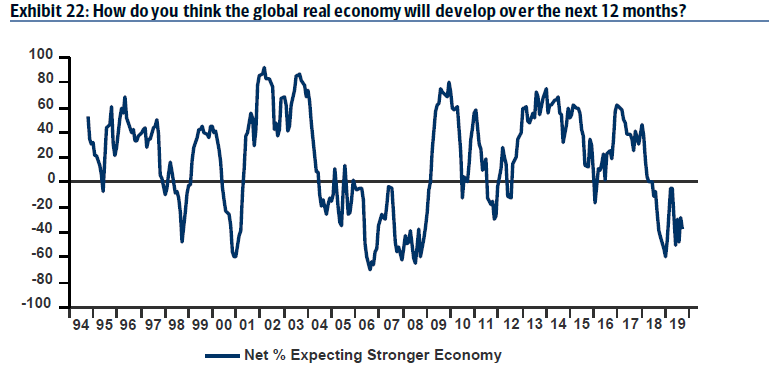
In the meantime, global growth expectations are still rising. The 2s10s yield curve is steepening after a brief period of volatility. The blowout November Employment Report Friday was further evidence of a strengthening economy.

The reflation thesis is still intact. Both Fed policy and European fiscal policy stand poised to offset the negative effects of Tariff Man’s threats. In addition, the Fed’s study concluded that most of the negative effects on business confidence have already been felt, and stock prices have risen during that period despite Trump’s trade war.
The week ahead
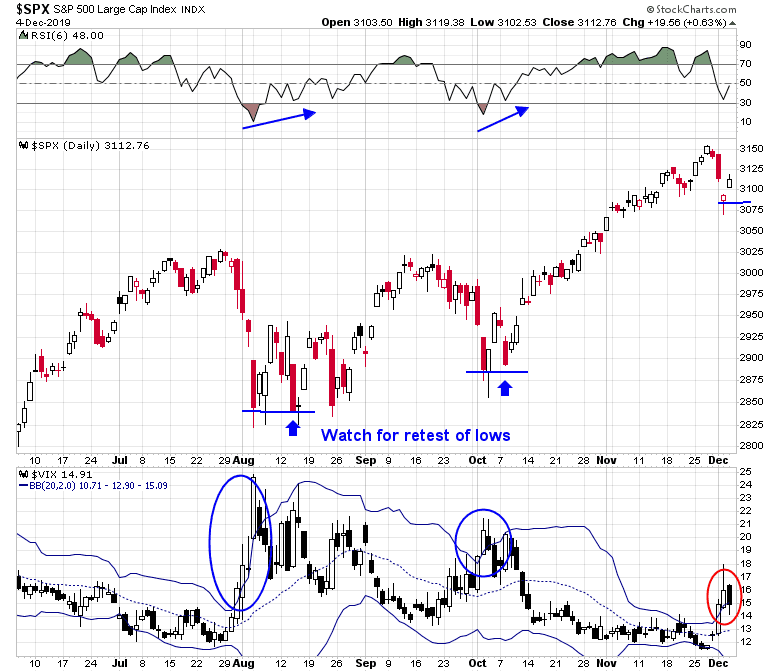
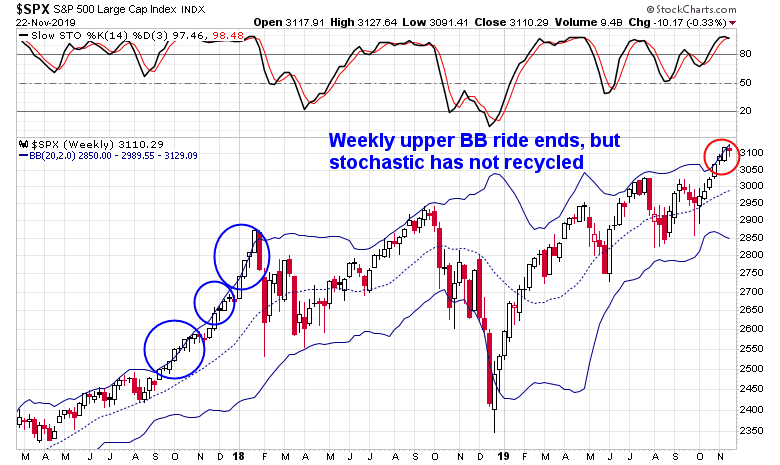
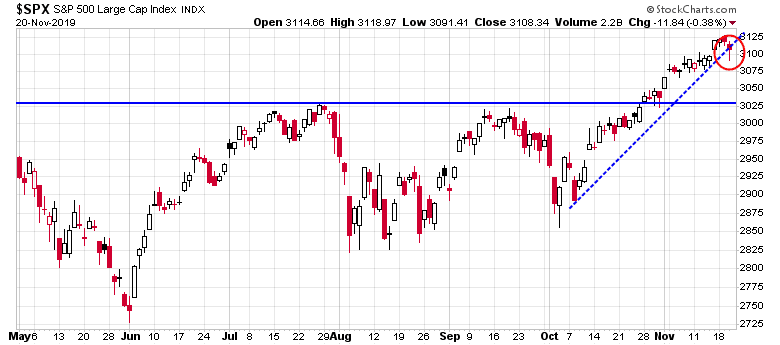
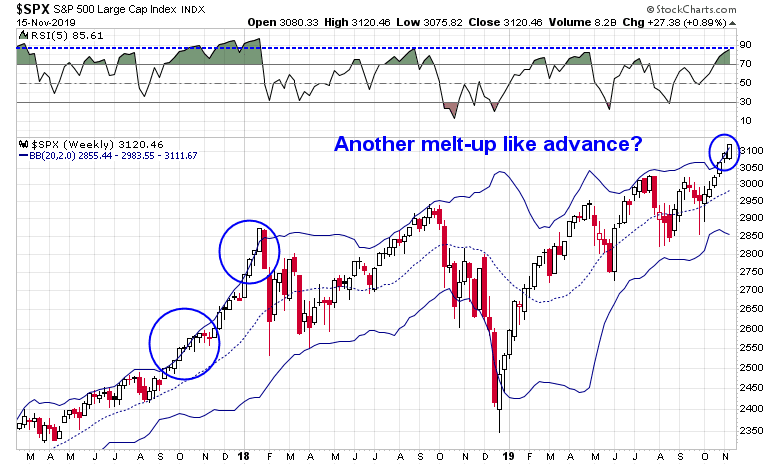
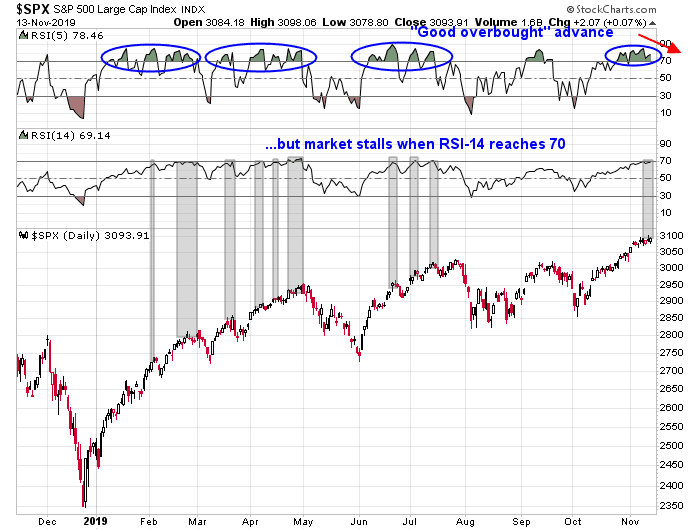
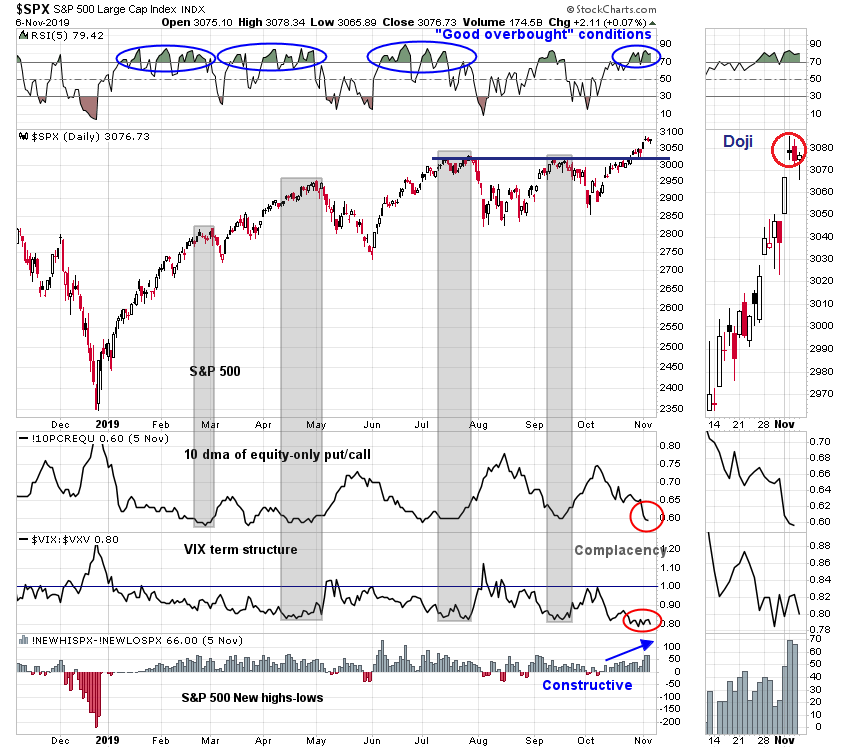
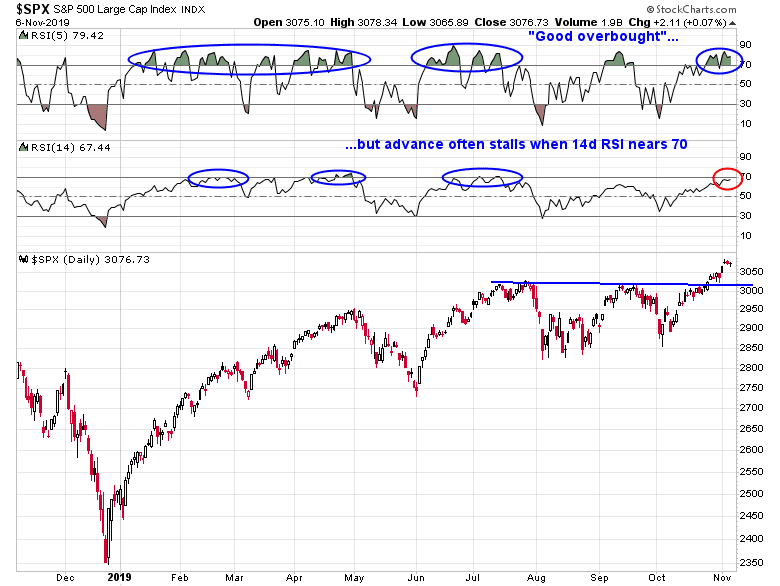
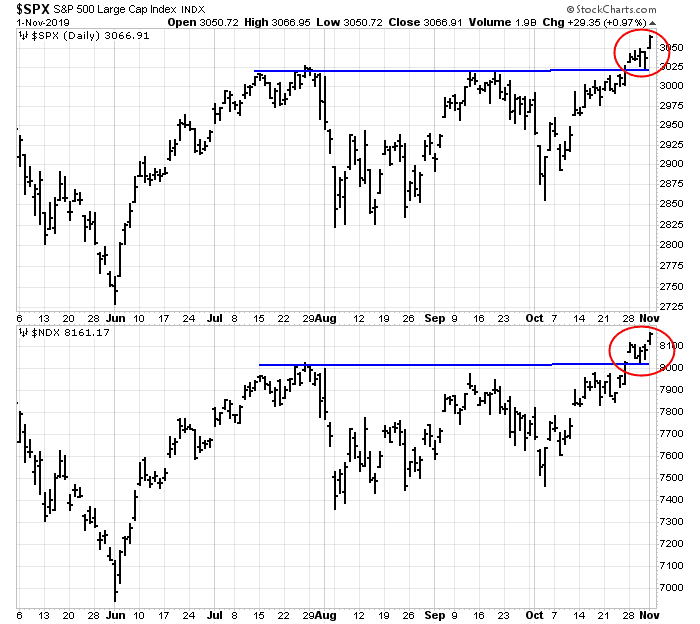
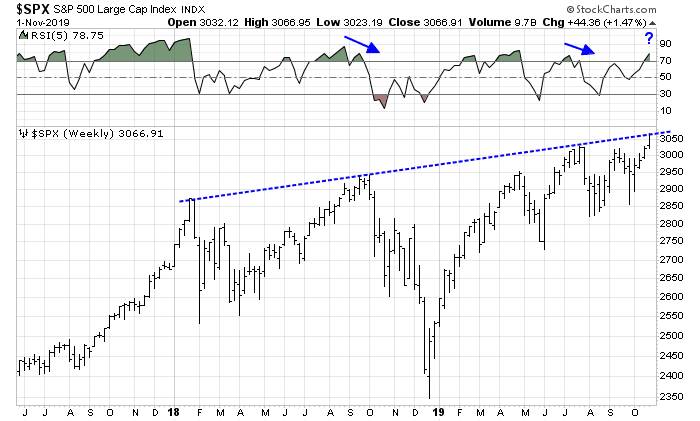
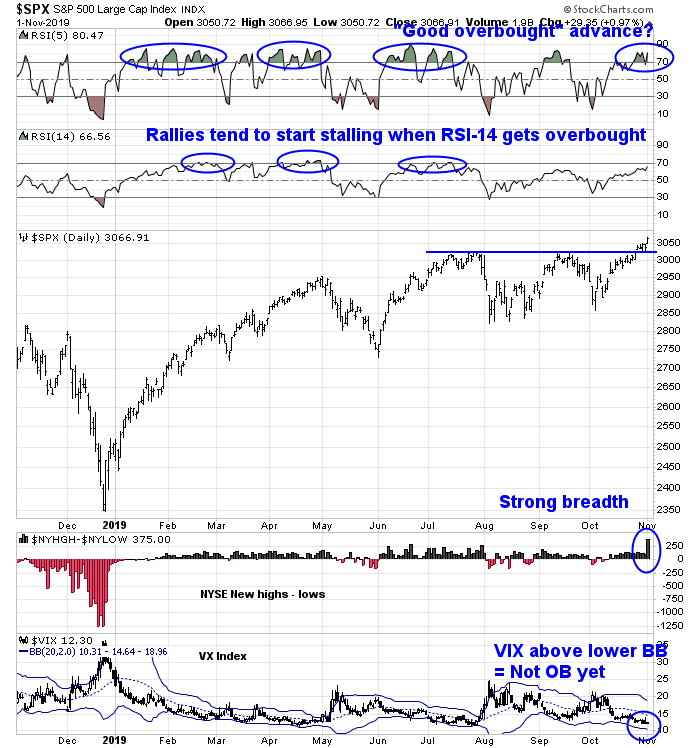
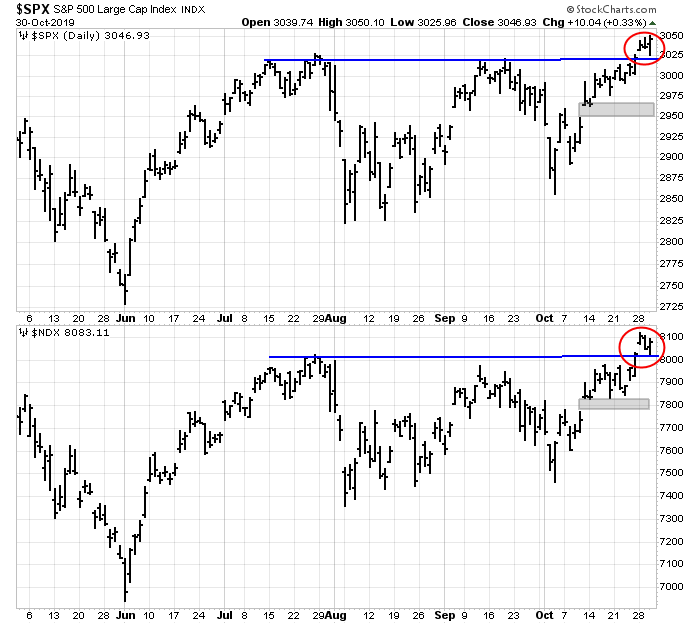
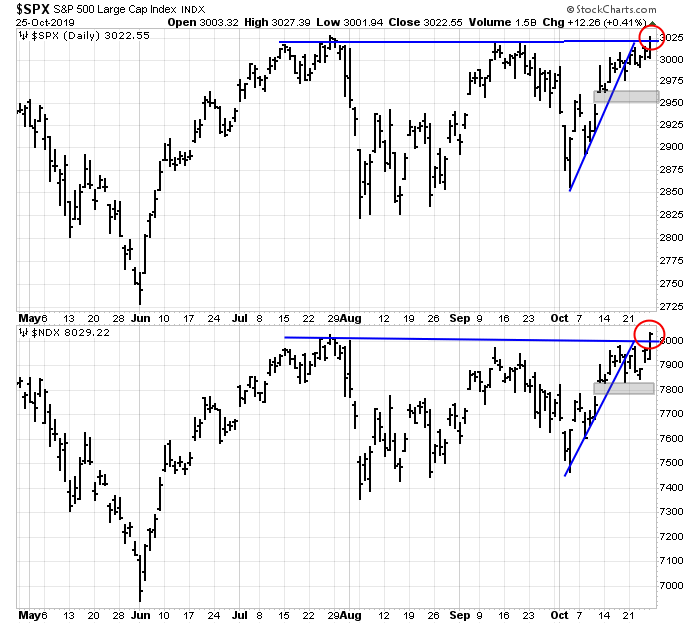
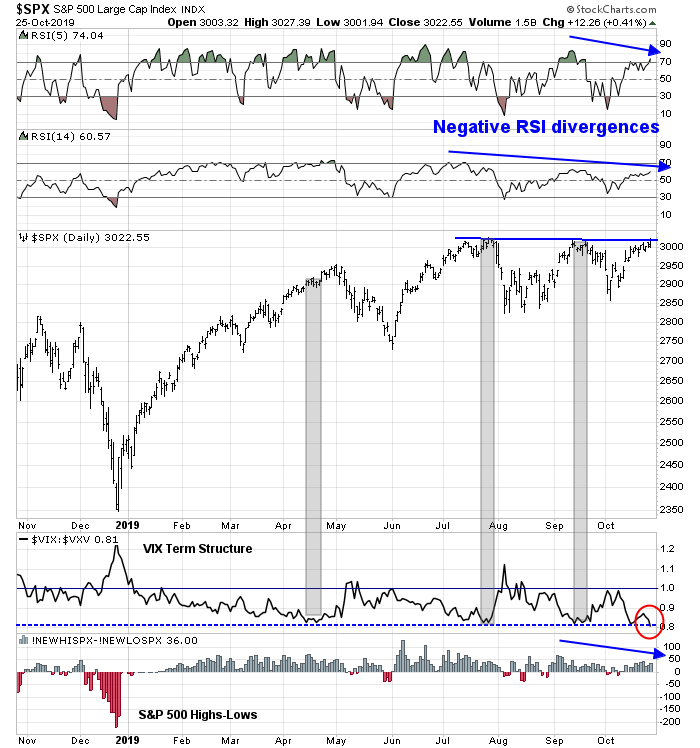
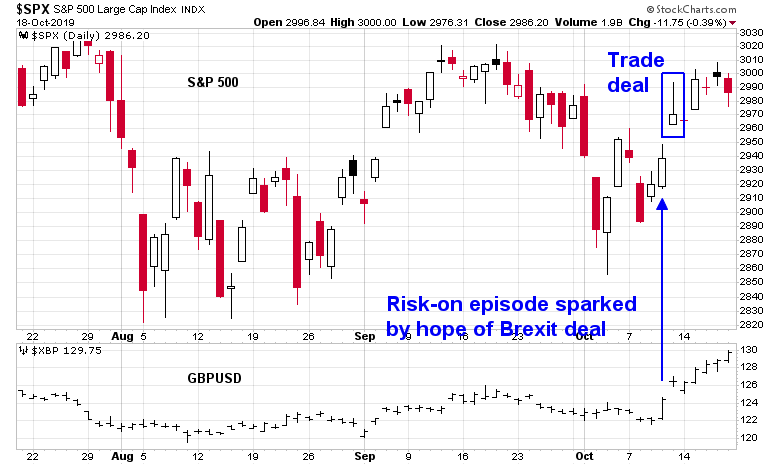
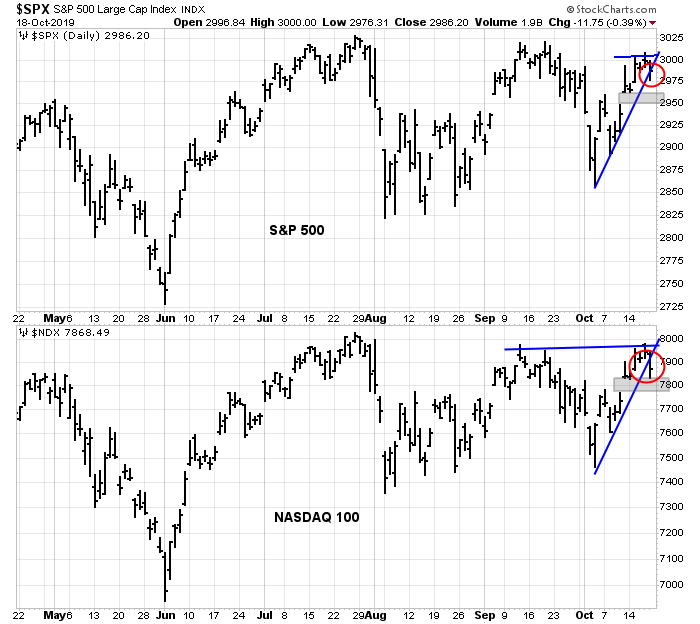
I have made the case in the past few weeks that the market advance was due for a pause, but any pullback was expected to be shallow. The pullback arrived early last week, and this episode of price weakness was indeed shallow. Stock prices began to rebound by mid-week, and the S&P 500 was nearing all-time high resistance by Friday. However, the relief rally left much to be desired, as the bounce left two unfilled gaps below, while exhibiting negative RSI divergences.

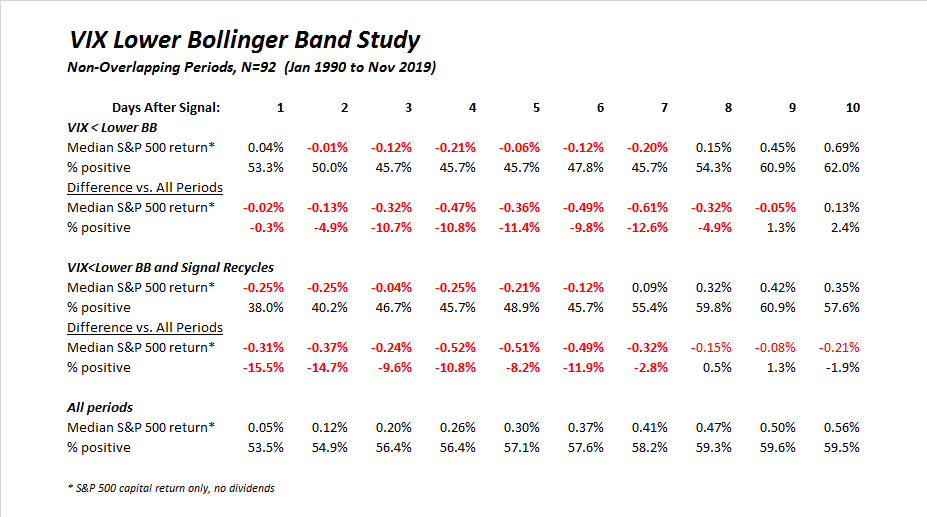
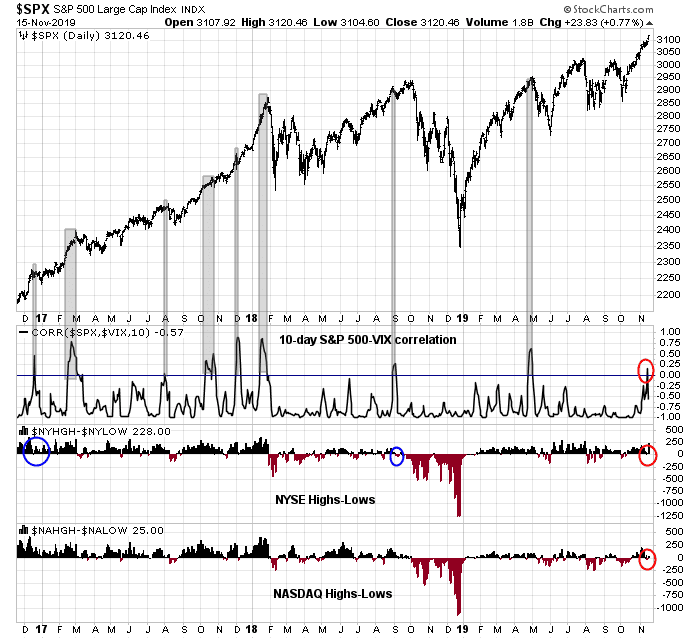
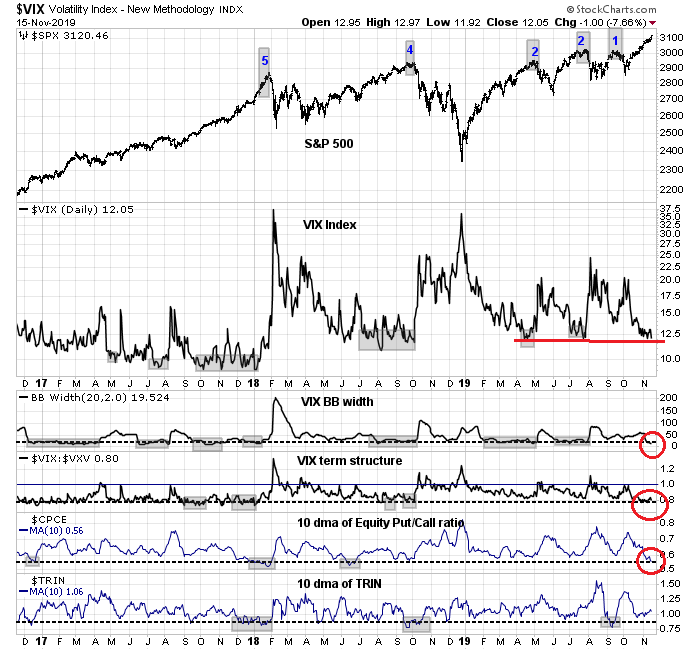
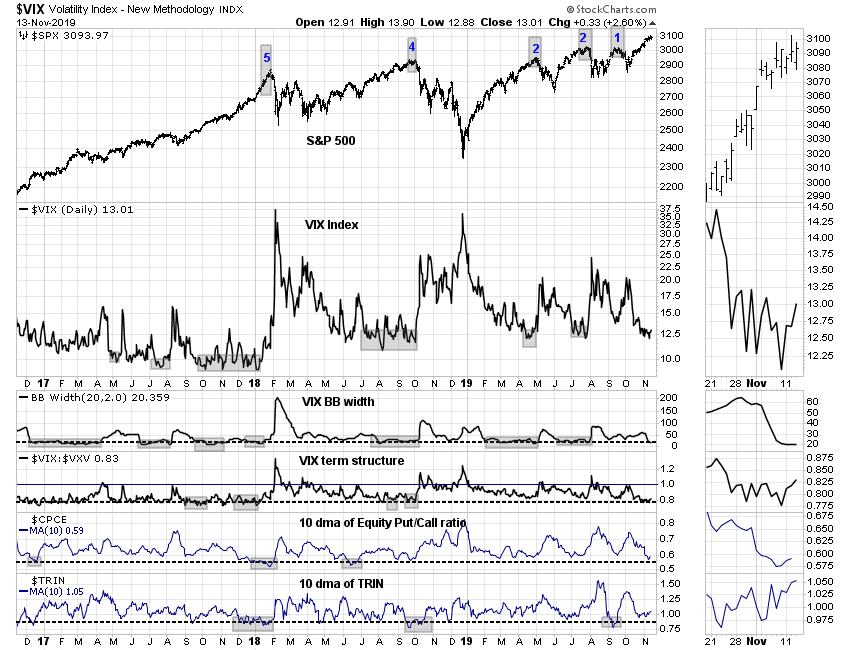
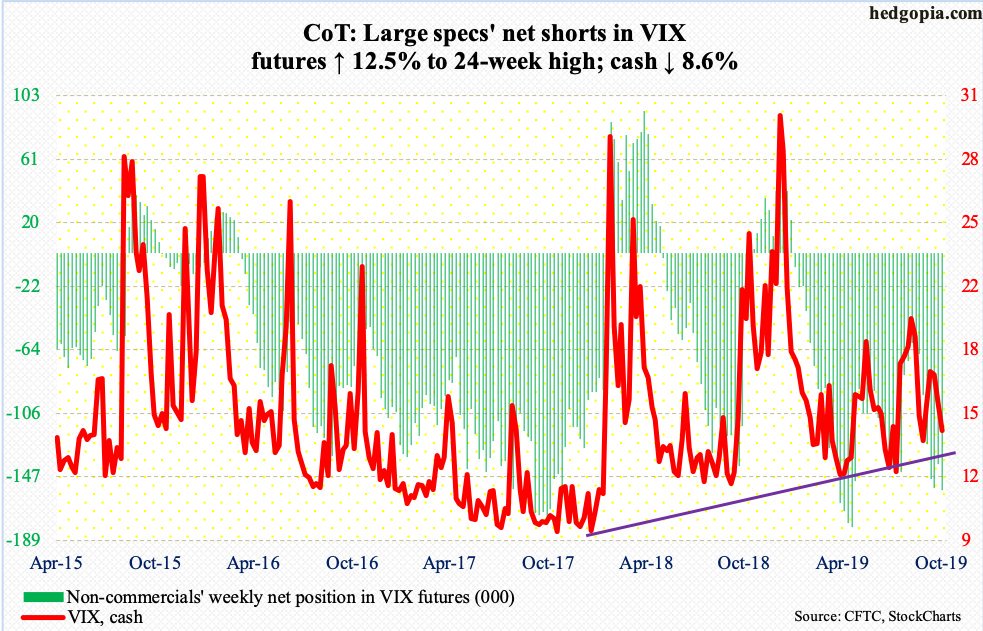
The market may be following the template for the relief rallies triggered by the oversold conditions signaled by the VIX Index closing above its upper Bollinger Band. The market bounced, but came back down to test the previous lows within 3-9 days, with the caveat that the test is not always successful. Watch for signs of positive RSI divergences should a re-test occur.
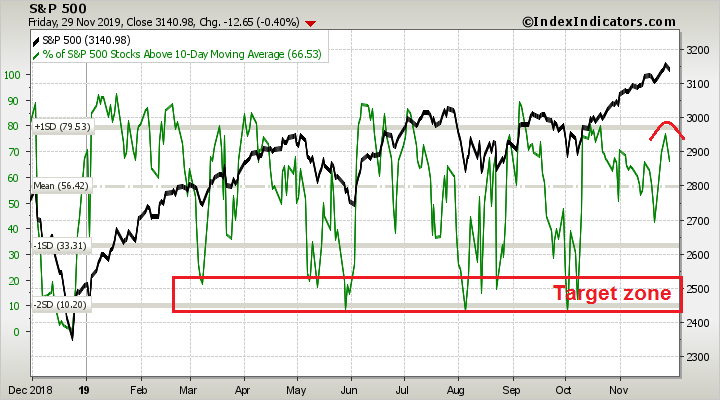
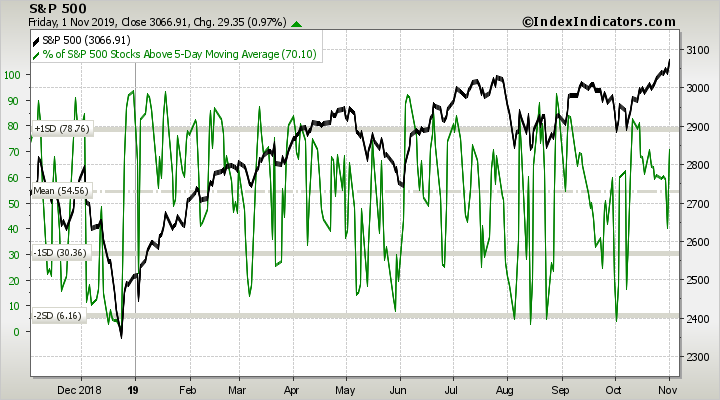
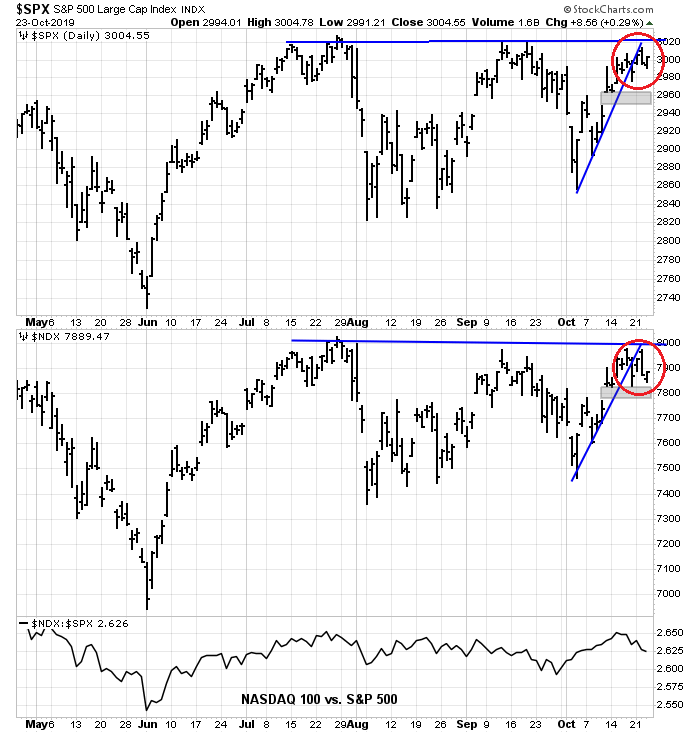
An analysis of the Value Line Geometric Index (XVG), and % above 50 dma shows that the market is probably not quite ready to push to all-time highs in this latest rally. XVG is testing a key resistance level, even though it has not risen to test its all-time highs. In addition, % above 50 dma is not exhibiting sufficient momentum to break through to new highs even as the S&P 500 nears its all-time high.

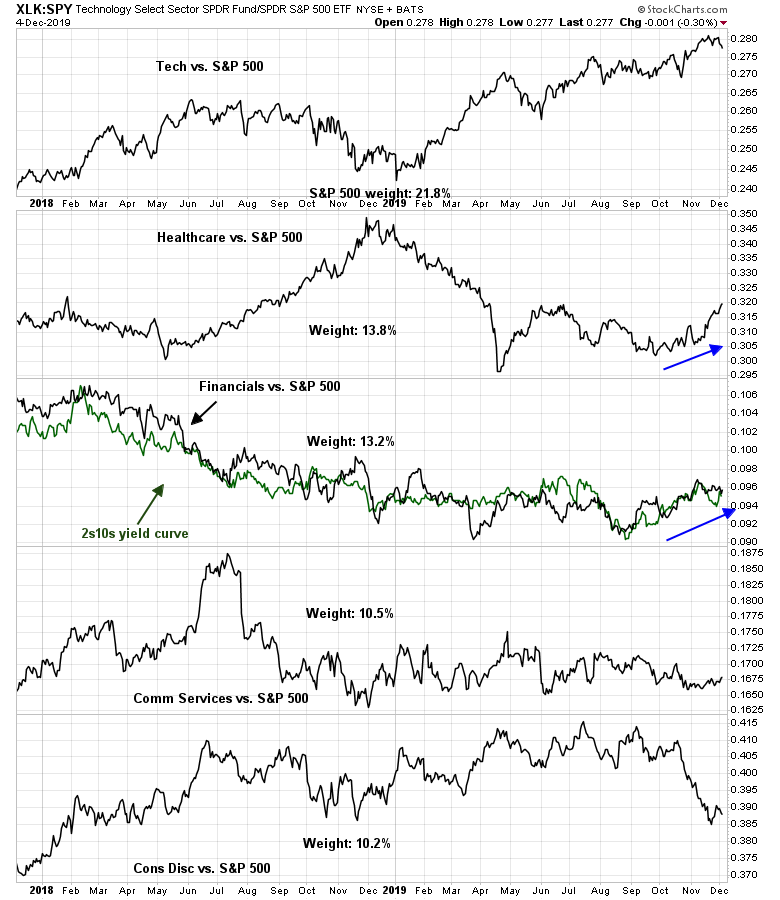
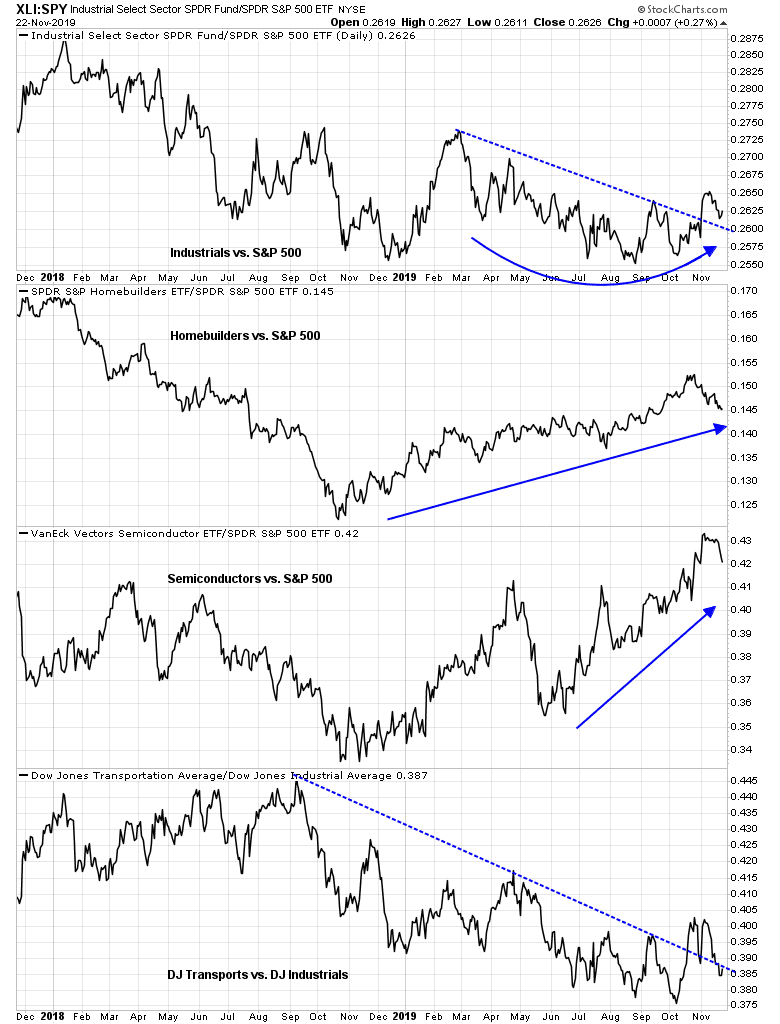
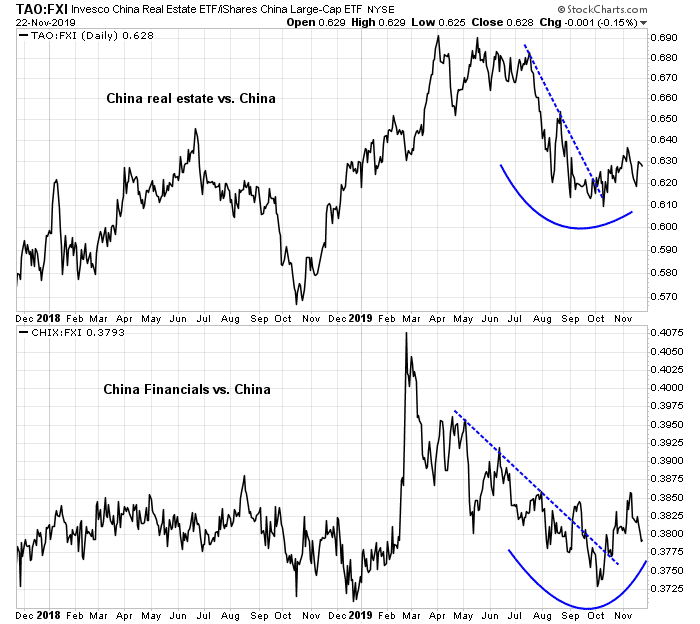
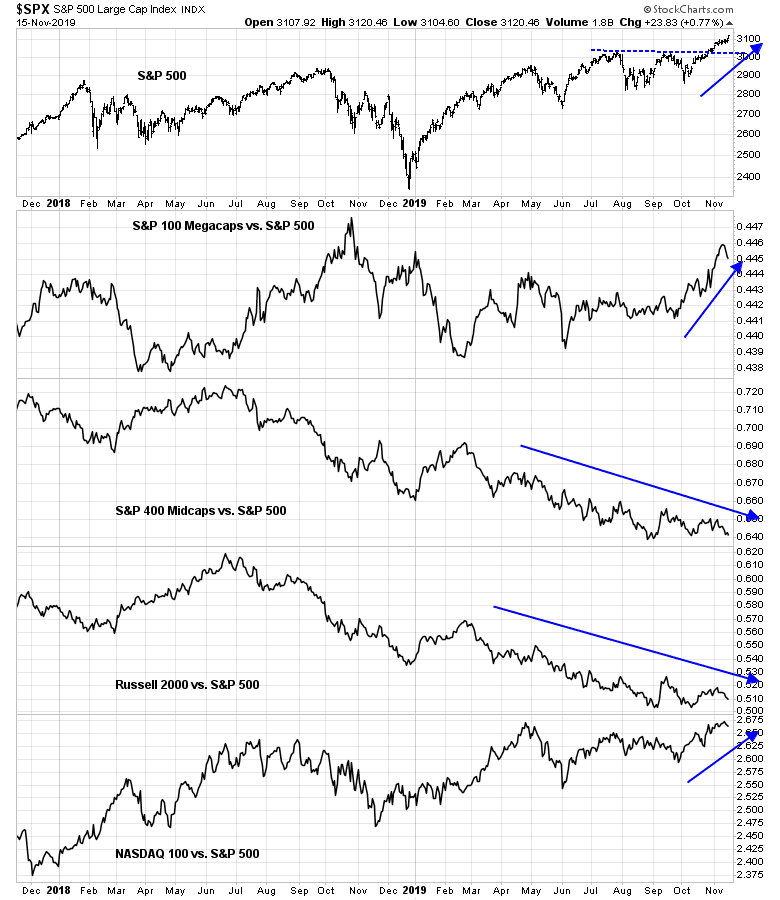
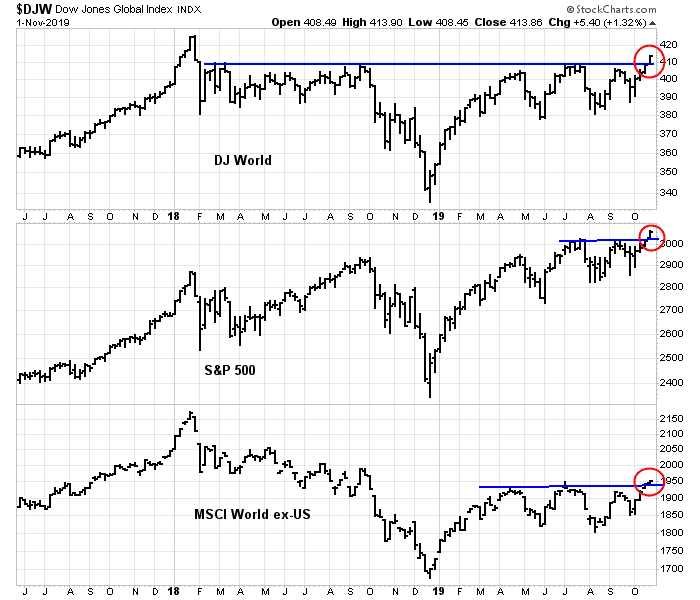
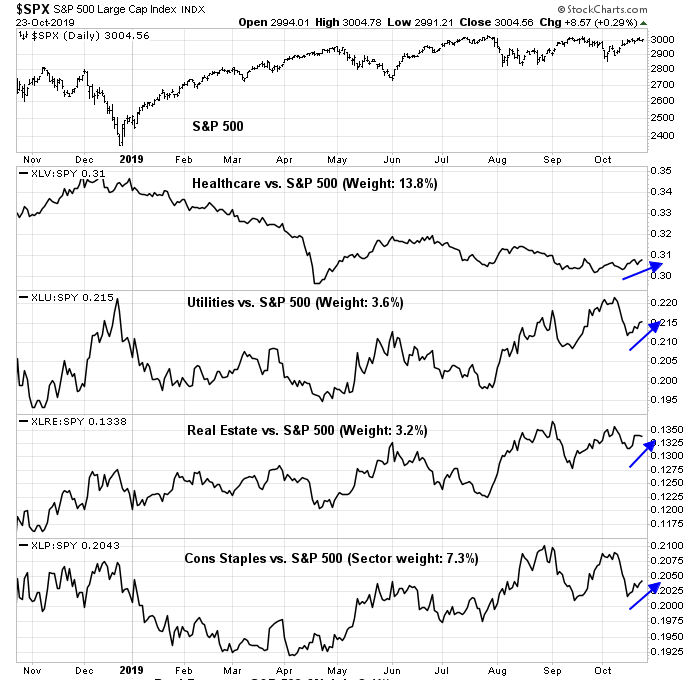
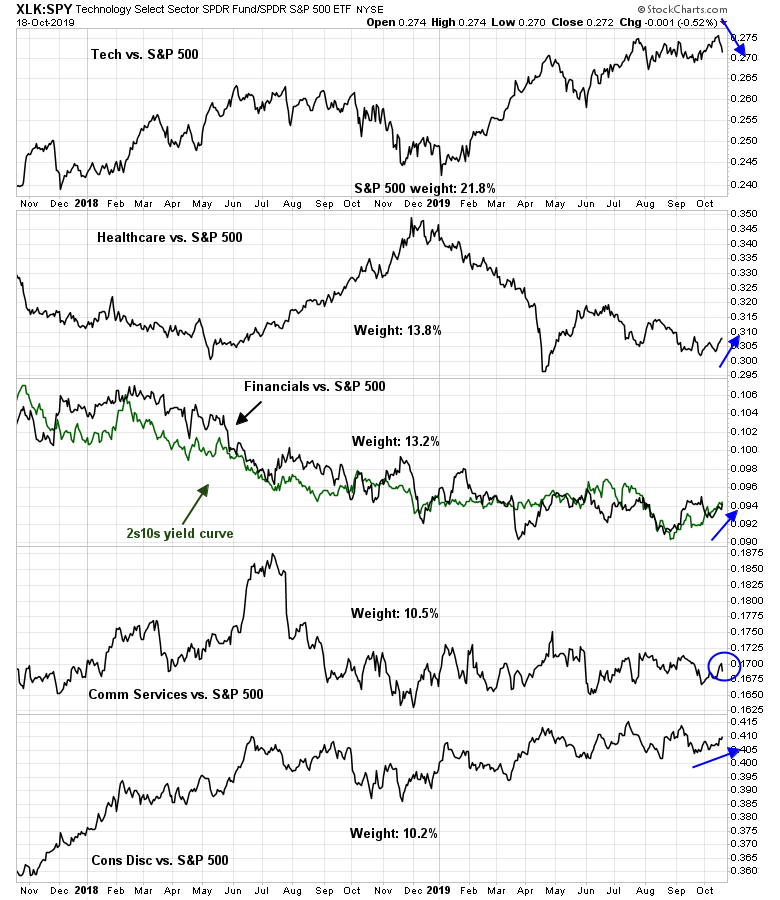
A review of the relative strength of the top 5 sectors that comprise just under 70% of index weight shows a constructive intermediate-term market outlook. Two sectors are in relative uptrends, one is in a relative downtrend, and two are neutral. The market cannot mount a sustainable rally without the broad participation of a majority of these sectors, and this analysis shows a neutral to slightly bullish outlook.

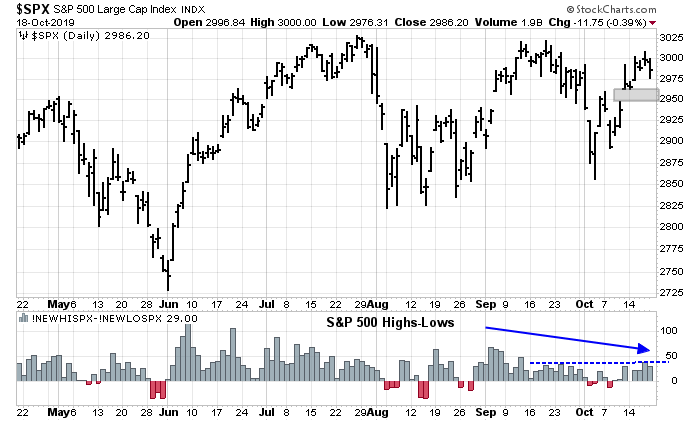
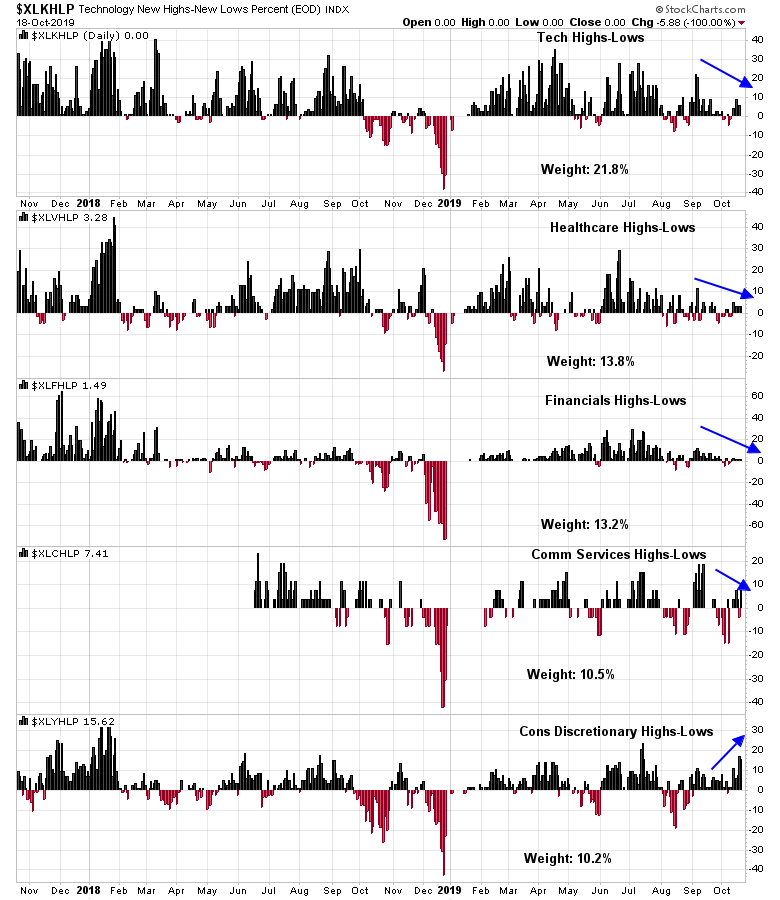
However, the analysis of sector breadth shows that three out of the five sectors are exhibiting falling net new highs, indicating the market needs to consolidate before launching a sustainable assault on the all-time highs.

In the short run, momentum indicators are overbought, indicating a pause or pullback is likely early next week.

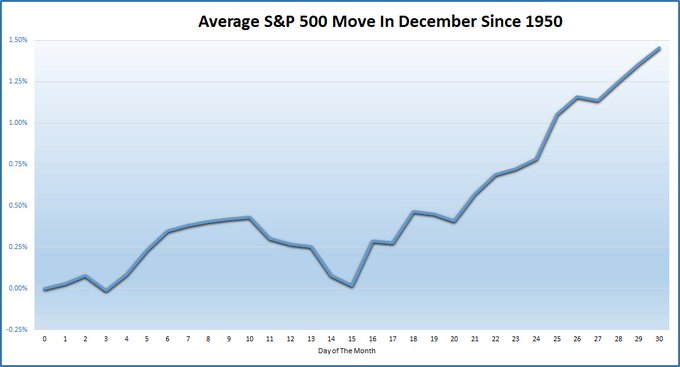
Current market conditions are consistent with a rally later in the month. Ryan Detrick pointed out that the market typically does not begin a Santa Claus rally until mid-December.
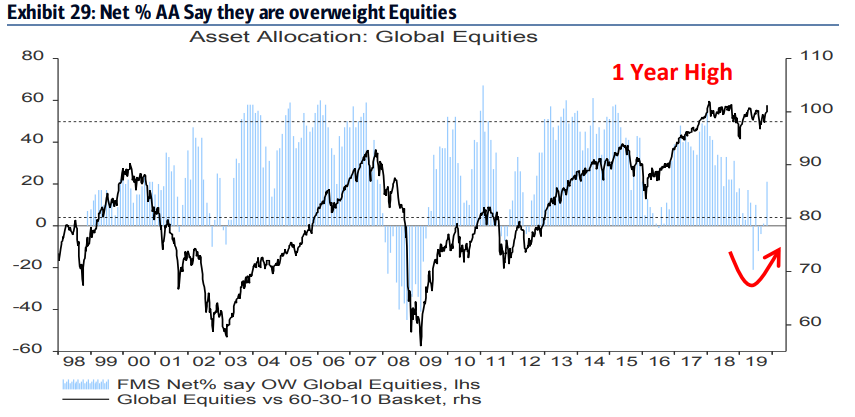
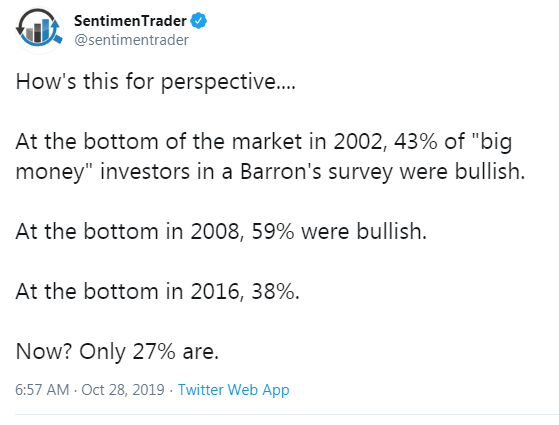
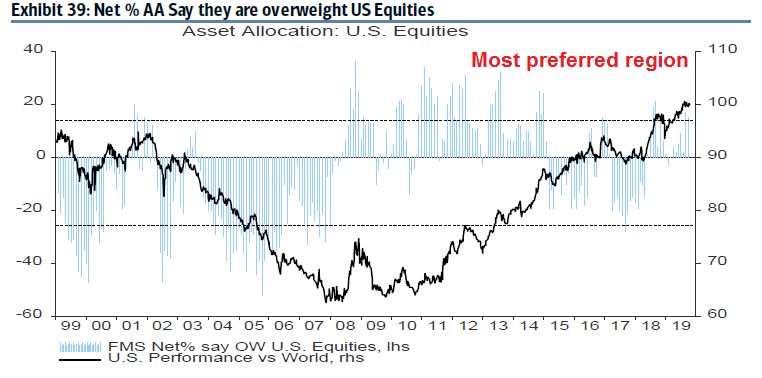
The market is still climbing the intermediate-term proverbial Wall of Worry. Callum Thomas found that North American institutions are still underweight beta.
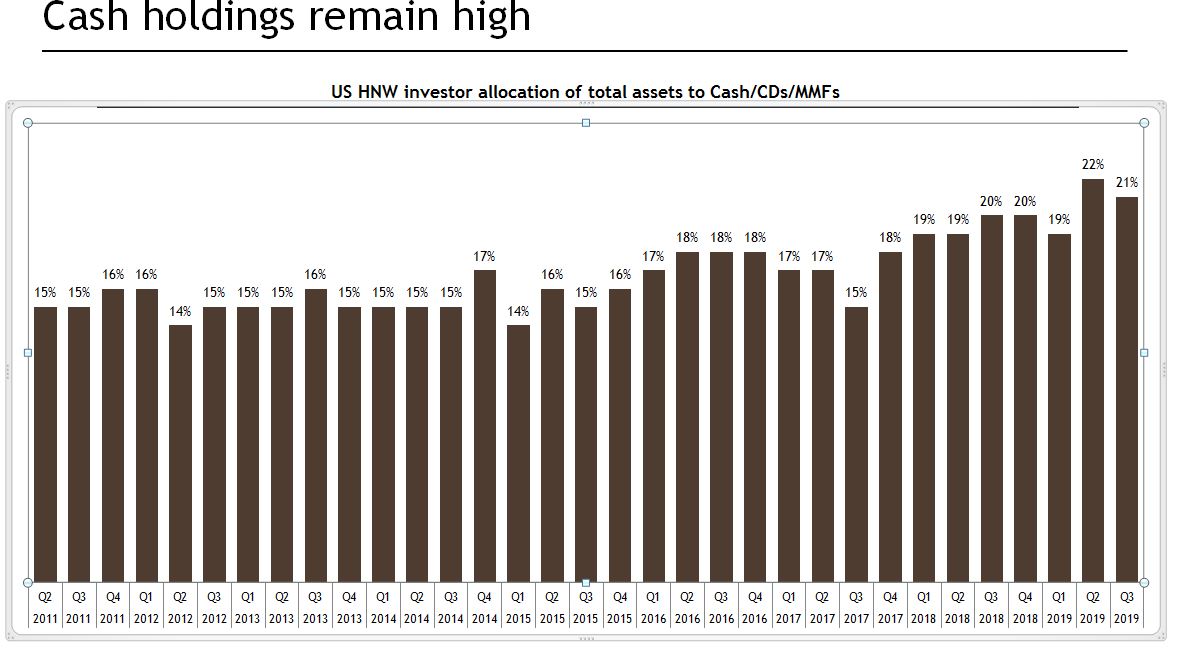
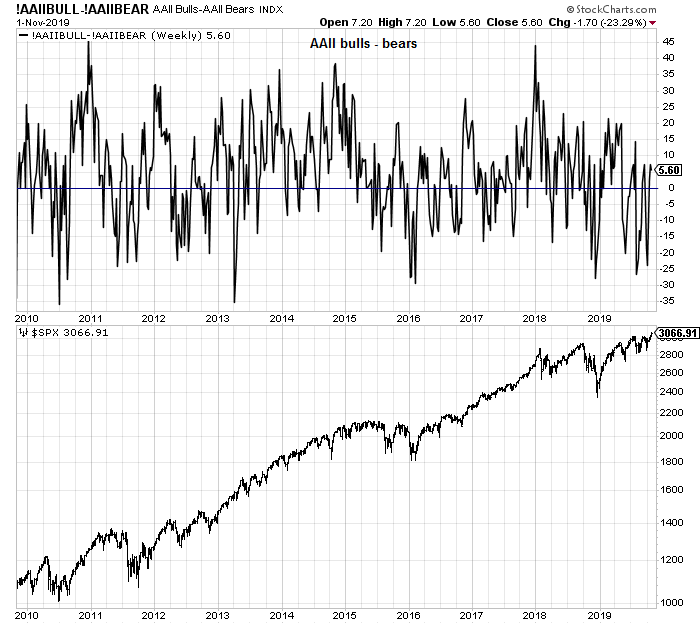
Thomas also observed that retail investors are also skeptical about the equity market rally.

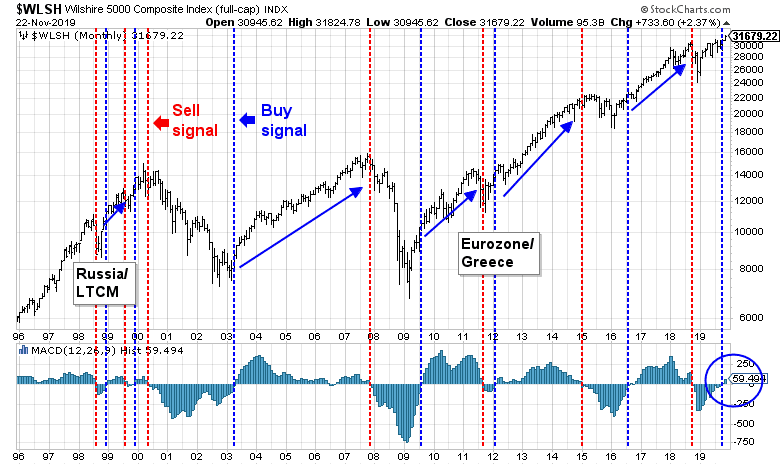
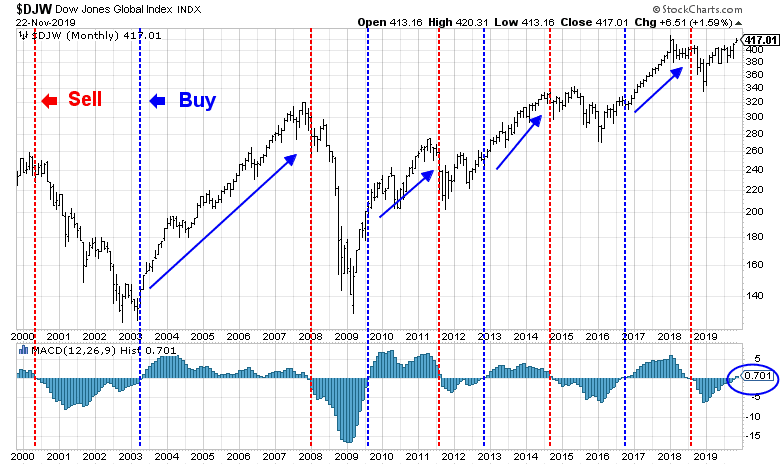
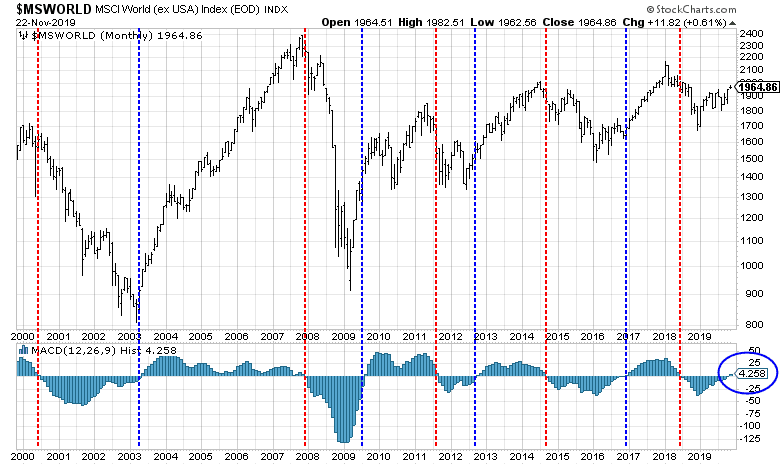
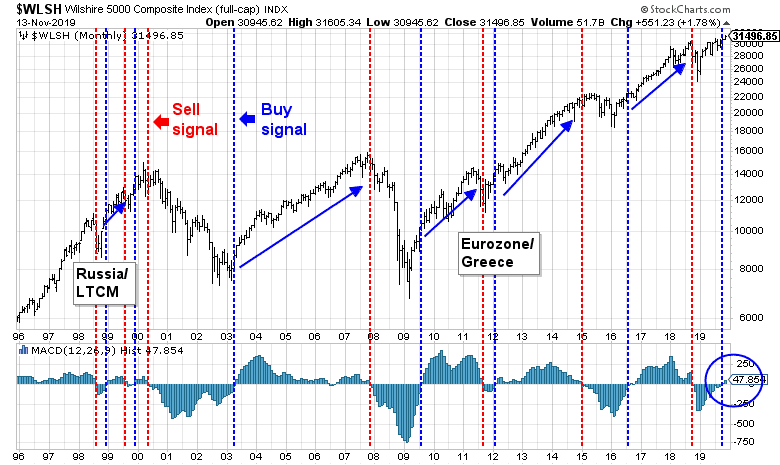
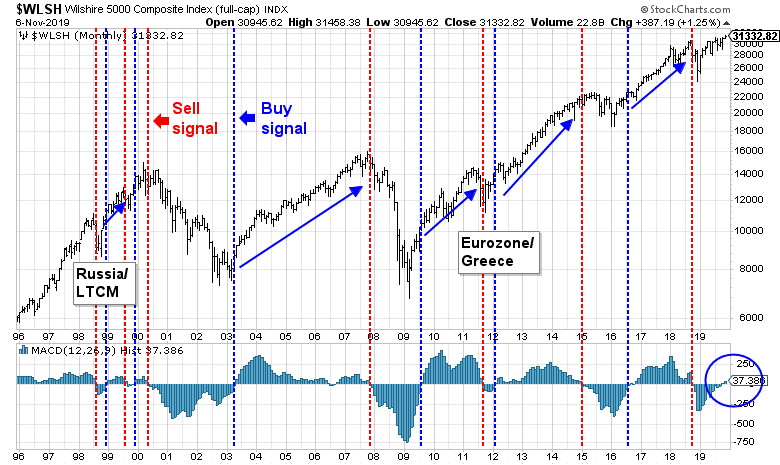
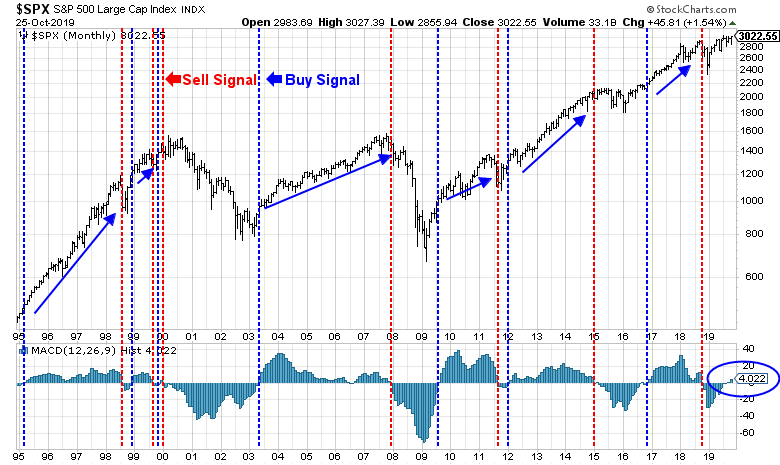
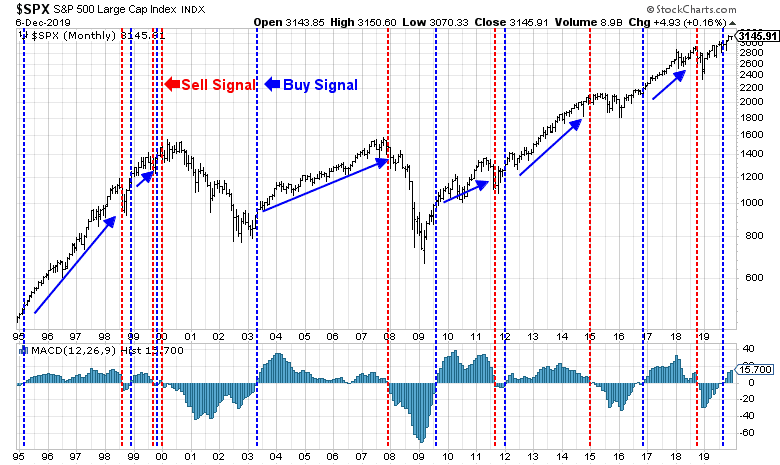
Simply put, the intermediate and long term technical and fundamentals are bullish. I have written extensively about the surefire monthly MACD buy signal, which still stands. With both institutional and retail investors under-invested, there are just too many dip buyers, which suggests that any pullback should be shallow.
Santa Claus is coming to town. Get ready for the beta chase to begin about mid-December after a brief pause in the advance.
My inner investor is bullishly positioned and overweight equities. My inner trader is long the market, but he believes that it may be prudent to take partial profits early next week if prices don’t drop immediately. He is prepared to add to his long positions should the market re-test its lows while exhibiting positive RSI divergences.
Disclosure: Long S&P 500L