Preface: Explaining our market timing models
We maintain several market timing models, each with differing time horizons. The “Ultimate Market Timing Model” is a long-term market timing model based on the research outlined in our post, Building the ultimate market timing model. This model tends to generate only a handful of signals each decade.
The Trend Model is an asset allocation model which applies trend following principles based on the inputs of global stock and commodity price. This model has a shorter time horizon and tends to turn over about 4-6 times a year. In essence, it seeks to answer the question, “Is the trend in the global economy expansion (bullish) or contraction (bearish)?”
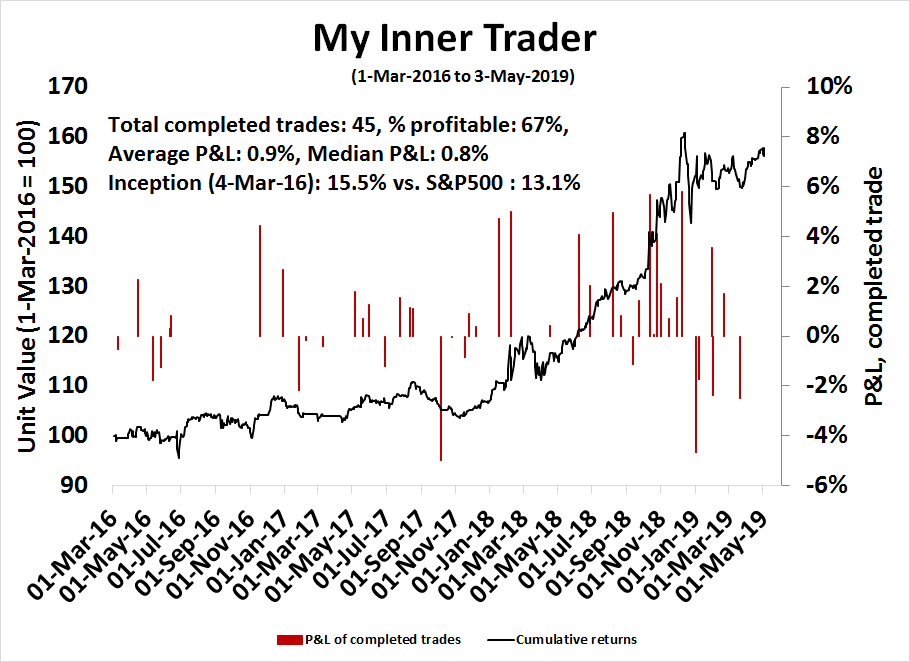
My inner trader uses a trading model, which is a blend of price momentum (is the Trend Model becoming more bullish, or bearish?) and overbought/oversold extremes (don’t buy if the trend is overbought, and vice versa). Subscribers receive real-time alerts of model changes, and a hypothetical trading record of the those email alerts are updated weekly
here. The hypothetical trading record of the trading model of the real-time alerts that began in March 2016 is shown below.
The latest signals of each model are as follows:
- Ultimate market timing model: Buy equities
- Trend Model signal: Bullish
- Trading model: Bullish
Update schedule: I generally update model readings on my site on weekends and tweet mid-week observations at @humblestudent. Subscribers receive real-time alerts of trading model changes, and a hypothetical trading record of the those email alerts is shown here.
Are the green shoots turning brown?
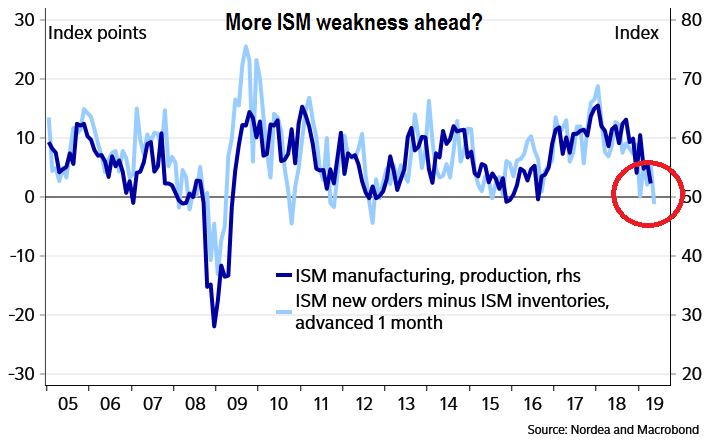
Just when you think the global economy is starting to spring green shoots, the skies have darkened and some of those shoots may be turning brown. In the US, ISM Manufacturing fell and missed expectations. And that’s not all. Analysis from Nordea Markets concluded that the internals are pointing to further weakness.
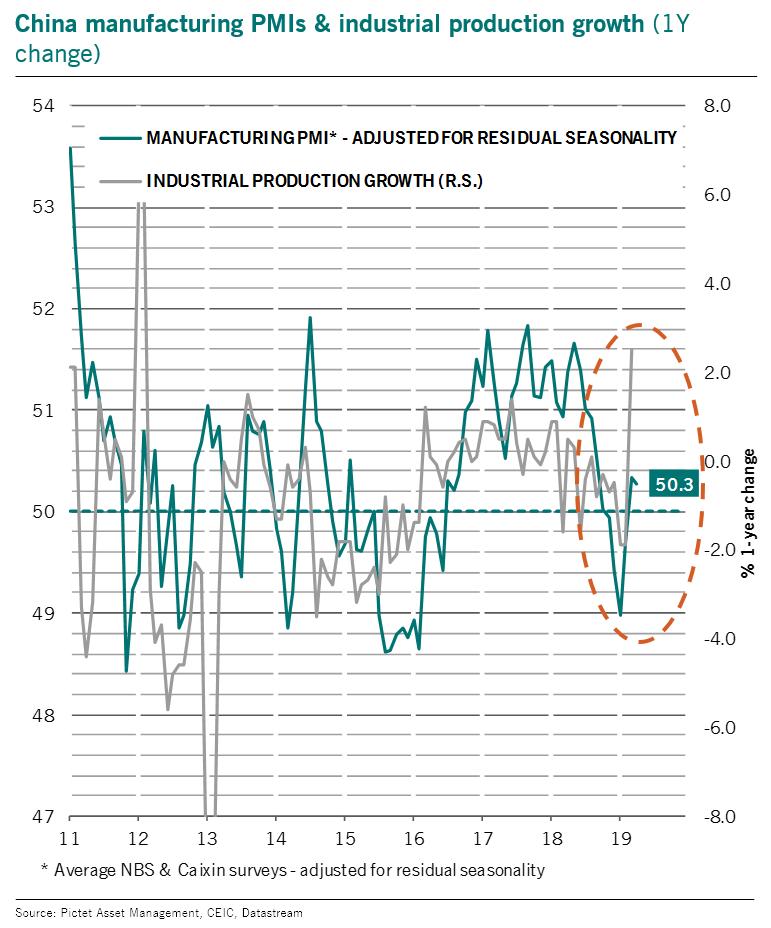
In China, both the official PMI, which is tilted towards larger SOEs, and the Caixin PMI, which measures SMEs, fell and missed expectations. These readings have cast doubt on the longevity of Beijing’s stimulus driven rebound.
On the other hand, the Non-Farm Payroll report came in ahead of expectations. In Europe, the PMIs for peripheral countries like Italy and Greece are outperforming Germany. In addition, exports from Korea and Taiwan, which are highly globally sensitive, have rebounded indicating recovery.

What’s going on? How do we interpret these cross-currents?
I agree with Rob Hanna’s insightful comment that “Tops Wobble Before Falling Over”. My review of the market’s technical conditions reveals the market is not wobbling yet. Any market wobble would be seen in NASDAQ and semiconductor stocks. Until Technology and NASDAQ leadership starts to falter, and if their leadership is not replaced by the reflation-sensitive cyclical groups, we remain bullish on equities.
Look for the market to wobble first
It can be useful during these periods of macro and fundamental uncertainty to turn to technical analysis. The market’s technical signals represent messages of how expectations are evolving, which investors should heed.
As stock prices have been on a tear since the Christmas Eve lows, there is some natural nervousness that the market has risen too far too fast. Rob Hanna at Quantifiable Edges made an insightful comment that “Tops Wobble Before Falling Over”, which he wrote on Thursday just after the post-FOMC market downdraft:
I’ve shown numerous studies in the past that suggest uptrends often become choppy before they ultimately end. It is highly unusual for an uptrend that is showing strong persistence to abruptly top out. The study below demonstrates this concept. The persistent uptrend of late has kept SPX above its short-term moving averages for an extended period. Tuesday, after 22 consecutive closes above the 10ma, SPX dipped down and closed below it. The study below looks at performance following other instances where SPX closed below its 10ma for the first time over 15 days.

Hanna continued:
The strong upslope serves as some confirmation of the bullish edge. As my friend and colleague, Tom McClellan says, “A spinning top does not just stop spinning and fall over. It wobbles first.” I saw a few bullish studies along these lines last night. Odds seem to suggest a good chance of a bounce arriving in the next few days.
My own review of sector leadership confirms that, so far, the market is not wobbling yet.
The message from sector analysis
A review of sector leadership came to the following conclusions:
- FAANG stocks are still dominant
- Cyclical stocks are showing signs of emerging leadership
- Defensive sectors are lagging
Barring any “wobbles” from these themes, the strength of high beta, glamour, and cyclical sectors lead to the conclusion that the path of least resistance for stock prices is still up.
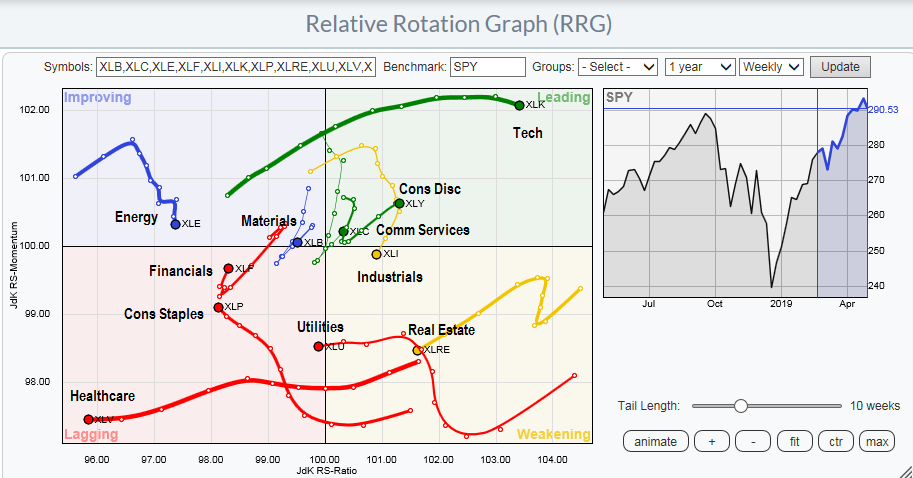
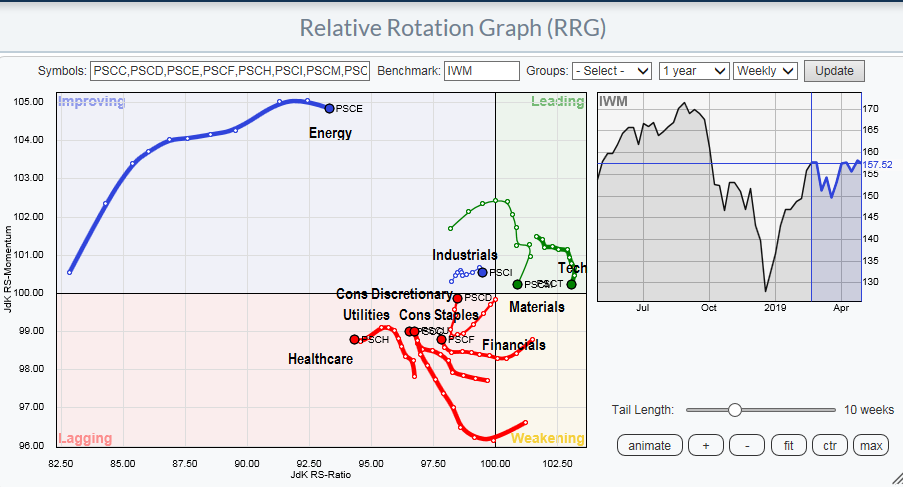
The primary tool for a sector review is the Relative Rotation Graphs. RRG charts are a way of depicting the changes in leadership in different groups, such as sectors, countries or regions, or market factors. The charts are organized into four quadrants. The typical group rotation pattern occurs in a clockwise fashion. Leading groups (top right) deteriorate to weakening groups (bottom right), which then rotates to lagging groups (bottom left), which changes to improving groups (top left), and finally completes the cycle by improving to leading groups (top right) again.
The RRG analysis of US large cap sectors shows the dominance of FAANG stocks. Technology stocks are in the top right quadrant, indicating strength. Other strong sectors include Consumer Discretionary (AMZN), and Communication Services (FB, GOOG, GOOGL). By contrast, defensive sectors such as Utilities, Real Estate, and Consumer Staples are all in the bottom half of the chart, which indicate weakness. While Healthcare stocks are often classified as defensive, their recent weakness are attributable to market jitters over a Democrat victory in 2020, and the negative implications of a Medicare for All program.
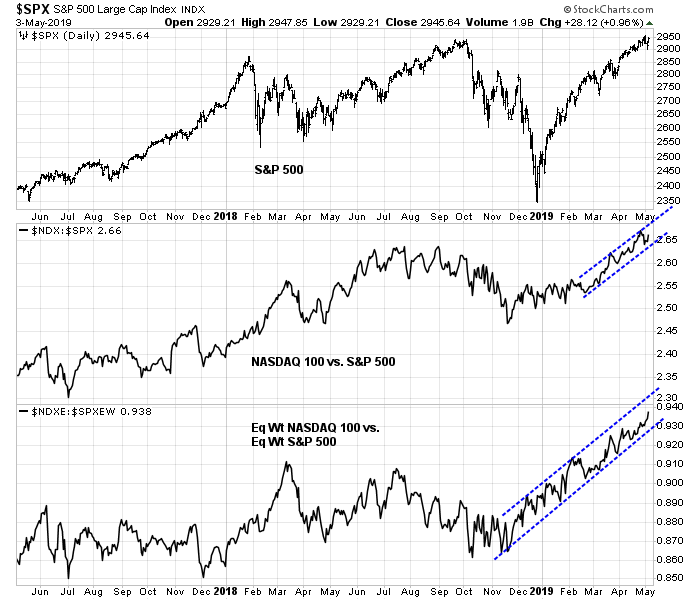
I have written about this before, but FAANG leadership is especially evident in the strong relative strength of NASDAQ 100 stocks, both on a capitalization weighted basis (middle panel), and on an equal-weighted basis (bottom panel).
An RRG analysis of small cap sectors reveals some common themes and notable differences. Tech stocks are still the market leaders, and defensive sectors are still the laggards. However, Consumer Discretionary stocks have moved from the top half of the chart to the bottom half, as small caps does not have AMZN to play a leadership role. I therefore interpret this sector as weaker than it actually is on the large cap chart.
Sometimes, a cross-border analysis can be revealing, as factor and sector returns are often correlated across different global regions. An RRG analysis of European sectors tells a similar story. Technology stocks are also the market leaders, and defensive sectors are mainly the laggards. One key difference is the cyclical sectors are more advanced in their leadership development than the US.
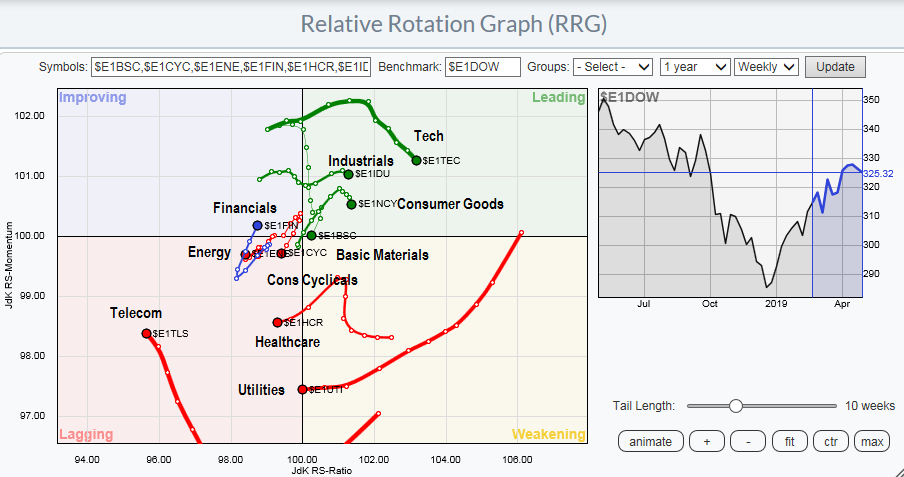
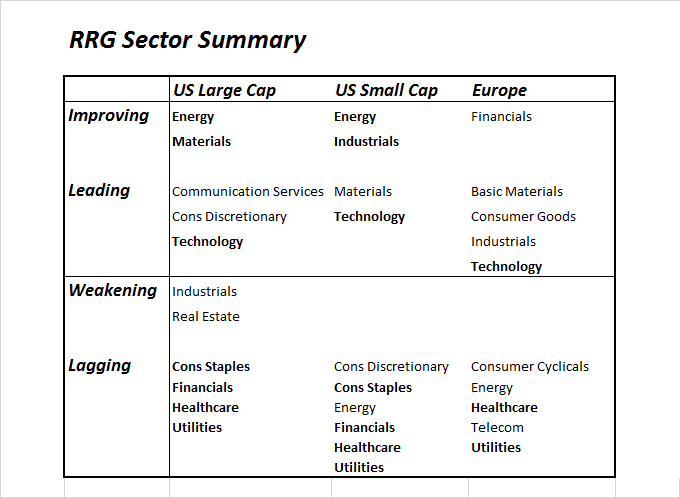
The following table of US large cap, small cap and European sector leadership summarizes the important leadership themes. Technology is consistently in the leading quadrant across all three groupings, and defensive sectors are laggards. In the US, late cyclicals such as Energy and Materials are starting to show some life,
Limitations of RRG analysis
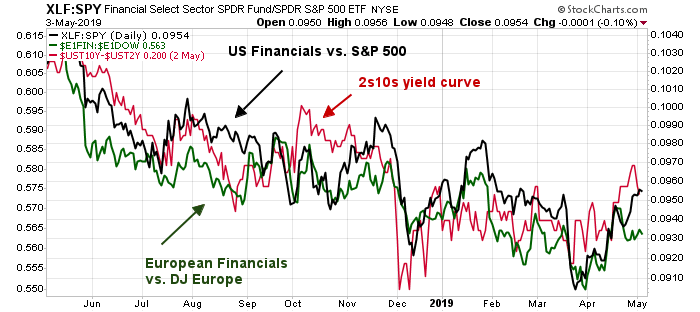
I would, however, like to highlight some of the limitations of RRG analysis. One problem with this technique arises because of the quirks of the arbitrary boundaries of RRG charting. American large and small cap Financial stocks are in the bottom left “lagging” sector, but on the verge of rising into the top left “improving” quadrant, while European Financials have already risen to “improving”. The relative performance of US and European Financials are roughly the same. The chart below depicts the market relative returns of US Financials (black line) and European Financials (green line). In the past, the relative strength of this sector has been highly correlated to the shape of the yield curve, and the current steepening trend should be supportive of this sector.
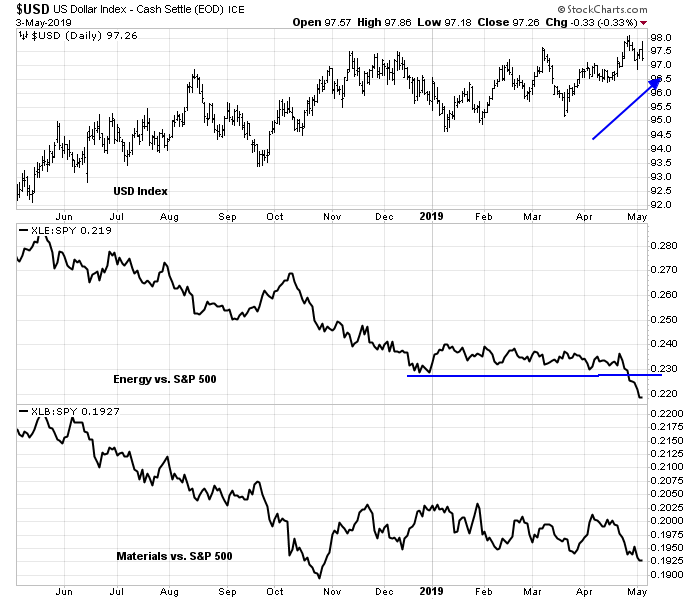
The other sectors that may be doubtful as emerging US market leaders are the deep cyclical resource extraction sectors of Energy and Materials. The relative performance of these sectors is highly sensitive to the USD, and the recent strength of the greenback will be headwinds for these sectors.
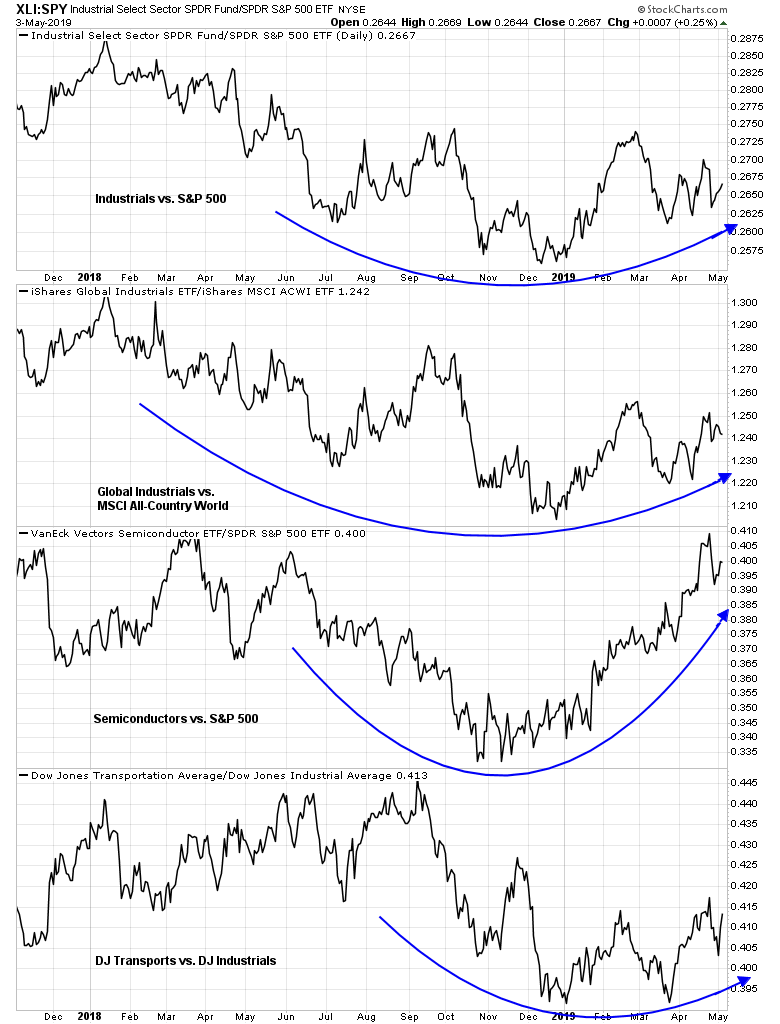
By contrast, the relative performance of other cyclical sectors and groups seems more constructive.
Investment implications
It is not enough for a market analyst to analyze the market from a purely technical perspective, and then come to a conclusion based purely on the charts. Risk and return exist in many dimensions, and my review would be incomplete without a review of the macro backdrop.
To recap, our review of sector leadership came to the following conclusions:
- FAANG stocks are still dominant
- Cyclical stocks are showing signs of emerging leadership
- Defensive sectors are lagging
Let’s start with the cyclical stocks. The roots of the cyclical upturn comes from China. It was evident last year that the Chinese economy was slowing. In response, the authorities abandoned their previously stated objective of deleveraging, and rebalancing growth, to a highly targeted program of credit driven stimulus, as well as fiscal stimulus in the form of tax cuts. Evidence of a turnaround was shown in Q1, which provided the impetus for renewed optimism for global growth.
The latest round of economic statistics from Asia suggest that the recovery may be stalling. To be sure, a nascent export recovery is taking hold in highly China sensitive economies such as Korea and Taiwan. Based on these readings, I do not expect China to save the world with another stimulus growth leg, but Beijing has managed to stabilize Asian economies. Everything else being equal, the recovery is starting to look L-shaped.
That said, the Chinese leadership will not allow the economy to tank ahead of the October celebration of the founding of the PRC. Undoubtedly, they are counting on a US-China trade deal to provide the next round of stimulus for the economy. US Trade Representative Robert Lighthizer and Treasury Secretary Steven Mnuchin went to in Beijing last week for a round of talks which were described as “productive”. Vice Premier Liu He is expected to lead a delegation of Chinese officials to Washington in the coming week for further discussions. It is evident that both sides want an agreement, and official sources of hinted that we could see the outline of a deal by this coming Friday. The market has anticipated the prospect of a trade agreement before, and successive cries of “wolf” are being increasingly discounted or ignored. Nevertheless, press reports indicate that both sides appear to have given ground on substantive issues, and a positive announcement may be at hand. Should the discussions fall apart, I would expect the Chinese authorities would resort to Plan B, which is another round of stimulus so that growth holds up until Q4.
A Xi Put is firmly in the market. Expect the cyclical and reflation trade to keep working, at least until later this year.
In the US, the Powell Fed adjusted market expectations of a rate cut this year by stating that it doesn’t know whether the next move will be up or down. “Patience” has changed to “transitory”:
We expect that some transitory factors may be at work. Thus, our baseline view remains that with a strong job market and continued growth, inflation will return to 2 percent over time, and then be roughly symmetric around our long-term objective.
In a November 28, 2018 speech, Jerome Powell made it clear that one key focus of the Powell Fed is to avoid ad hoc responses to financial crises, and to develop a more systematic approach to ensure financial stability:
Outside of these crisis responses, however, systemic issues were not a central focus of policy.
The Global Financial Crisis demonstrated, in the clearest way, the limits of this approach. Highly inventive and courageous improvisation amid scenes of great drama helped avoid another Great Depression, but failed to prevent the most severe recession in 75 years. The crisis made clear that there can be no macroeconomic stability without financial stability, and that systemic stability risks often take root and blossom in good times.3 Thus, as the emergency phase of the crisis subsided, Congress, the Fed, and the other financial regulators began developing a fundamentally different approach to financial stability. Instead of relying on improvised responses after crises strike, policymakers now constantly monitor vulnerabilities and require firms to plan in advance for financial distress, in a framework that lays out solutions in advance during good times.
Even though the Fed has signaled that it doesn’t know whether it will cut rates this year, the Powell Financial Stability Put remains in place. The lagging relative strength of defensive sectors is testament to the floor that the Fed is likely to put on stock prices.
At the same time, with the cyclical and reflation trade in doubt, the market has gravitated to the only source of consistent growth, which are the FAANG and Technology stocks.
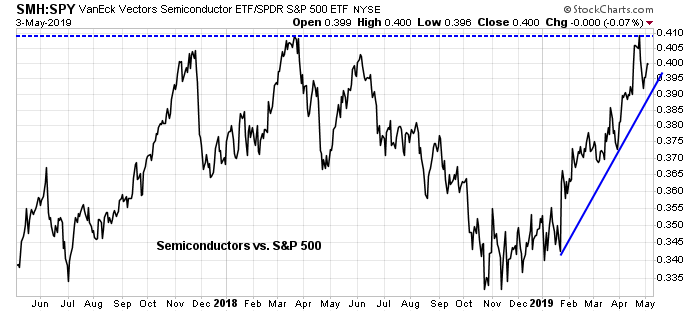
Keep an eye on the semiconductor group, which has both Tech and cyclical qualities. The group was a strong market leader, but became over-extended and was rejected a relative resistance. Despite the pullback, the relative uptrend remains intact.
Any market wobble would be seen in NASDAQ and semiconductor stocks. Until Technology, and NASDAQ leadership starts to falter, and if their leadership is not replaced by the reflation sensitive cyclical groups, I remain bullish on equities.
The week ahead
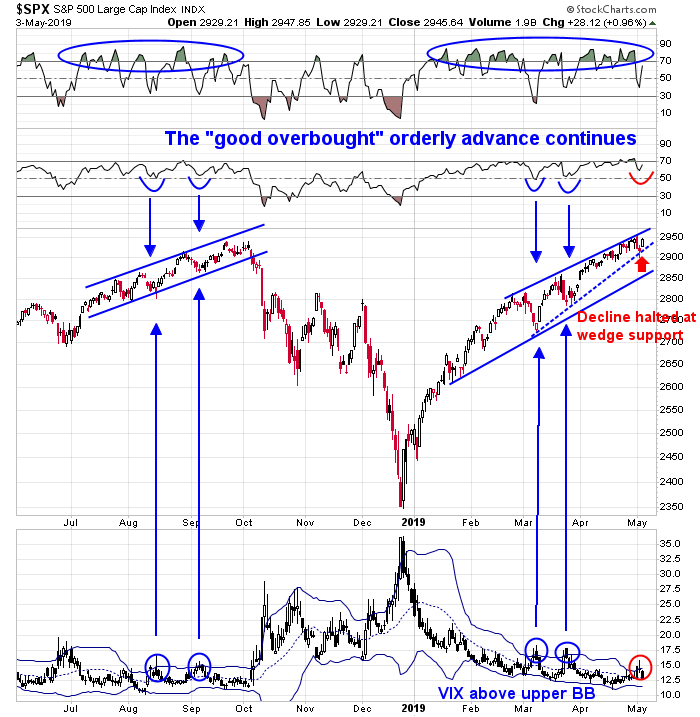
Looking to the week ahead, the stock market appears to be resuming its orderly advance after a brief post-FOMC downdraft. Subscribers received an alert early Thursday indicating that short-term indicators had flashed buy signals, based on the assumption that the market would continue its slow grind upwards. The SPX was testing its wedge support, the VIX Index had breached its upper Bollinger Band indicating a short-term overbought condition, and the 14-day RSI was near levels where it had bottomed in the past during this advance. I was fortunate in that call, when stock prices staged a strong turnaround on Friday after the April Jobs Report printed a positive surprise.
Long-term sentiment is supportive of further market strength. Mark Hulbert highlighted an academic study by Malcolm Baker and Jeffrey Wurgler, Investor Sentiment and the Cross-Section of Stock Returns. The latest readings from the Baker-Wurgler model indicate no signs of market froth indicative of a major market top.

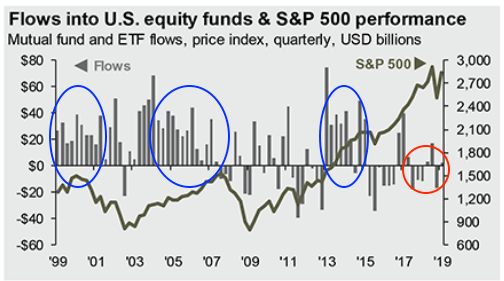
The analysis of equity fund flows came to a similar conclusion. Enthusiasm for stocks is nothing compared to the 1999-2000 NASDAQ top, or the 2005-07 top (via Urban Carmel).
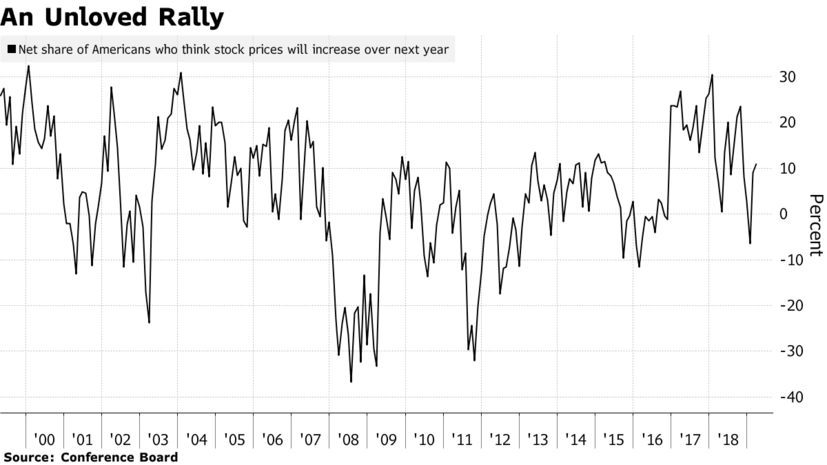
As well, the Conference Board`s measure of long-term equity sentiment is neutral, and not excessively bullish.
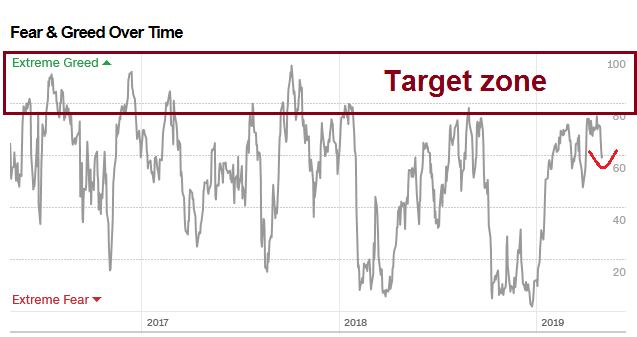
Intermediate-term sentiment models like the Fear and Greed Index reset and recycled after last week’s brief scare. The index closed at 60 on Friday, which is well below the 80-100 target zone where past rallies have topped out.
At the same time, Q1 earnings season is providing positive fundamental momentum support for stock prices. Both earnings and sales beat rates are above their historical averages, and forward 12-month EPS estimates continue their trend upwards. At the current rate of improvement, the market may be able to avoid the dreaded “earnings recession” of a YoY quarterly earnings decline that was feared by many investors several weeks ago.

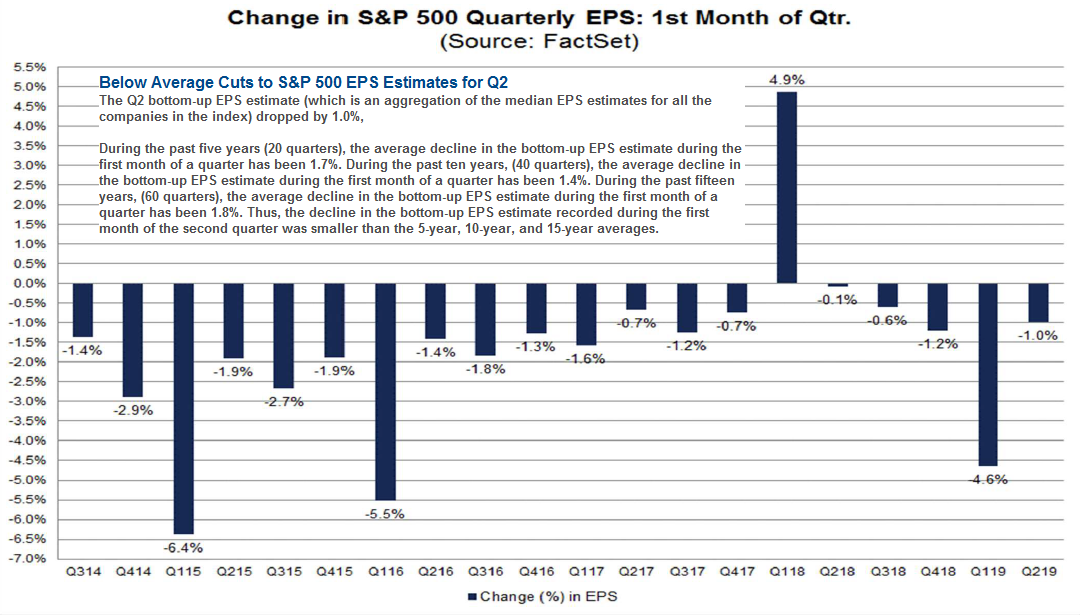
As well, FactSet reported that the rate of quarterly estimate cuts for Q2 is lower than the historical average, indicating a better than average fundamental outlook.
From a technical perspective, NASDAQ 100 leadership remains intact.
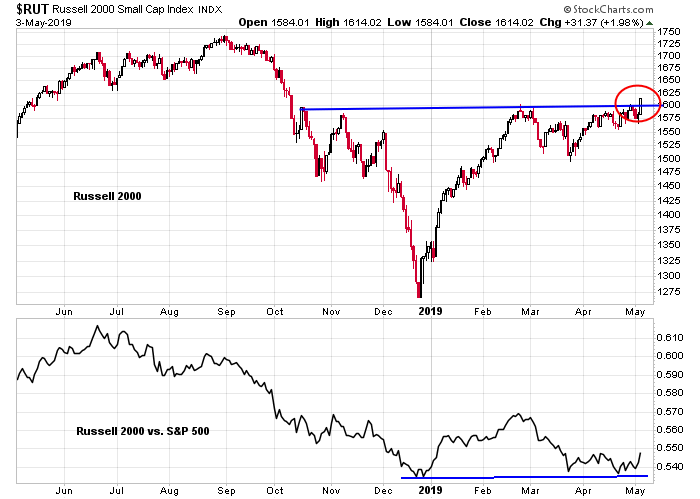
Another encouraging sign is the upside breakout by the small cap Russell 2000. While this index is still well below its all-time high, the breakout is likely to spark some animal spirits and increased risk appetite among traders.
The combination of benign intermediate and long-term sentiment readings and positive price and fundamental momentum is bullish. My inner investor is overweight equities. My inner trader added to his long positions late last week, and he is strapping himself in for the ride to further highs.
Disclosure: Long TQQQ, SPXL
Hello Cam, another excellent report. Did you intend to include the chart that this paragraph refers to?: “I have written about this before, but FAANG leadership is especially evident in the strong relative strength of NASDAQ 100 stocks, both on a capitalization weighted basis (middle panel), and on an equal-weighted basis (bottom panel).”
See chart below:
“From a technical perspective, NASDAQ 100 leadership remains intact”
Cam –
(a) Good call last Thursday. More importantly, and even had things not turned out as well on Friday – we appreciate the effort you always make to communicate your takes in real time.
(b) Re growth in China. Below is an opinion piece from 2018 on why China ‘might continue to confound norms:’
https://carnegieendowment.org/2018/03/13/china-s-economy-is-not-normal.-it-doesn-t-have-to-be-pub-75796
Excerpts:
‘China has never been a normal economy. It experienced an average of nearly 10 percent growth rates for almost four decades, a record; it is the first developing nation to become a great power. So why couldn’t it keep defying expectations?
‘What some take to be the Chinese economy’s weaknesses have, in fact, been strengths. Unbalanced growth isn’t evidence of a looming risk so much as a sign of successful industrialization. Surging debt levels are a marker of financial deepening rather than profligate spending. Corruption has spurred, not stalled, growth.
‘Centralized authoritarian power has its benefits, including the ability for those who have it, at least in theory, to correct course rapidly. This has allowed China’s leaders to put the economy on a more sustainable growth path in recent years. The gross domestic product growth rate rebounded last year. Foreign reserves are back up as well. Wages have increased. The recent abolition of term limits for the president and vice-president’s terms gives President Xi Jinping more time and leeway to promote his vision of a more prosperous, modern and powerful China, and with the help of trusted advisers: His former corruption czar, Wang Qishan, is expected to be named vice-president and Liu He vice-premier in charge of the economy. ‘
Trumps tweets today may have thrown a monkey wrench into the bullish outlook. Any changes to your views Cam base on this late breaking news?
No market can escape unexpected news, whether good or bad. We have to see how it reacts to that news.
As I write this, the futures market is not even open, and the even more illiquid CFD market opened down over -1%, and then drifted up to -0.8%. Sunday night futures is notoriously fickle and it is not unusual at all to see big moves reversed by Monday’s open.
I would prefer to watch how the market trades on Monday, and how it closes before getting overly excited. Also watch internals, such as how the leadership is reacting. Are they outperforming or underperforming, and by how much?
This sounds like a typical Trump move of negotiation by Twitter. There is a large Chinese delegation arriving in Washington on Wednesday for detailed talks, and this sounds like a way of putting pressure on the Chinese.
In my opinion, there is a growing appreciation for the fact that a real deal will take time + acknowledgement that the ‘first take’ may not be as comprehensive as the next take or the final agreement.
Looking at the big picture, that trade talks are even occurring represents tremendous progress.
Traders have reacted positively to every tweet re progress on US/China trade talks – until recently. No one is able to predict how the President’s latest tweet will affect ES traders in a few hours, or traders in Asia overnight, but should the reaction be positive? That’s the kind of reaction the ‘market’ thrives on – the ones that arrive out of left field.
DJIA futures off -450+ points, SPX futures off -50+ points. ES traders obviously view the tariff threat as a negative. The fact that futures have gapped down hard at the open is a plus – it opens the door for capitulation + a reversal by the time US markets open on Monday. Just my opinion.
Cam, I was hoping you would also comment on relative performance of sectors by style. Specifically, small-caps have under-performed large caps in this rally; do you expect that under-performance to continue? Thank you.
I have become a believer in Fragility. I calculate how sectors perform in a correction from a peak in the general market to a recovery to the same level. A Fragile sector underperforms and an Anti-Fragile outperforms. Here how I will be using this. When the market has a big upswing, like the last few months, I will shift to Anti-Fragile sectors to still be in equities but with defensive possibility of outperforming if the market dips.
Fragile sectors tend to do the best from a correction low. A good example of this is Energy. In the last two rallies (Feb 18 to Sept 18 and Dec 18 to now), Energy has outperformed, but when we look at the 9 month momentum, it is underperforming by a huge amount. That’s because it dives so much when markets fall (very Fragile). This just shows that things that fall the most in a correction, could rally the most when it turns back up.
Therefore, a perfect strategy would be to switch to Anti-Fragile at peaks and then back to Fragile at a correction low.
The sectors that were Anti-Fragile in both of the last corrections (Jan 18 to Aug 18 and Sept 18 to April 19) are (in order) Software, Cloud Computing, Cyber Security, Internet, Utilities, Real Estate, Clean Energy, Technology, NASDAQ, REITs, Consumer Discretionary, Minimum Volatility, Growth
Interesting that the top three are software related where there is no worry of tariffs, no borders.
Two sectors were dogs in the 2018 correction but Anti-Fragile this last one (Sept 18 to April 19), China and Gold. Gold woke up in December in that crash. China and Russia are huge buyers. The Iran situation is causing worries about US blocking access to the global financial payments system to their enemies. There could be a move away from the dollar that may include gold.
The new China leadership, I’ve been talking about since last year. Still believe they are the global stock market leaders and will be Anti-Fragile in a correction.
My suggestion is to check your holdings for Fragile stocks/sectors now that markets have rallied 25%.
Thanks for that Ken. It’s not related but reminded me of a research some time ago that evaluates performance of fund managers. It found that one of the important factors in differentiating the talented ones are based not only their funds’ max drawdown during corrections but also the speed at which it bounces back from the drop.
Cam, with the *unexpected *threat of further tariffs on Chinese goods (including additional 325bn), how does that your overall market outlook?
Thx
Sanjay- IWM has outperformed SPY by almost 4 basis points YTD. Don’t know why you think they’ve underperformed.
SPX had made an all-time high. RUT has not.
Correct. However that is a factor for how far the RUT fell relative to SPX in 2018. It has still out performed SPX YTD.