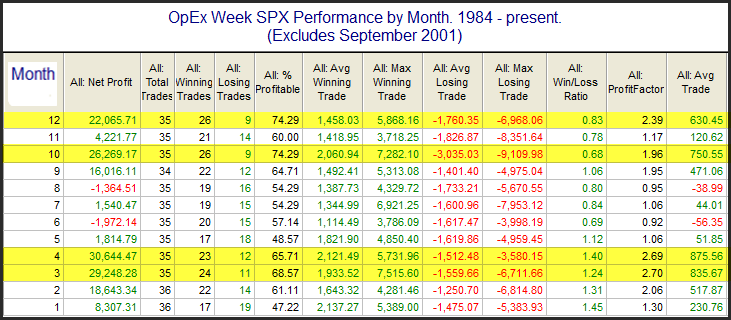
Mid-week market update: The market strength this week was no surprise to me based on my seasonal analysis I published on the weekend (see Will a volatility collapse lead to a market collapse?). Last week was option expiry (OpEx) week, and OpEx weeks have historically been bullish for stocks. In particular, Rob Hanna at Quantifiable Edges found that April OpEx week was one of the most bullish ones of the year.
However, last week saw the SPX edge down -0.1%, and my own analysis found that April post-OpEx weeks that saw market declines tended to experience strong rallies (red bars). By contrast, the market had a bearish tilt after strong April OpEx weeks (green bars).
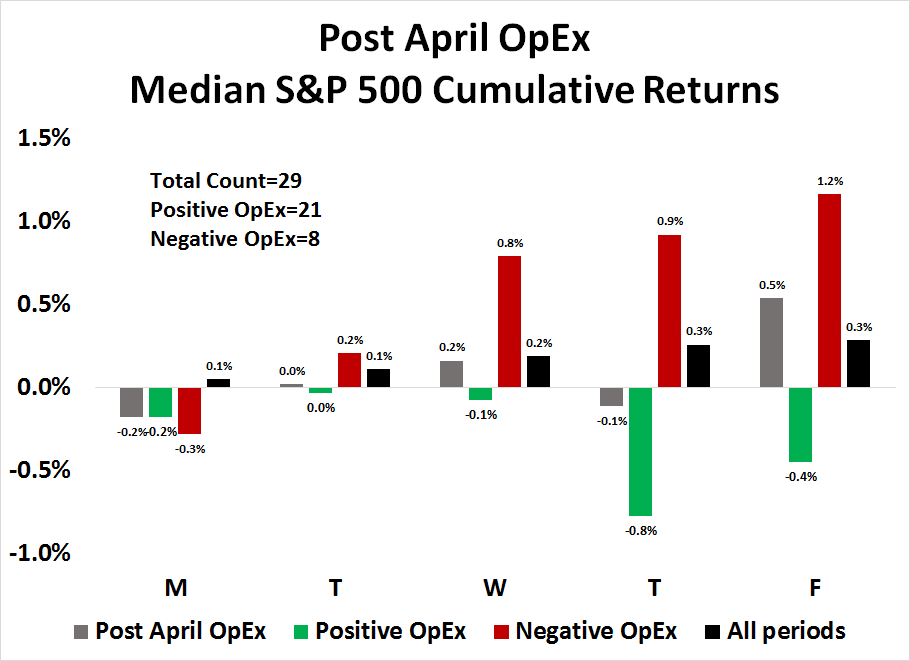
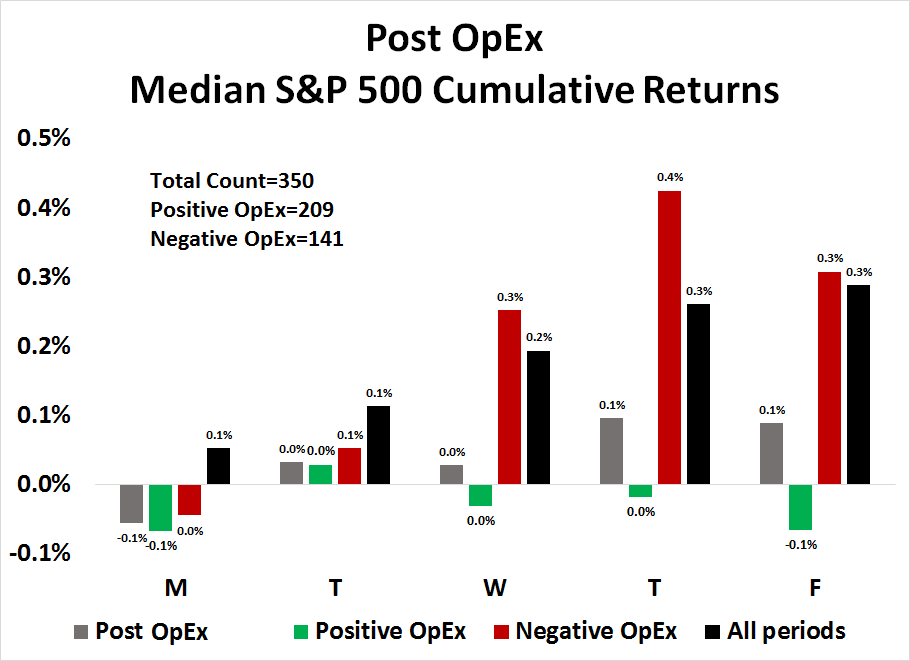
This historical study was conducted from 1990, and the sample size of losing April OpEx weeks was relatively small (N=8). Here is the same analysis for all post-OpEx weeks. The conclusion is the same. Strong OpEx weeks were followed by market weakness, and vice versa, though the magnitude of the effect was not as strong.
Could this week’s upside breakouts of the major indices be attributable to an OpEx effect? If so, could the breakout be a fake-out?
Cautionary signals
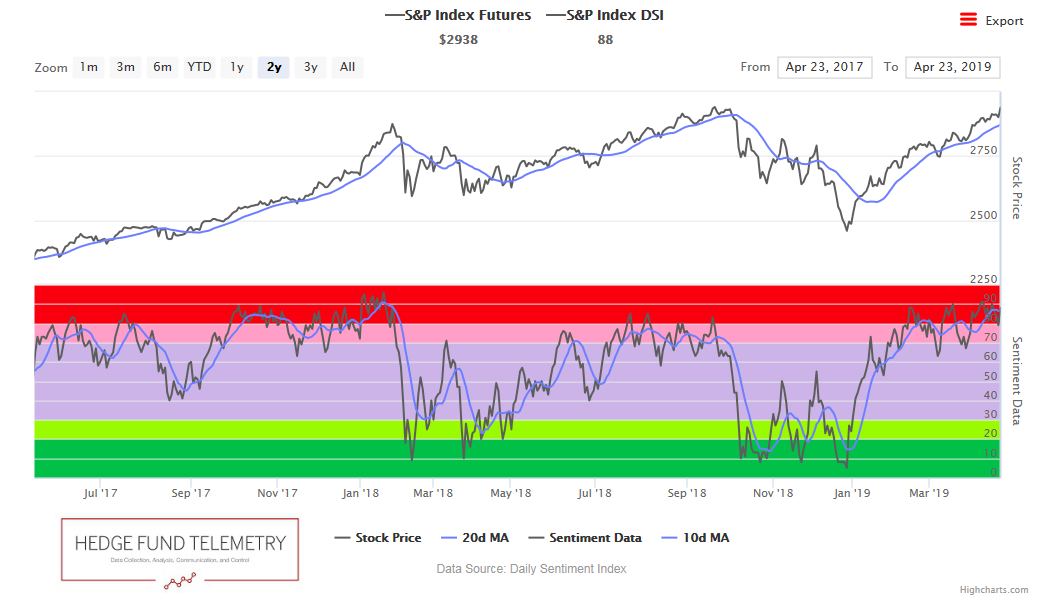
A number of cautionary signals are appearing. The Daily Sentiment Index (DSI) is highly elevated, indicating an overbought market (but you knew that).
Mark Hulbert’s Stock Newsletter Sentiment Index (HSNSI) is also flashing a crowded long reading.
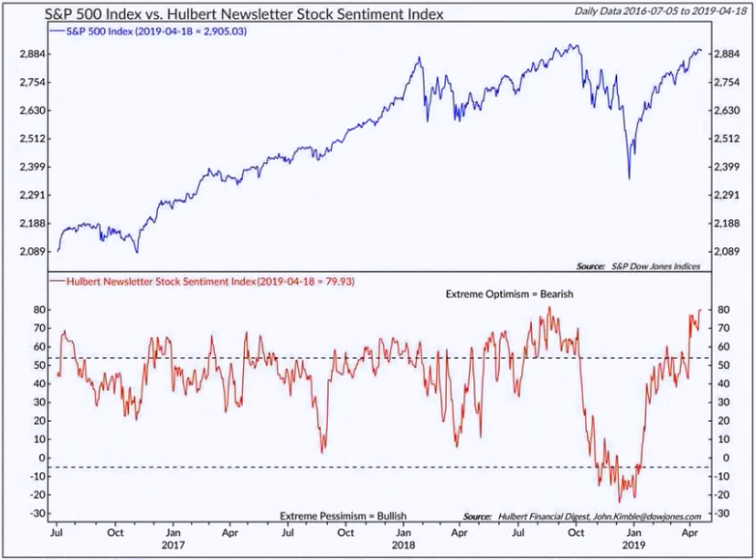
I would highlight a caveat for traders. Sentiment models tend to behave very differently at market bottoms and tops. While sentiment signals are good actionable at bottoms because bottoms tend to be panic driven, they don’t behave in a similar fashion at market tops as overbought markets can stay overbought for a long time.
Momentum, momentum!
In fact, turning cautious as the market makes all-time highs feels like standing in front of a freight train. It is said that there is nothing more bullish than a market making a fresh high.
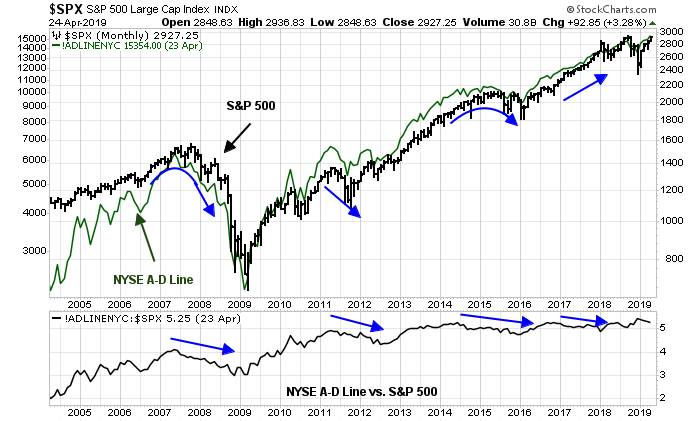
Here is a different take on market breadth that is supportive of the bull case. Conventional breadth analysis uses the generals and troops analogy. If the large cap indices (generals) are leading the charge, but the equal weighted or small cap indices (troops) are not following, then that is a negative divergence which warrants caution. However, divergences can take a long time to play out, and signals have historically not been actionable.
I can turn that around in a different way. In the short run, I am watching the performance top five sectors in the index, which represent just under 70% of index weight, for clues to market direction. If these heavyweights (generals) are all performing well, it doesn’t matter what the smaller weights (troops) do, the market is going higher.
As the chart show, two of the top five (Technology and Consumer Discretionary) have staged relative performance upside breakouts. The relative performance of Financial stocks has historically been correlated with the 2s10s yield curve, and they should improve as the yield curve has steepened. Communications Services are performing in line with the market, but the sector is improving. Healthcare, which had been dragging down the market, has stabilized and appears to be trying to find a bottom.
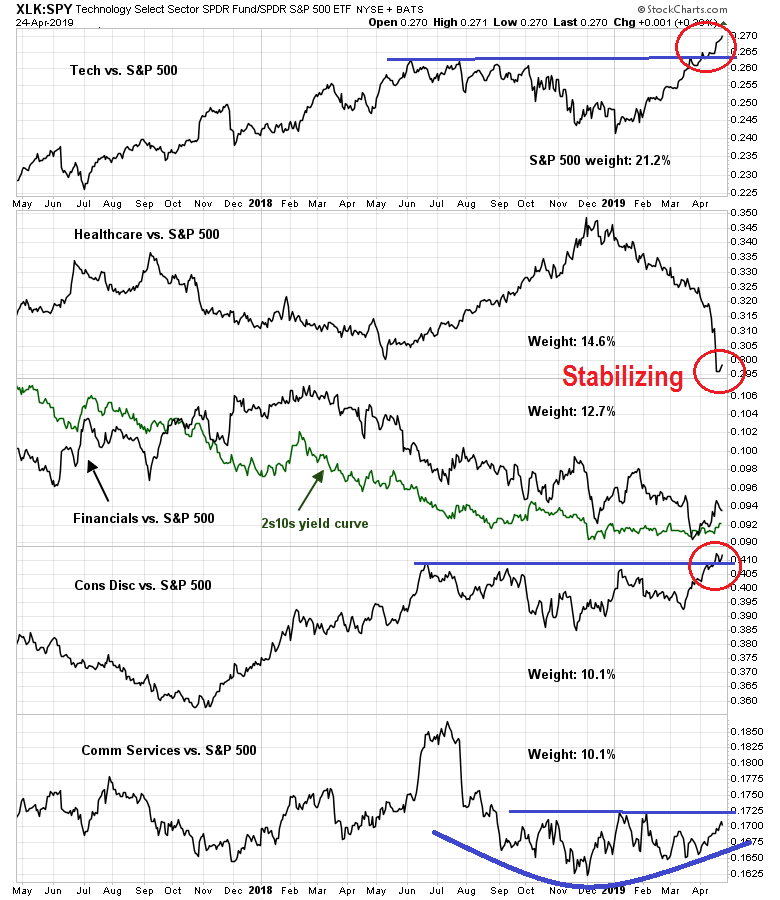
In short, the top five sectors are either strong, or showing signs of strength. None are laggards, which should be supportive of further gains.
In the short run, the US equity market should continue to grind up as long as sentiment doesn’t become overly exuberant. The market has been rising on a series of “good overbought” conditions on short-term RSI-5 momentum (top panel). It has paused or staged minor corrections whenever it became overbought on intermediate term RSI-14 momentum, or tested the top of its rising uptrend line. If this behavior can continue, stock prices can rally to further new highs.
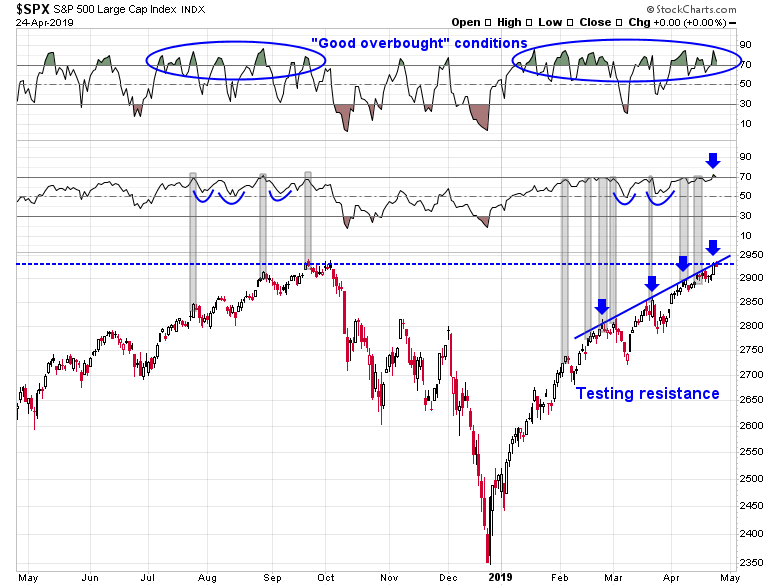
I would be more concerned if it were to stage an upside breakout through the rising uptrend, and RSI-14 becomes more overbought. That would be a signal of excessive giddiness to sell into.
My inner investor remains overweight equities. My inner trader is also bullish. He took some partial profits on his long positions when the market hit the rising resistance line yesterday, and he is prepared to buy more on a pullback.
Disclosure: Long SPXL
Can you let us know when you take partial profits or recommit the money you took off the table via a Tweet? Thx.
These minor adjustments are designed to catch small blips of no more than 1% and very difficult to time. Refer to my previous comments about how my risk profile is different from your risk profile.
I can write about what to buy and sell. I can’t write about how much to buy and sell because of differing risk profiles.
I disclose my positions as disclosures of potential conflicts. They are not designed to be a substitute for trading or portfolio advice.
Are you still bullish on peripheral Europe?
Peripheral Europe, and Europe itself have started to pull back a little, but I am still long EWI on a longer term view.
Another strange stock market statistic came out. Margin loans are DOWN last month when markets went solidly UP. Very different from the norm.
Makes me wonder who the hell is doing all the buying?
Hedge funds have one of the lowest exposure in seven years. This is smart money that was out of the market in 2007-08 peak.
GDP growth has come back with a vengeance, at a record low unemployment. Is wage growth going to creep into inflation here, soon, forcing the fed to raise rates?
technical aside, market fundamentals have deteriorated reflected in lumber (lead indicator for housing), auto (production run rate higher than sales).
not trying to reconcile fundamentals with equity prices as they are disconnected (most of the time and increasingly so) with CB intervention.
What would be the tipping point for this ever increasing equity prices ignoring fundamentals?
Lumber prices reflect regional (North American) demand and supply, as well as the specifics of Canada/US softwood lumber pricing and tariffs. Don’t be overly focused on any specific indicator. Base metals are behaving much better than lumber.
In addition, I pioneered a report at Merrill Lynch that reversed engineered hedge fund exposures back around 2005 when no one was doing it. Believe me, HFs are not, in aggregate, the smart money. They are, however, the fast money, and you need to pay attention to how they are moving around.
HF PMs are traders with relatively low pain thresholds. The fact that they are underweight equities means they are feeling a lot of pain. In all likelihood, these people are going to capitulate and chase equity beta. There is huge potential for a FOMO rally because of their drawdown sensitivity.
@ Cam,
on a different note, now that TSLA broke support area. What’s next confluence price level in technical terms ?