Preface: Explaining our market timing models
We maintain several market timing models, each with differing time horizons. The “Ultimate Market Timing Model” is a long-term market timing model based on the research outlined in our post, Building the ultimate market timing model. This model tends to generate only a handful of signals each decade.
The Trend Model is an asset allocation model which applies trend following principles based on the inputs of global stock and commodity price. This model has a shorter time horizon and tends to turn over about 4-6 times a year. In essence, it seeks to answer the question, “Is the trend in the global economy expansion (bullish) or contraction (bearish)?”
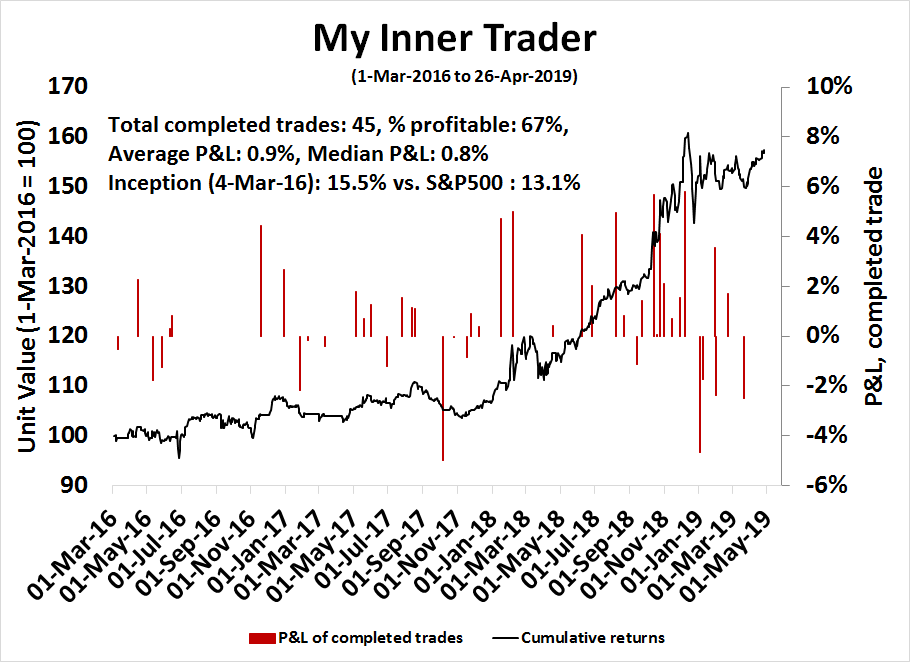
My inner trader uses a trading model, which is a blend of price momentum (is the Trend Model becoming more bullish, or bearish?) and overbought/oversold extremes (don’t buy if the trend is overbought, and vice versa). Subscribers receive real-time alerts of model changes, and a hypothetical trading record of the those email alerts are updated weekly here. The hypothetical trading record of the trading model of the real-time alerts that began in March 2016 is shown below.
The latest signals of each model are as follows:
- Ultimate market timing model: Buy equities
- Trend Model signal: Bullish
- Trading model: Bullish
Update schedule: I generally update model readings on my site on weekends and tweet mid-week observations at @humblestudent. Subscribers receive real-time alerts of trading model changes, and a hypothetical trading record of the those email alerts is shown here.
Sell in May and go away?
The stock market has made a strong V-shaped recovery since the Christmas Eve bottom. The SPX, NASDAQ 100, and NASDAQ Composite have all rallied to all-time highs last week. As we approach the seasonally weak six months of the year, should you sell in May and go away?

Here are the bull and bear cases.
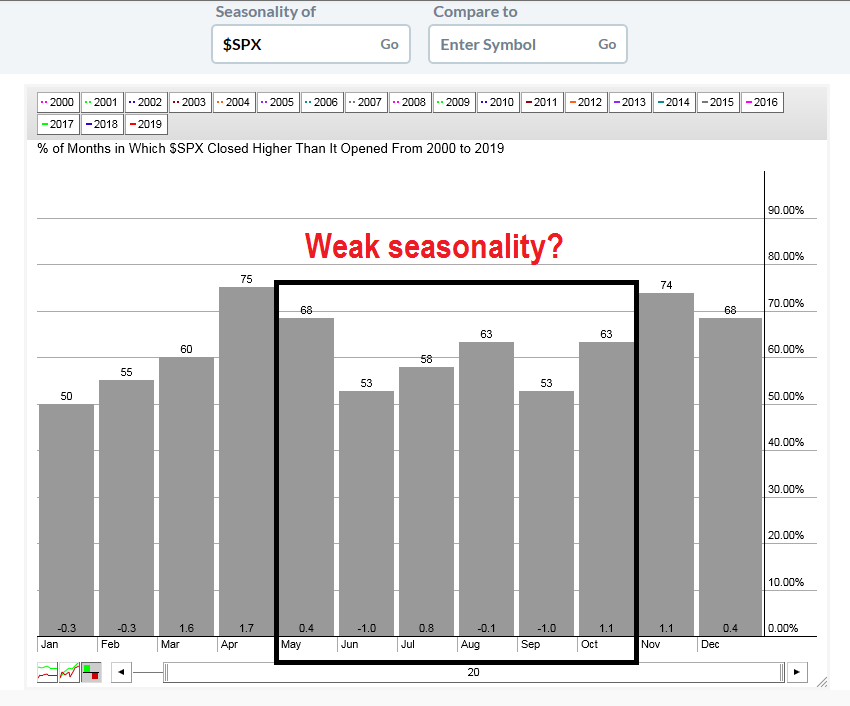
Weak seasonality
Let us first begin with examining the negative seasonality case, which cannot be characterized as wildly bearish. In the last 20 years, the May-October period has been weak for equity returns.
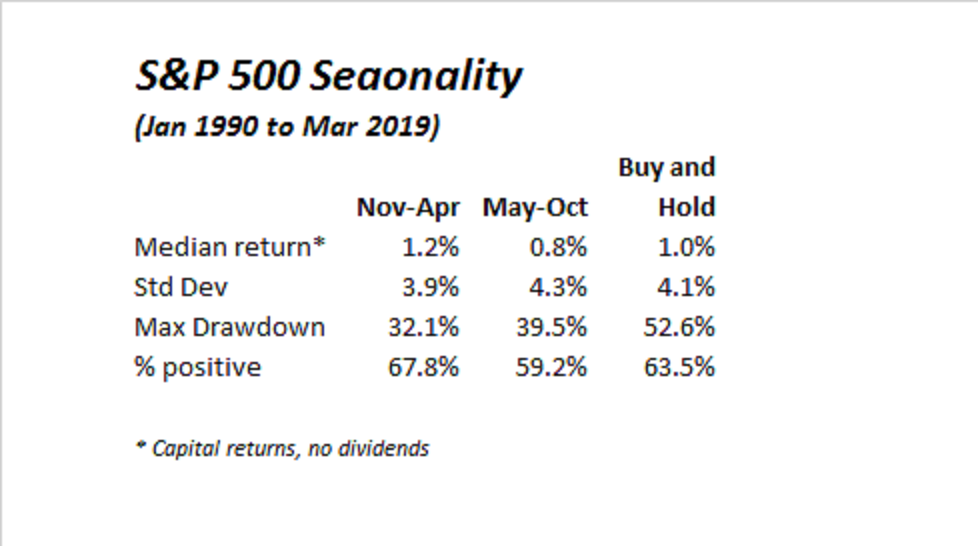
A statistical review of monthly returns from 1990 shows that the May-October period shows lower median returns, and higher risk levels than the November-April period.
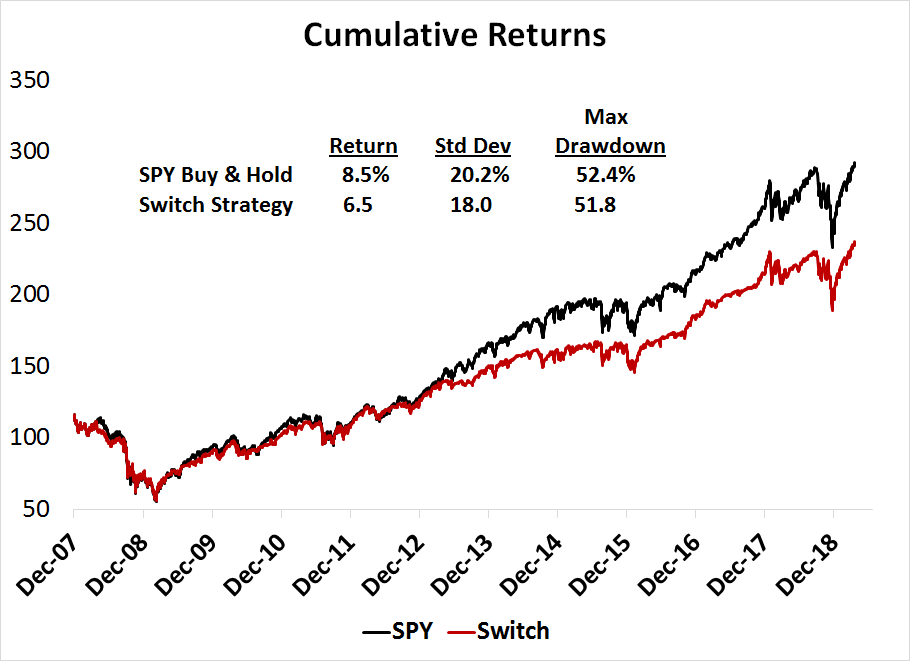
That said, the returns of the seasonally weak May-October period remain positive, and investors would have been disadvantaged by moving to cash during those six months. A limited test of a switch switching strategy, where an investors holds SPY during November-April and switches to a buy-write ETF (which was only available since 2007) also underperformed the simple buy-and-hold benchmark. (For the uninitiated, a buy-write strategy consists of buying the underlying stock or index, and the selling a call option against the long position. That way, the holder trades off potential upside for some immediate cash for income and partial downside protection.)
Don’t expect China to rescue global growth
Notwithstanding the fact that the market is entering a seasonally higher risk period, there are a few other reasons to be cautious on equities.
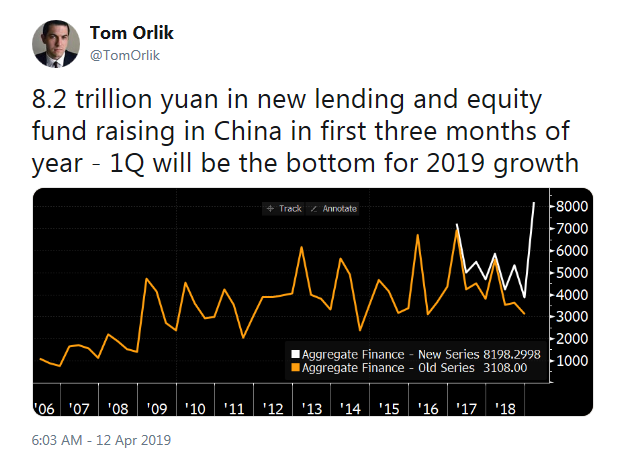
The first reason relates to Chinese stimulus. Should the world expect China to save the world again? It seems that the Chinese authorities reached a Mario Draghi-like “whatever it takes” moment in Q3 or Q4 2018. They abandoned all of their rhetoric about deleveraging and undertook a massive stimulus program. As a result, total social financing (TSF) rose an astounding 8.2 trillion yuan in Q1, which amounts to roughly 9% of GDP (see Can the market advance continue? Watch China!).
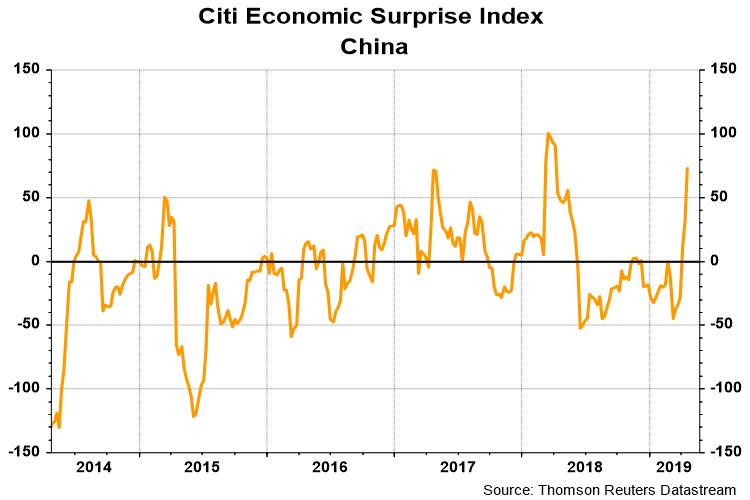
It was therefore no surprise to see a surge in upside surprises in China’s economic statistics.
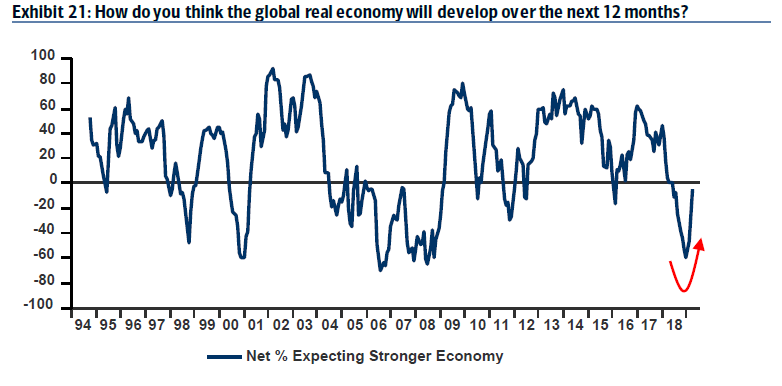
A rising tide lifts all boats, and the effects of the stimulus program was seen globally. The latest BAML Fund Manager Survey saw a turnaround in global growth expectations.
Can this continue? Caixin reported that there has been a shift in rhetoric:
China’s top decision-makers are shifting focus away from more stimulus and back towards structural reform after positive economic performance in the first three months of 2019, say analysts.
Though the domestic economy was still “under downward pressure,” activity in the first quarter of the year was “better than expected,” said a meeting of the 25-member Politburo chaired by President Xi Jinping, according to the official Xinhua News Agency.
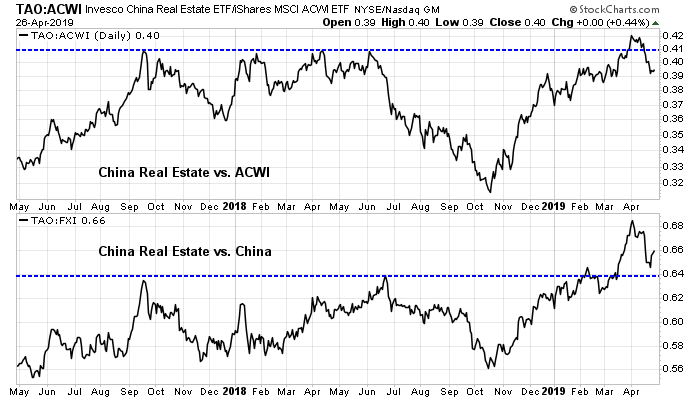
We can see the effects of this shift in policy in real-time. The shares of Chinese real estate companies, which are highly levered and therefore very sensitive to shifts in monetary policy, began to surge in October, and they have now begun to pull back.
To be sure, the stimulus program is not about to come to a dead stop. CNBC reported that Beijing will continue to support the economy, even though more shock-and-awe debt tactics are off the table:
China will implement counter-cyclical adjustments “in a timely and appropriate manner,” while the pro-active fiscal policy will become more forceful and effective, and the prudent monetary policy will be neither too tight nor too loose, it said.
For this year, the government has unveiled tax and fee cuts amounting to 2 trillion yuan ($298.35 billion) to ease burdens on firms, while the central bank has cut banks’ reserve requirement ratios (RRR) five times since early 2018 to spur lending.
Further policy easing is widely expected.
On Friday, the politburo reiterated that the government will effectively support the private economy and the development of small- and medium-sized firms.
Authorities will strike a balance between stabilizing economic growth, promoting reforms, controlling risks and improving people’s livelihoods, the politburo said.
The key question for investors is whether the global cyclical rebound can continue now that China has taken its foot off the stimulus accelerator. The next phase in China’s growth recovery will depend in a large degree on the details and success of the US-China trade talks. While there are hopeful signs that a signing ceremony may be scheduled for late May, the market has gone down this road before and it has been disappointed.
Margin headwinds ahead?
Another threat to equity prices is the prospect of a margin squeeze. Bridgewater Associates recently published a paper detailing the long-term risks to US equity prices from margin compression.
Over the last two decades, US corporate profit margins have surged and have contributed more than half of the excess return of equities relative to cash. Without that consistent expansion of margins, US equities would be 40% lower than they are today. Margins have been rising for 25 years, and when we look at market pricing, it appears to us that the market is extrapolating further margin gains. The long-term valuation of equities hinges heavily on what happens to margins going forward: if margin gains can be extrapolated, then valuations look reasonable; if margins stagnate, then valuations are a bit expensive but not terrible; if margins revert toward historical averages, then equities are highly overvalued.
Over the last few decades, almost every major driver of profit margins has improved. Labor’s bargaining power fell, corporate taxes fell, tariffs fell, globalization increased, technology allowed for greater scale and lower marginal costs, anti-trust enforcement fell, and interest rates fell. These factors have produced the most pro-corporate environment in history. Many of these drivers of high profit margins are now under threat. Before we get to analyzing each, the following panel shows how everything moved in the same direction, in favor of corporates.
Bridgewater believes that the low hanging fruit is gone, and the outlook is less rosy:
Looking ahead, some of the forces that supported margins over the last 20 years are unlikely to provide a continued boost. Incentives for offshore production have been reduced as global labor costs have moved closer to equilibrium, with domestic costs and rising trade conflict increasing the risk of offshoring, while the potential tax rate arbitrage from moving abroad is now much smaller…
At the same time, we have seen popular sentiment begin to sour against the forces that have driven margin expansion, as well as against the companies that have benefited most from them. As we have discussed at length in prior research papers, we are in the midst of a populist backlash against rising inequality and increasingly seeing a move toward more protectionism. Recent surveys show increasing animosity toward globalization and the power of companies more broadly and a bit more welcoming attitudes toward government regulation of firms.
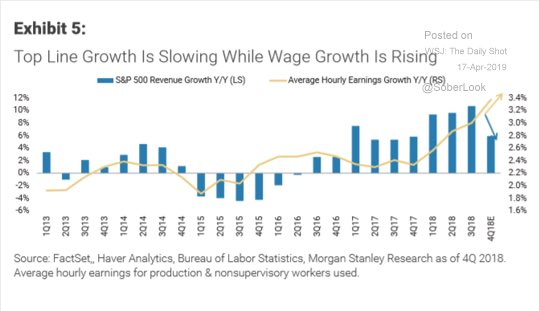
While Bridgewater’s concerns are long-term in nature, cyclical pressures are starting to appear. Morgan Stanley pointed out that sales growth is slowing, while wage growth is rising. This will start to put pressure on operating margins, and earnings growth expectations.
Bullish momentum supportive of further gains
The bull case rests mainly on a combination of fundamental and price momentum. Can momentum be stopped?
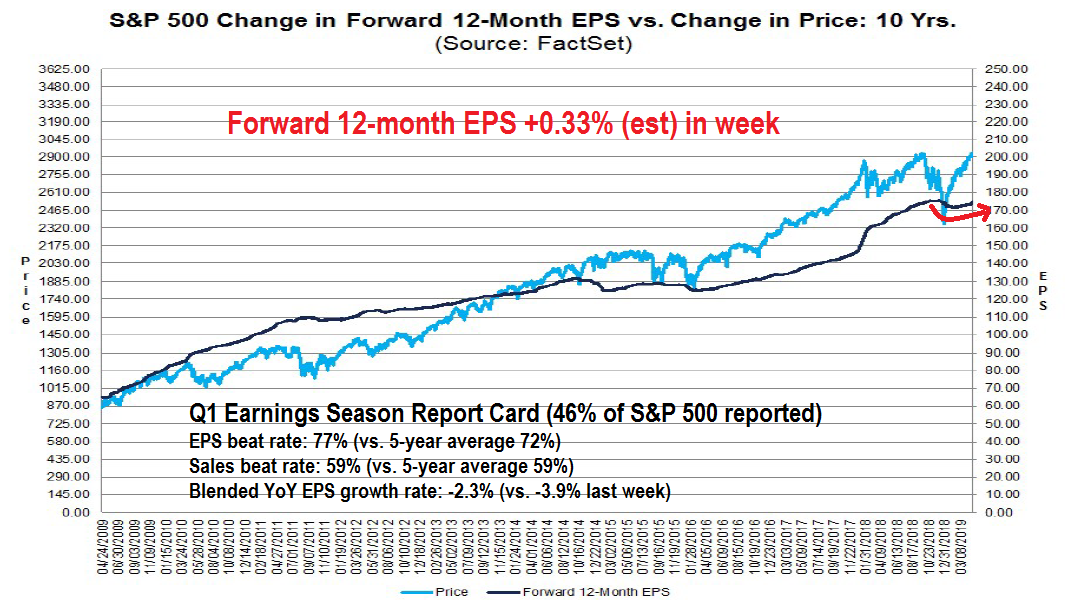
Consider the interim results of Q1 earnings season as a measure of fundamental momentum. The earnings beat rates have been coming in above their historical averages, and forward 12-month EPS estimates have troughed and they are rising again. Can this optimism, once began, be stopped dead in its tracks?
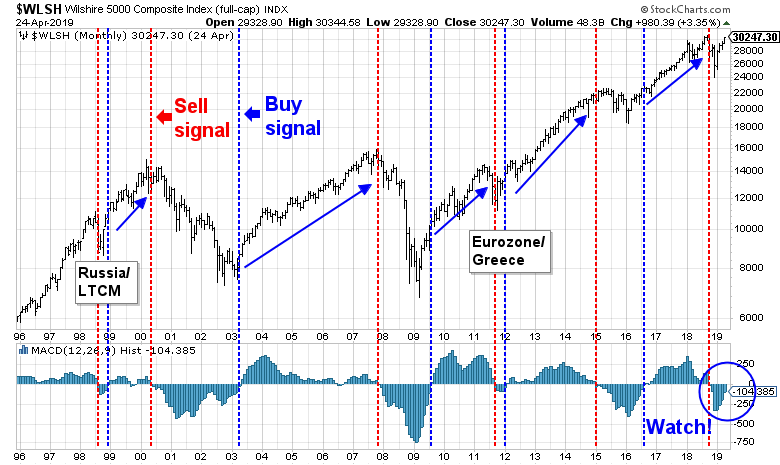
From a technical perspective, US equities, as measured by the broad Wilshire 5000, are on the verge of a bullish MACD crossover buy signal in the next month or two. Past buy signals have led to strong gains in the past, and the subsequent bull phase has lasted at least a year. While I am not in the habit of anticipating model readings, the market would have to really crash to avoid the buy signal. The current bearish episode that ended on December 24, 2018 is reminiscent of two instances when central bankers stepped in to rescue the market. In 1998, the Fed halted the panic resulting from the Russia default and subsequent LTCM crisis; in 2011, the ECB backstopped the eurozone banking system with its LTRO program. In both instances, stock prices recovered and went on to new highs.
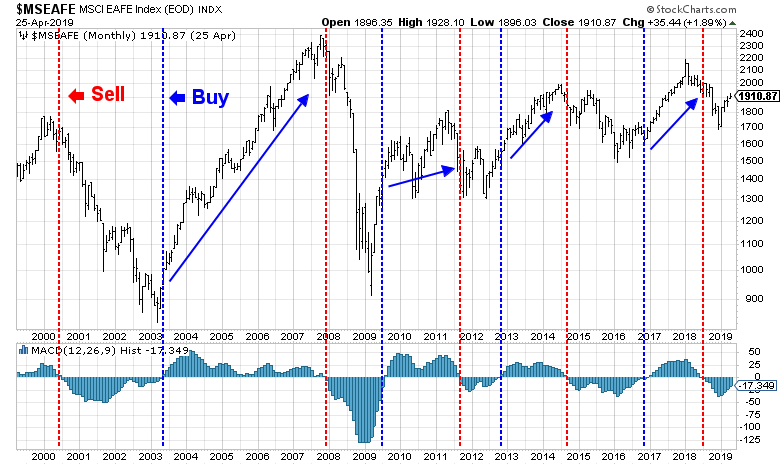
Non-US developed market equities, as measured by the MSCI EAFE Index, is also on the verge of a MACD buy signal.
The MSCI Emerging Market Free Index is also nearing a similar buy signal, though past buy signals have not been as effective for EM equities.

Putting it all together, the technical picture of global equities is showing a similar bullish potential. Can this momentum be stopped?
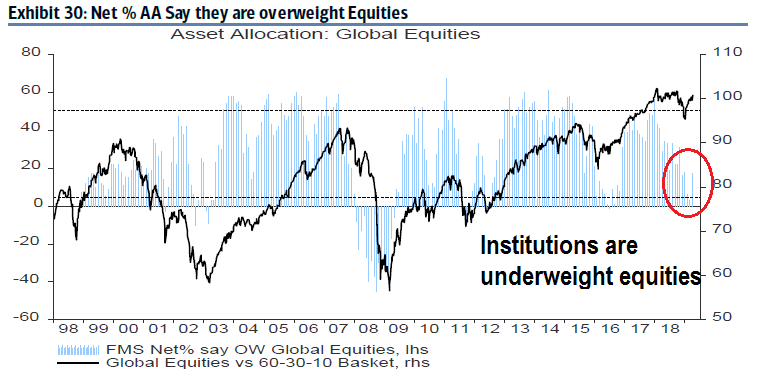
The price momentum effect can partly be explained by a stampede into equities by market participants. The latest BAML Global Fund Manager Survey shows that global institutions had de-risked ahead of the late 2018 market sell-off, and they are now scrambling to add risk as the economic outlook normalized.
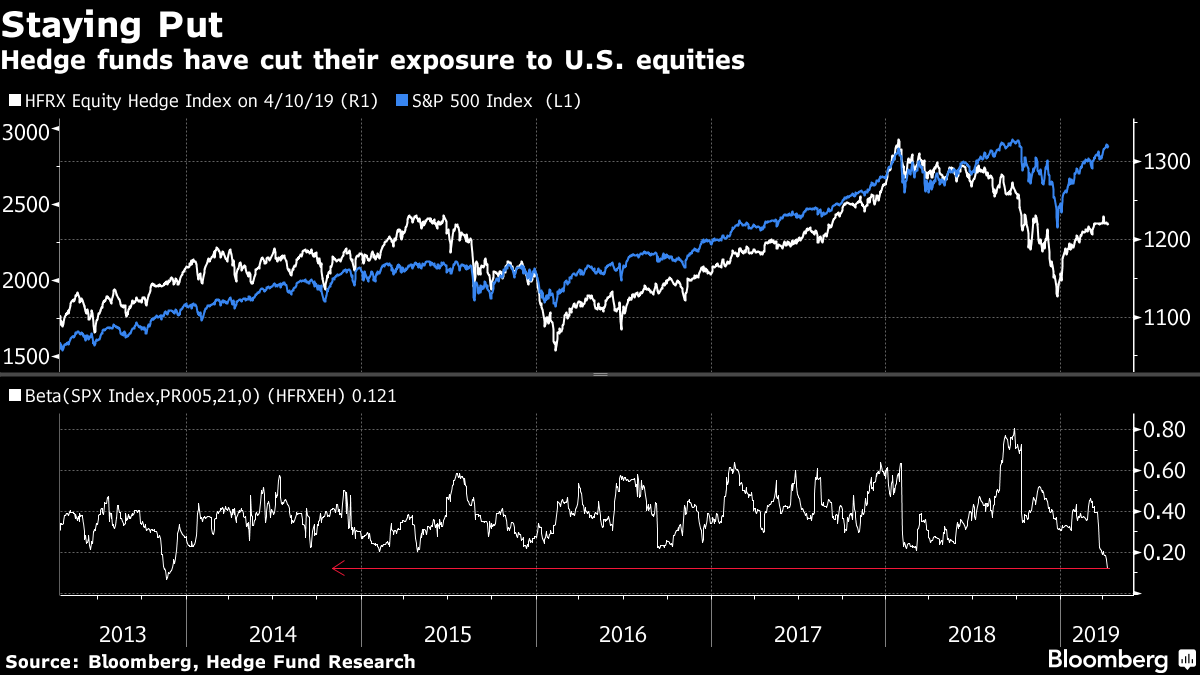
Bloomberg also reported that hedge funds are short beta. How long can these short-term return sensitive players resist the siren of price momentum?
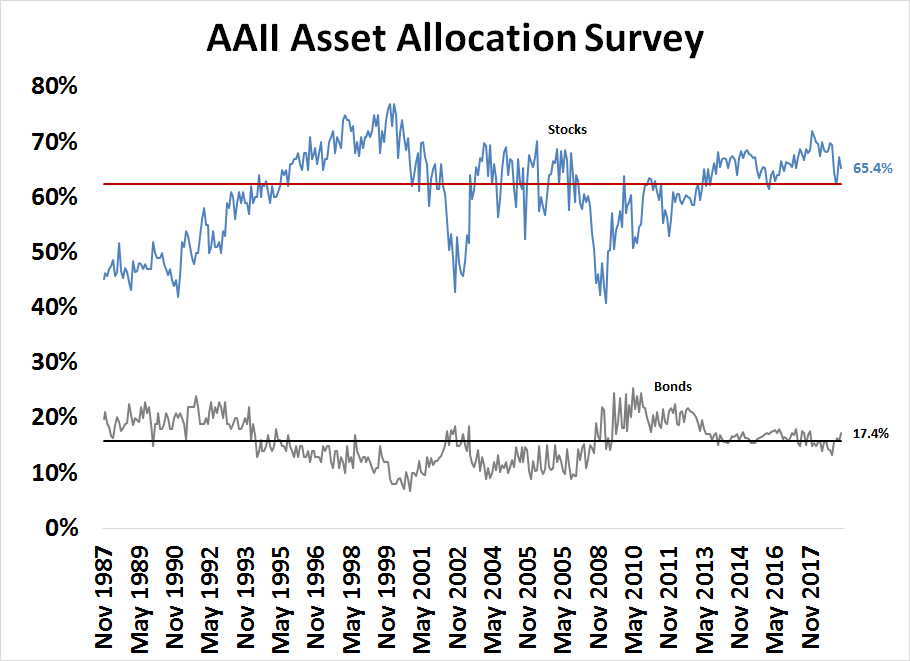
Individual investor sentiment readings are mixed. Long-term investors, as measured by the monthly AAII asset allocation survey, are roughly neutral in their risk appetite. Both equity and bond allocations are slightly above median, but readings are not excessive.
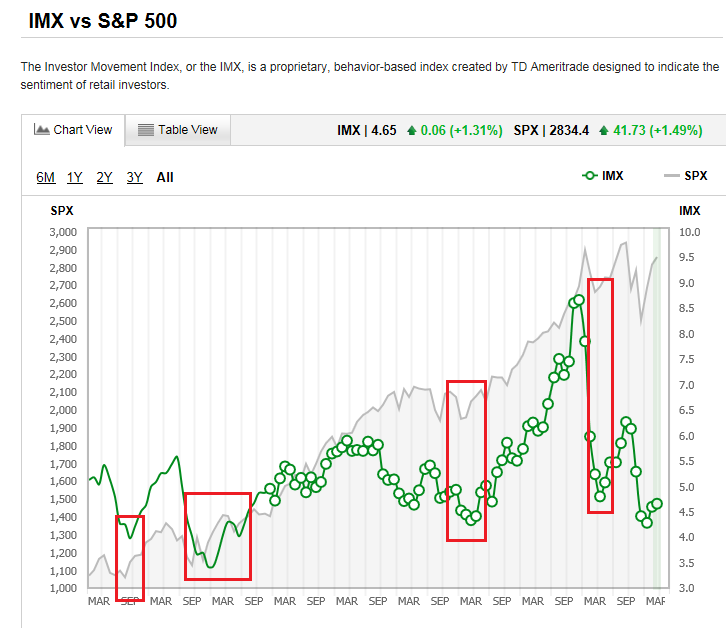
The TD-Ameritrade Investor Movement Index, which measures what TD-Ameritrade clients are doing with their money, shows a defensive tilt that is more consistent with market bottoms, not market tops.
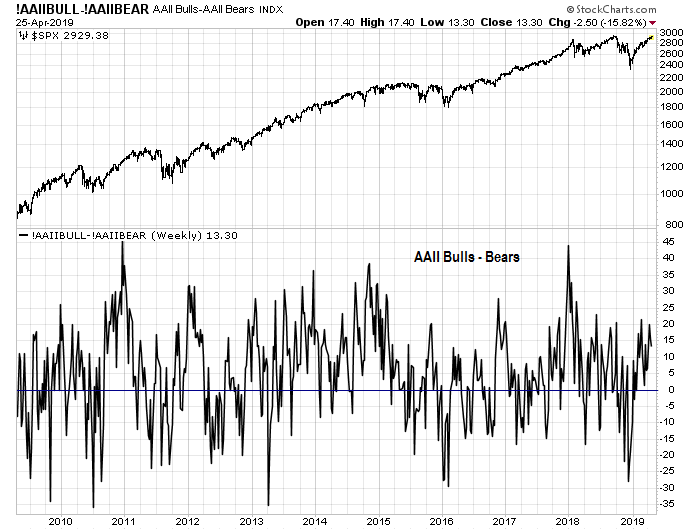
The weekly AAII sentiment survey, which consists of a greater sample of traders, shows a bull-bear spread of 13%, but readings are not excessive.
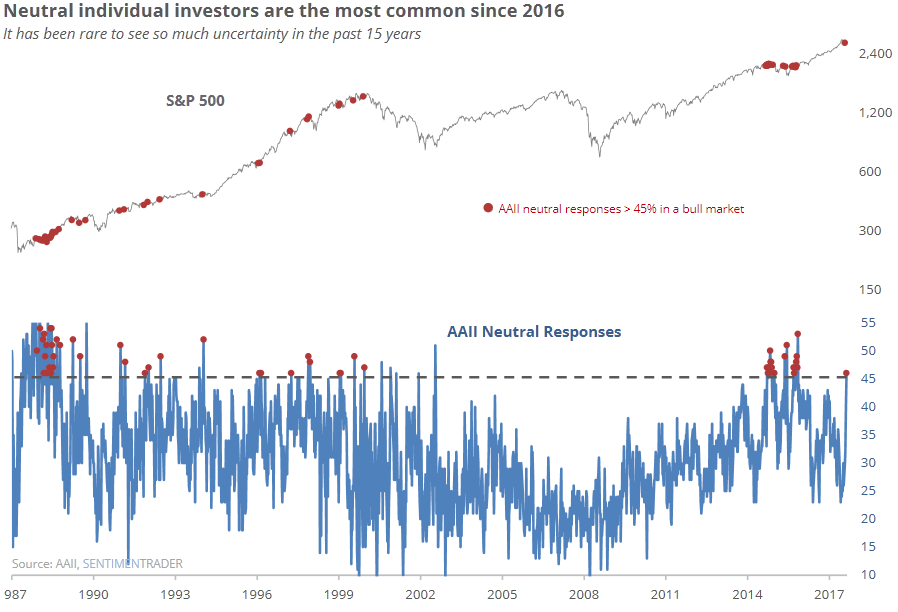
What is unusual about the AAII sentiment survey is the spike in neutral opinions to 46.3%, which is an indication of confusion and uncertainty. Such readings are relatively rare, and they have tended to be either neutral or bullish for stock prices.
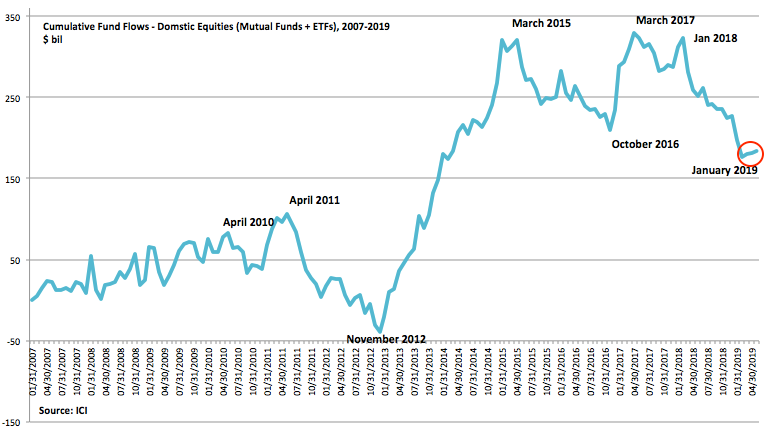
To be sure, there have been positive flows into equity funds in the past few weeks, but a longer term time scale shows that the magnitude of the flows is only a blip compared to its history.
In general, the Street can be described as underweight risk and short equity beta. These conditions suggest that as long as macro and fundamental momentum are lasting, the bullish stampede can continue.
The Powell and Xi puts
Another bullish consideration are the Fed’s dovish turn, and the implicit Xi Put from China.
The Federal Reserve made a dovish pivot in Q1 and changed to a “patient” stance on monetary policy. Fed watcher Tim Duy outlined the internal discussions about the Fed’s prolonged inability to hit its 2% inflation target:
The failure of the Fed to meet its self-defined inflation objective yields a number of both short- and long-term negative outcomes. At a most basic level, the continuing suboptimal inflation outcomes suggest policy has been too tight throughout the expansion that followed the Great Recession. Unemployment could have been reduced more quickly and could possibly still be held sustainably lower than current Federal Reserve forecasts anticipate. Another concern is that persistently low inflation is eroding inflation expectations which, though little understood (see Tarullo (2017)), anchor the Fed’s inflation forecast. The Fed would need to provide even easier policy should they want to firm up those expectations.
Over the longer-run, policy makers increasingly focus on how they should respond to the next recession. In addition to lower interest rates, quantitative easing, and forward guidance, Fed speakers also increasingly anticipate tweaking the policy framework to make up past inflation shortfalls. A version of such a policy is the temporary price-level targeting scheme suggested by former Federal Reserve Chairman Ben Bernanke.
As a reminder, here is how Ben Bernanke explained his temporary price-level targeting proposal:
In a previous blog post and paper, I proposed one variation of this kind of commitment, called “temporary price-level targeting” (TPLT). In brief, under TPLT, following adverse shocks to the economy that force short-term rates to zero, the Fed would commit in advance to avoid raising rates at least until any shortfalls of inflation from target during the ZLB period had been fully offset. So for example, if the Fed has a 2 percent inflation target in normal times, under TPLT it would commit not to begin raising rates from zero until average inflation since the beginning of the ZLB period was at least 2 percent. (Once rates have lifted from zero, policy is guided by a conventional rule such as a Taylor rule.) Since inflation early in the ZLB period would likely be below 2 percent, meeting this condition would typically involve some overshoot of the inflation target before rates were raised. Some willingness to accept temporary overshoots of the inflation target is typical of lower-for-longer strategies.
Duy concluded that it all adds up to a dovish direction on monetary policy:
Taken together, the above suggests a high likelihood that policy will at least err on the dovish side. In reality, I think the Fed should not just err on the dovish side, but should instead pursue an explicitly dovish strategy. Arguably it would be foolish if not downright irresponsible to enter the next recession without at least convincingly anchoring inflation expectations at 2%; an effort to do so might entail not just accepting above 2% inflation ahead of the next recession, but actually targeting a higher level to ensure that average inflation prior to the next recession is 2%.
A WSJ article discussed the inflation undershoot problem, and revealed that Chicago Fed President Charlie Evans actually proposed an “insurance rate cut”:
If inflation runs too far below 2% for a while, it would show “our setting of monetary policy is actually restrictive, and we need to make an adjustment down in the funds rate,” Chicago Fed President Charles Evans said Monday, referring to the central bank’s benchmark federal-funds rate.
Mr. Evans said his forecast was for inflation to rise over the coming year, justifying a rate increase in late 2020 and possibly again in 2021 to keep price pressures under control.
But if it turns out that core inflation, which excludes volatile food and energy categories, falls and stays near 1.5% for several months, “I would be extremely nervous about that, and I would definitely be thinking about taking out insurance in that regard” by cutting rates, he said.
At a minimum, the Fed has investors’ back for the rest of the year. Don’t be afraid to take risk.
As for China, one of the reasons behind the Draghi-like “whatever it takes moment” last year was undoubtedly in anticipation of the October celebration of the 70th anniversary of the founding of the Peoples’ Republic of China. The Chinese leadership from Xi Jinping down would pull out all stops to avoid a tanking economy just as the anniversary begins. Despite all of the rhetoric about a policy shift to a more measured and targeted stimulus program, Beijing is likely to resort to more debt driven stimulus should growth falter.
Don’t worry, world. Xi has your back, at least until Q4. Then all bets are off.
What I am watching
Bull or Bear? Here is what I am watching to resolve the debate.
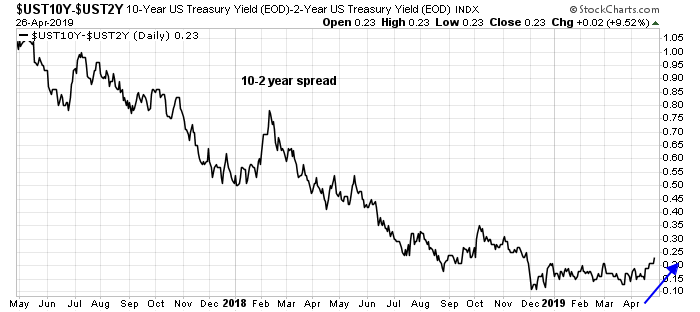
Let’s begin with the yield curve. The 2s10s yield curve has been steepening, which is a signal from the bond market that it is anticipating better growth. Can that continue?
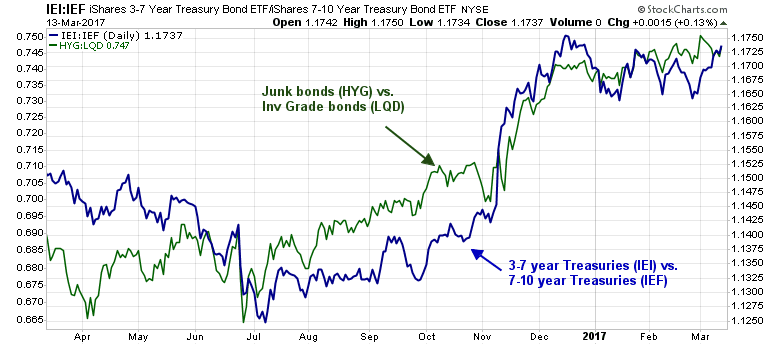
If the market were to take a tumble, financial distress risk is likely to rise. So far, the relative performance of credit has roughly tracked stock prices.
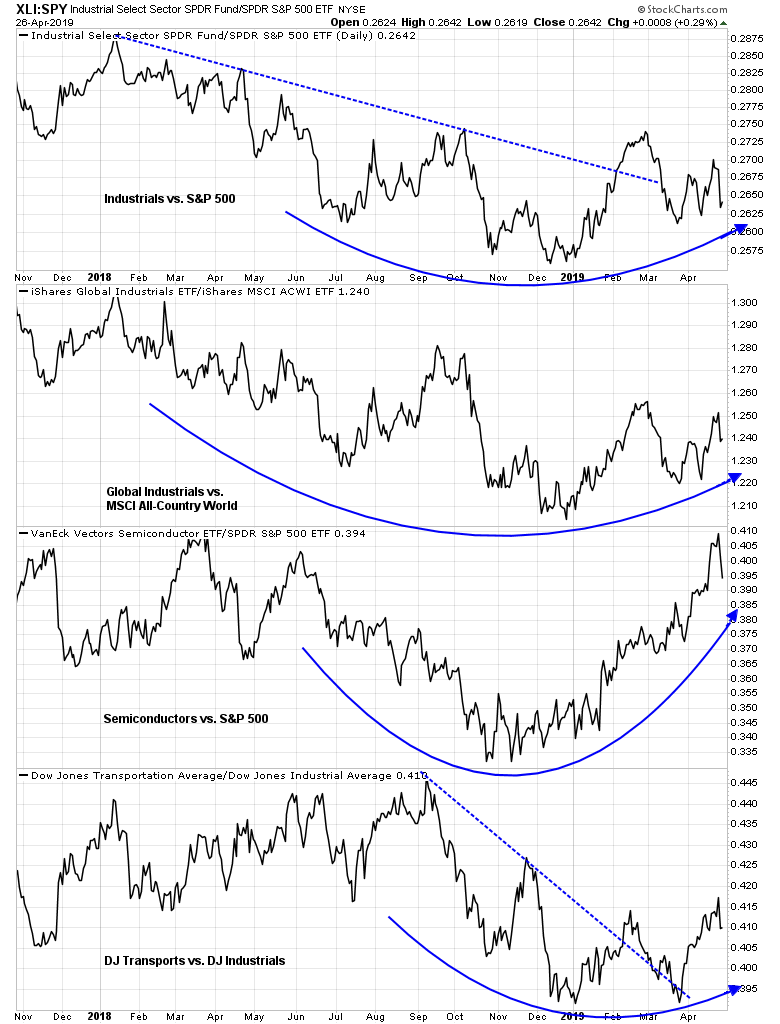
Last week, the market seems to have hit the pause button on the relative performance of cyclical stocks. The disappointing earnings reports from cyclical companies like 3M, FedEx, and UPS have hurt these stocks. Watch if their relative performance recovers, or lags.
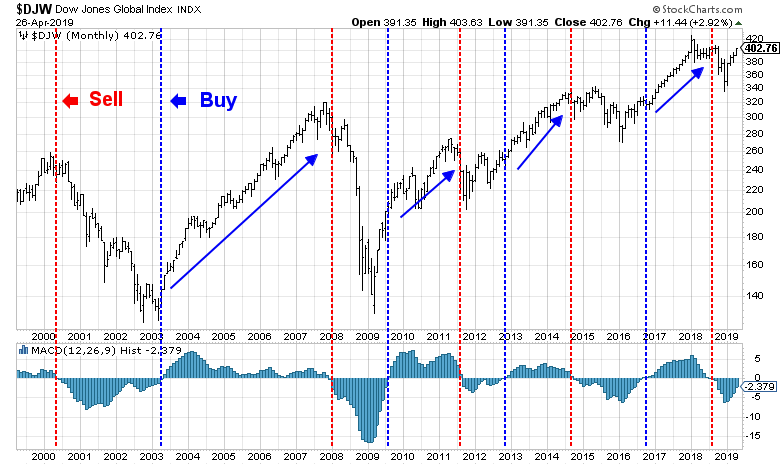
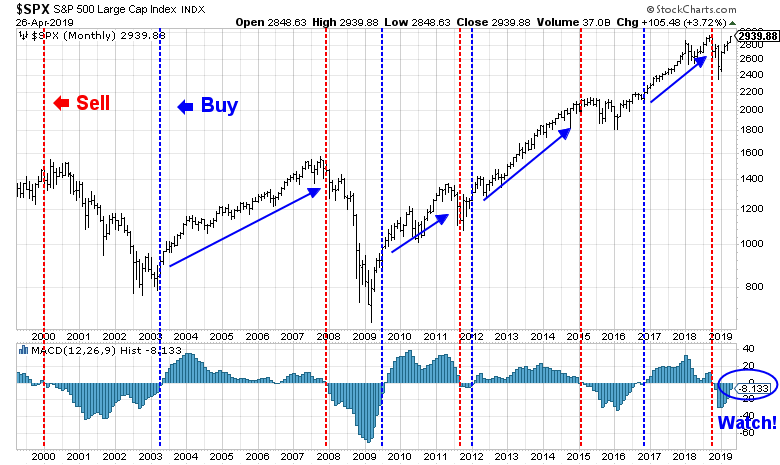
Lastly, monitor the progress of major market indices like the S&P 500. Will it flash a MACD buy signal on the monthly chart?
Even if the market were to falter, don’t panic. Jeff Hirsch at Almanac Trader pointed out that it is not unusual for the market to pause and consolidate its gains in May in a pre-election year.
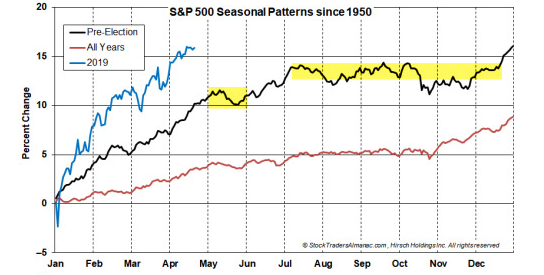
In conclusion, while the combination of weak seasonality, fading stimulus from China, and a possible margin squeeze could prove to be headwinds for stock prices, strong momentum, and the presence of both a Fed Put and Xi Put are positives for risk appetite. Given the current conditions, I am inclined to give the bull case the benefit of the doubt, though investors should be prepared for minor pullbacks.
The week ahead
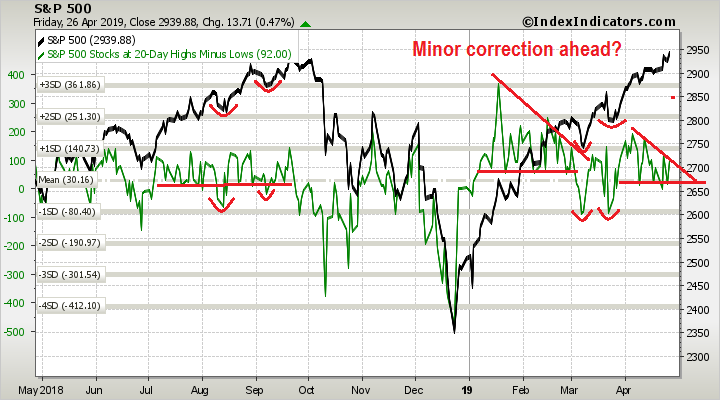
Looking to the week ahead, the market may be poised for a minor pullback. The S&P 500 has been staging a “good overbought” advance, as it becomes overbought on short-term 5-day RSI, while pausing when the 14-day RSI gets overbought. Past pullbacks during such advances have been halted when RSI-14 at or near neutral, and when the VIX Index breaches its upper Bollinger Band. As the index has become overbought on RSI-14, and it is testing a rising trend line that has proven to be upper limit for its rally for 2019, it may be time for another pause and pullback. Should history repeat itself, the corrective episode should not be very serious, with downside risk limited to about 2%, which is about the level of the 50 day moving average at about 2850-2860.

The analysis of intermediate-term breadth, as measured by the net 20-day highs-lows, reveals a similar pattern. Advancing phases has seen breadth declines halt at support, but past minor corrections were marked by only minor breaches of support and quick bounce backs. Current conditions are setting up for another one of these pullbacks, as breadth has been trending down with a series of lower highs.
Option sentiment is also ripe for market weakness. The CBOE equity-only put/call ratio has been falling to levels that has historically signaled complacency. That said, this indicator has not flashed immediate actionable sell signals in the past. Instead, it has only warned of sentiment conditions where the market has either stalled or pulled back.

The FOMC meeting in the coming week is also a source of event risk. The market is discounting a quarter-point rate cut by December, according to the CME’s Fedwatch Tool.

At the same time, evidence of strong Q1 GDP growth and a global reflationary rebound might give Fed policymakers some pause. If the Fed wanted to lean against the expectations of a rate cut by downgrading downside risks and upgrading growth and inflation, the FOMC statement may be the perfect venue for such a statement. Stay tuned.

That said, overbought markets can become more overbought, and the market can continue to despite overbought conditions. However, such a scenario would call for a unsustainable parabolic blow-off which ultimately resolves itself with a collapse.
Instead, my base case scenario would see the S&P 500 consolidate and pullback by 2% or less within the next two weeks, and the rally to resume soon afterwards. Should stock prices weaken from these levels, I would discount the possibility of a deeper correction as those signs of weakness are not present.
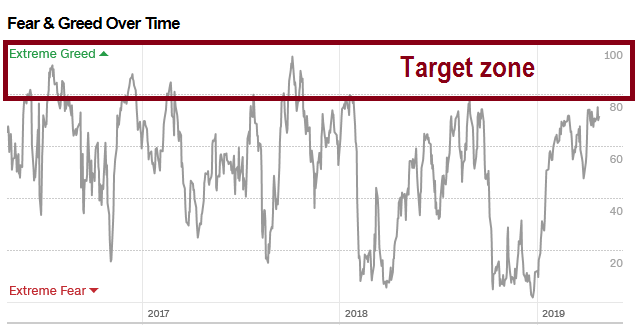
Simply put, the market is insufficiently overbought and insufficiently frothy for this to be an intermediate term top. The Fear and Greed Index stands at 72, and it has not reached my target level of 80, which would be the minimum level for a minor top.
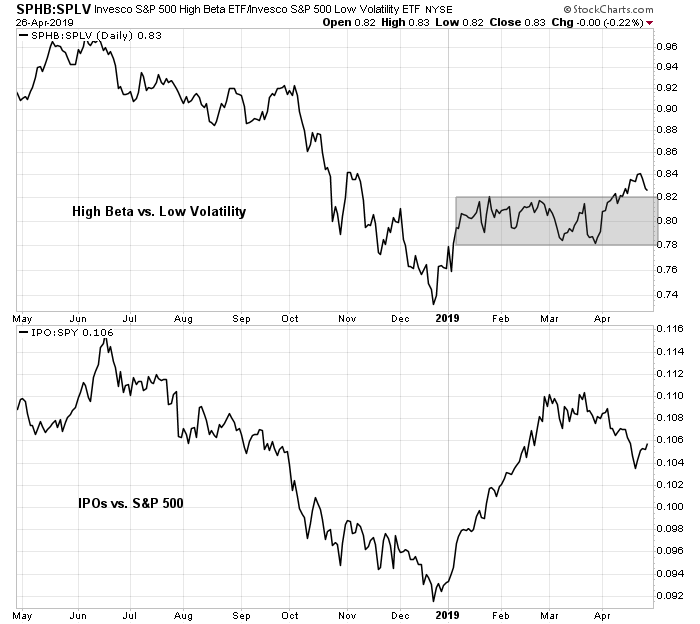
Other risk appetite indicators are nowhere near the frothy levels that warn of a top. High beta stocks have barely begun to beat low volatility stocks, and IPOs are underperforming the market. Sentiment does not look like this at market tops.
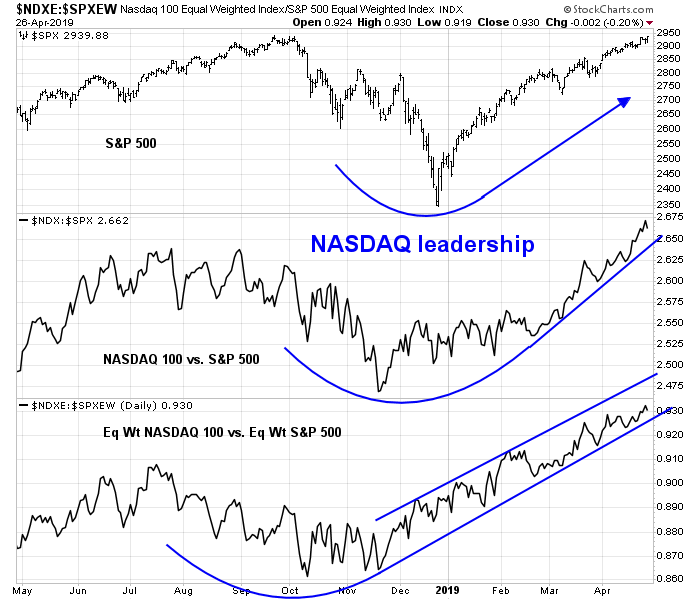
In addition, there are no signs of a change in leadership. NASDAQ stocks have been the market leaders even before the Christmas Eve bottom. The relative performance of the NASDAQ 100 (middle panel) has been dramatically outperforming since mid-February. This relationship is even more clear in the bottom panel, which shows the Equal Weighted NASDAQ 100 to Equal Weighted S&P 500. NASDAQ ratio rising in a well-defined channel. It is difficult to believe that stock prices would falter and top out without signs of a technical breakdown in NASDAQ stocks.
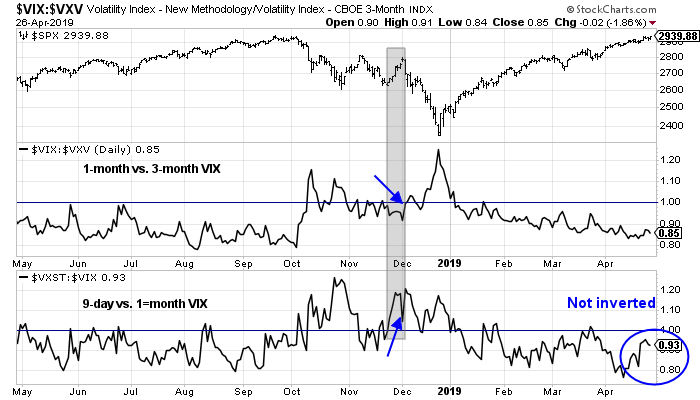
There have also not been any warnings from the option market. The 9-day to one-month VIX term structure (bottom panel) has been a sensitive barometer of market uneasiness compared to the more conventional 1-month to 3-month VIX ratio (middle panel) that is a measure of VIX term structure. We saw a negative divergence warning in December when the short-term term structure inverted sharply, while the longer term term structure flattened. There is no similar divergence today.
My inner investor is bullishly positioned and overweight equities. My inner trader is also bullish, but he is keeping some dry powder ready. Should the market weaken, he will see that as an opportunity to add to his long positions.
Disclosure: Long SPXL
As a proponent of momentum-style investing and believer that it is driven by behavioral economics, I’m sometimes asked to recommend a book about it. Here is a video presentation by an author of ‘The Behavioral Investor.’ It’s better than a book.
https://blogs.cfainstitute.org/investor/2019/04/25/four-behavioral-biases-and-how-to-fight-them/
Ken, Thanks for the link. It was a good talk. Do you also like books by Crosby?
Great Post !