You may think that institutional money managers run in herds, but that is not necessarily true. Different managers have different mandates that color their views. As well, their geographical base can also create differences in opinions in how their view their world and markets. I analyze institutional sentiment by segmenting them into four distinct groups, each with their own data sources:
- US institutions, whose sentiment can be measured by Barron’s semi-annual Big Money Poll
- Foreign and global institutions, as measured by the BAML Fund Manager Survey (FMS), which is conducted on a monthly basis;
- RIAs, as measured by the NAAIM survey, conducted weekly; and
- Hedge funds, as measured by option data and the CFTC futures Commitment of Traders data, though hedge funds are partly represented in the BAML FMS sample, and other sources.
While “institutions” do not always agree, current conditions are pointing an unusual consensus of opinion, and traders can profit by front running the institutional stampede.
An unusual agreement
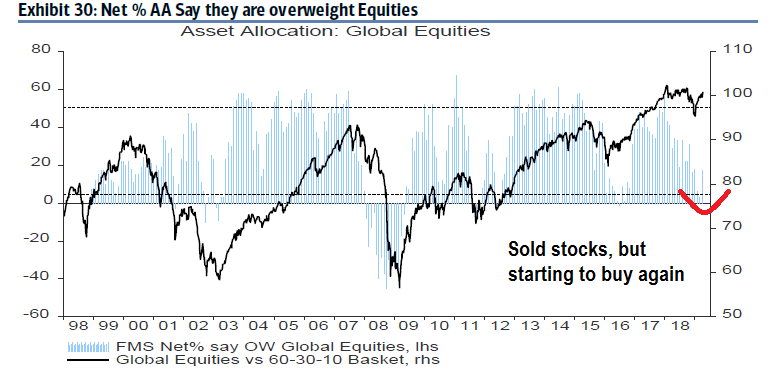
Barron’s just published their semi-annual Big Money poll, and a comparison of the Barron’s poll with the BAML Fund Manager Survey (FMS) reveals a group of managers who de-risked their portfolios in conjunction with the stock market weakness in late 2018, but they are starting to buy again.
One of the weaknesses of the Barron`s poll is it only asks managers views of the market, but it does not ask how they are positioned. The BAML FMS does ask about manager positioning, and it shows that their equity positions are low compared to their historical average, but they are just beginning to buy again.
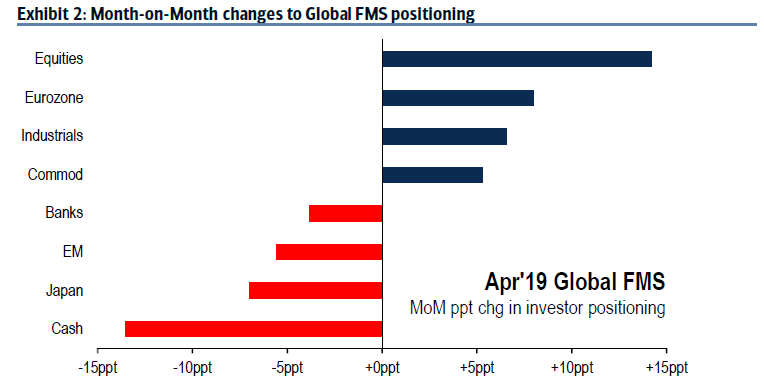
We can see this in the biggest changes in monthly positions, where equities went up the most, and cash levels fell the most.
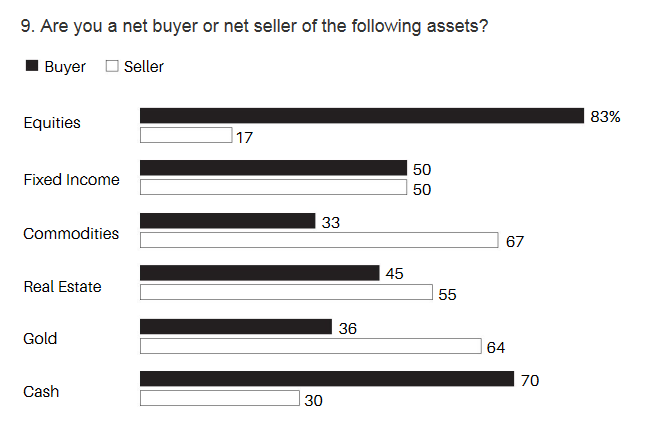
This was in slight contrast to the Barron’s poll, which indicated that US managers plan on raising both equity and cash levels, at the expense of their commodity exposure.
A history of over and under valuation from Barron’s shows that manager bullishness peaked in H2 2016, while neutral opinions rose. US manager bullishness is not extreme.
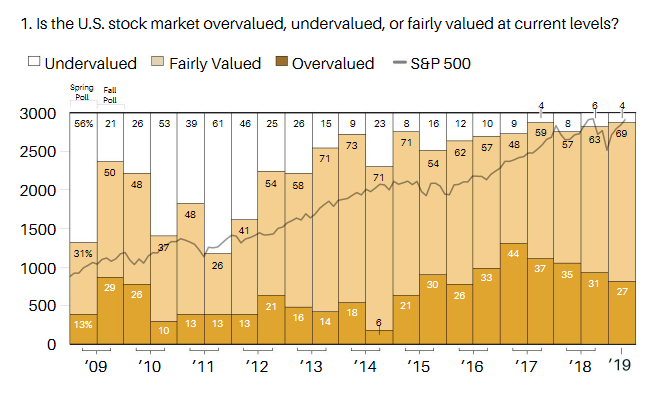
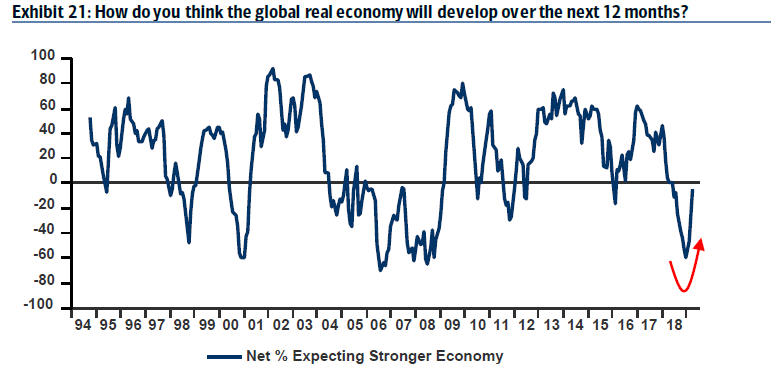
At the same time, growth expectations are bottoming. The combination of a manager short beta position and a growth turnaround is likely to spark a bullish stampede, which is just starting.
Sector preferences are also similar. The BAML FMS of global managers favor Technology and Healthcare (pharma), while avoiding Materials and Utilities.

The Barron’s US sample shows a similar view, of Technology, Healthcare, and FAANG flavored sectors like Communications Services (FB, GOOG, GOOGL) and Consumer Discretionary (AMZN), while Materials and Utilities are out of favor.

In short, both US and global managers are buying equities, and their portfolios are tilted towards high beta sectors.
RIAs are already bullish
I have seen a number of analysts refer to the NAAIM Exposure Index as representative of institutional activity. This is a misunderstanding. NAAIM stands for National Association of Active Investor Managers consisting mainly of RIAs.
For some perspective, the assets under management (AUM) of a seasoned RIA might be around $100 million. A successful team of several RIAs might be around $1 billion. By contrast, a typical institutional manager’s AUM would range from $10 billion to over $100 billion.
Another shortcoming of the NAAIM Exposure Index, which is taken weekly, is it asks the views of its members, rather than their positioning. Opinions can swing much more wildly than portfolio positions. An investor who entrusted his funds with a manager who moved the portfolio beta as quickly as the NAAIM Exposure Index pictured below would see turnover over 500% a year, and it would raise red flags and risk that manager getting fired for churning the portfolio.
Instead, I have found that NAAIM Exposure Index to be useful at extremes. In particular, it has flashed good contrarian buy signals when the index has fallen below its 26-week Bollinger Band (grey shaded regions), though readings above the upper BB (yellow shaded regions) have not been as effective as sell signals.

Current readings indicate that RIAs have turned bullish, and they are buying, just like the large institutions.
Hedge funds still cautious
Traders also spend a lot of time trying to discern hedge fund activity. While hedge fund assets are lower than large institutions, their turnover rate can be an order of magnitude higher, and their activity can dramatically affect tape action.
At this point, it is important to understand how hedge funds work. Large multi-strategy hedge funds like a D.E. Shaw or a Renaissance with billions in assets is really a portfolio of traders and managers each running their own strategies. Even though there are a lot of smart people under the same roof, there is little or no incentive for cooperation or collaboration. They all compete against each other for capital, and therefore they are highly secretive about their approaches and portfolios. The only thing you might only know that the team in the next desk or office trades currencies, and that would be the only extent of your knowledge.
In addition, different strategies will have different tilts, and a long position is usually offset by a short position (hence the “hedge” fund label). Some of the more well-known categories that trade equities are global macro funds, long/short funds, equity market neutral, CTA trend following strategies, and convertible arbitrage. The list goes on, and there is no monolithic “hedge fund” position.
Nevertheless, Jason Goepfert at SentimenTrader recently highlighted an unusual condition. In aggregate, hedge fund equity betas are at historic lows. As these strategies tend to be drawdown sensitive, continued equity strength will force HF traders to cover and increase their beta.

I wrote yesterday (see Sell in May? The bull and bear debate) that NASDAQ stocks have been the leadership throughout this rally. Leadership is even more evident when you look at the equal weighted ratios (bottom panel). Moreover, NASDAQ stocks turned up even before the broad market turn. A meaningful correction is therefore unlikely until this group shows significant signs of relative weakness.

The analysis of the CoT data from Hedgopia reveals that large speculators, which are mostly hedge funds, are still short the NASDAQ 100. This sets up a situation for an explosive upside should these traders capitulate and go long.

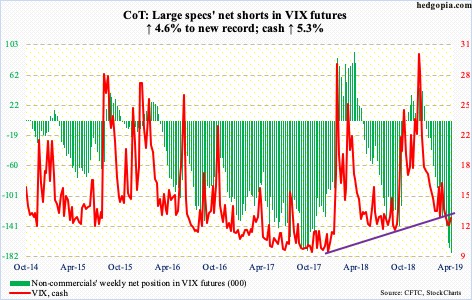
To be sure, hedge funds may have already expressed their equity bullishness in other ways. There has been growing concern about the record crowded short in VIX futures. Some analysts have interpreted these readings as a potential VIXmageddon, where volatility explodes and stock prices fall. From a cross-asset analytical viewpoint, the VIX short may be another way that traders are positioned for rising equities.
Orderly advance, or blow-off top?
From a tactical perspective, the stock market has been staging an orderly advance, while respecting the rising trend line pictured in the chart below. My base case scenario calls for a continuation of this pattern, which consists of a rally, followed by market consolidates and minor corrections, and then further strength. On the other hand, should the index stage an upside breakout through the rising trend line, it would be the signal for a blow-off top, much like the one we saw in late 2017 and early 2018.

In addition, a decisive upside breakout by the small cap Russell 2000 might provide another reason for a risk-on stampede.

Stay tuned.
Disclosure: Long SPXL
Nautilus Research just tweeted an interesting study that shows that when Russell 2000 trades at New 6-month highs for first time in 6-months, the $RUT tends to outperform the $SPX for the next several months. Here’s the link to the tweet: https://twitter.com/NautilusCap/status/1123200892507914246. So maybe a $SPX blow off top will trigger the rotation into less frothy parts of the market.