Preface: Explaining our market timing models
We maintain several market timing models, each with differing time horizons. The “Ultimate Market Timing Model” is a long-term market timing model based on the research outlined in our post, Building the ultimate market timing model. This model tends to generate only a handful of signals each decade.
The Trend Model is an asset allocation model which applies trend following principles based on the inputs of global stock and commodity price. This model has a shorter time horizon and tends to turn over about 4-6 times a year. In essence, it seeks to answer the question, “Is the trend in the global economy expansion (bullish) or contraction (bearish)?”
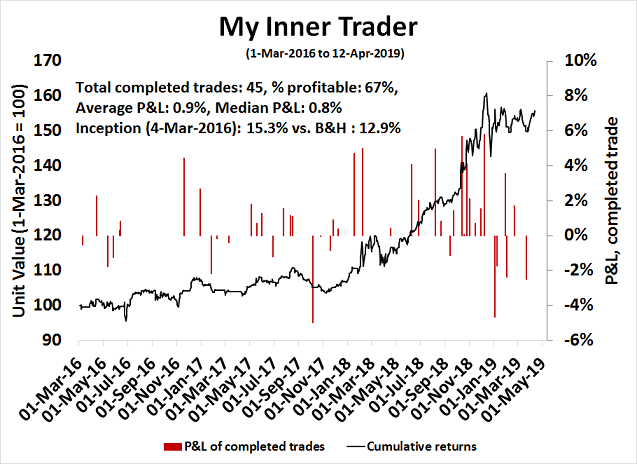
My inner trader uses a trading model, which is a blend of price momentum (is the Trend Model becoming more bullish, or bearish?) and overbought/oversold extremes (don’t buy if the trend is overbought, and vice versa). Subscribers receive real-time alerts of model changes, and a hypothetical trading record of the those email alerts are updated weekly here. The hypothetical trading record of the trading model of the real-time alerts that began in March 2016 is shown below.
The latest signals of each model are as follows:
- Ultimate market timing model: Buy equities
- Trend Model signal: Bullish
- Trading model: Bullish
Update schedule: I generally update model readings on my site on weekends and tweet mid-week observations at @humblestudent. Subscribers receive real-time alerts of trading model changes, and a hypothetical trading record of the those email alerts is shown here.
What are the limits to “patience”?
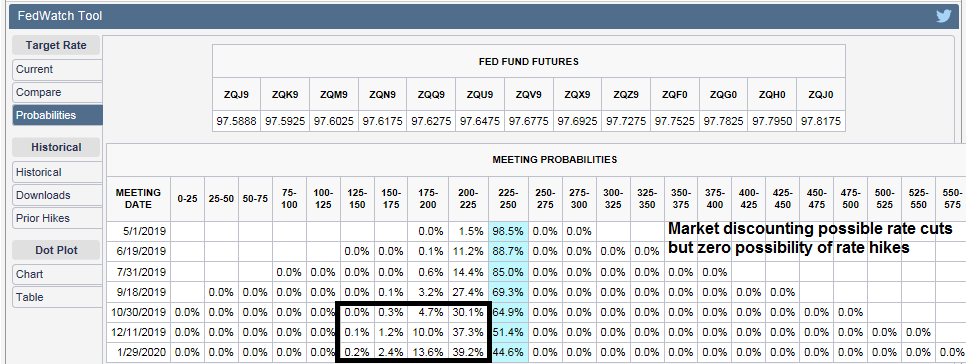
The credit market may be setting up for an unpleasant surprise. According to the CME’s Fedwatch Tool, the market mainly expects no change in the Fed Funds rate for the rest of this year, with the possibility of a cut later in the year. It is not expecting a rate hike. Politico reported that Trump’s economic advisor Larry Kudlow went even further: “I don’t think rates will rise in the foreseeable future, maybe never again in my lifetime.”
The minutes of the March FOMC meeting tells a different story. Since the Fed made the U-turn and adopted the policy of “patience”, the Committee is not expecting any changes in rates for the rest of 2019:
A majority of participants expected that the evolution of the economic outlook and risks to the outlook would likely warrant leaving the target range unchanged for the remainder of the year.
However, some members would not rule out another increase in interest rates this year. The strength in the labor market could raise economic growth in the months ahead, though not as rapidly as last year.
Underlying economic fundamentals continued to support sustained expansion, and most participants indicated that they did not expect the recent weakness in spending to persist beyond the first quarter. Nevertheless, participants generally expected the growth rate of real GDP this year to step down from the pace seen over 2018 to a rate at or modestly above their estimates of longer-run growth.
There was also some uneasiness over the use of the word “patient” as it could be viewed as handcuffing future actions if the time came to raise rates:
Several participants observed that the characterization of the Committee’s approach to monetary policy as “patient” would need to be reviewed regularly as the economic outlook and uncertainties surrounding the outlook evolve. A couple of participants noted that the “patient” characterization should not be seen as limiting the Committee’s options for making policy adjustments when they are deemed appropriate.
Who is right? The market or the Fed? If the bond yields start to rise, what does that mean for stock prices?
Mixed signals from the labor market
Let’s start with an analysis of the labor market, as that is one of the Fed’s key indicators of the economy. Some concerns were raised by the release of the JOLTS report last week, as the headline job openings figure plunged.
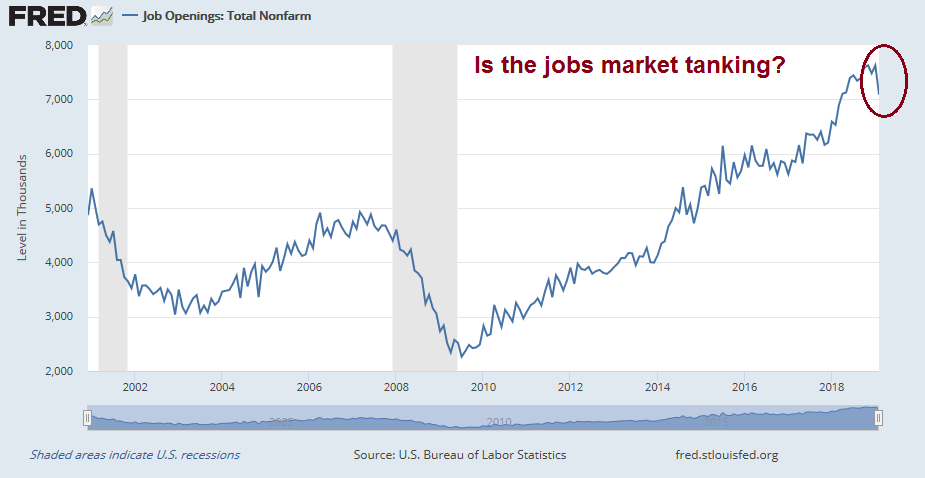
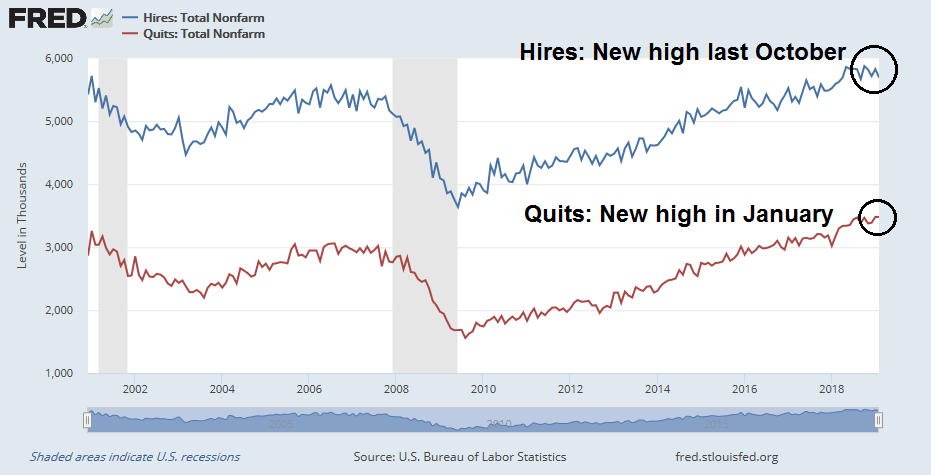
I tend to discount the job openings number as noisy and unreliable because employers have advertised job openings when there are no jobs available in order to troll for resumes. The actual hires and quits figures from the same JOLTS report did not show a rapidly deteriorating job market. Hires made a new cycle high last October, and quits made a new high in January. Neither have fallen as dramatically as job openings. Does this look like the picture of a labor market falling off a cliff?
To be sure, there are some signs of wobbles in the labor market. Historically, temporary jobs (blue line) have led the headline Non-Farm Payroll figure (black line) by several months, and the March Jobs Report shows that temp job growth is stalling. However, a BLS study found a similar leading/lag relationship between the quits to layoffs ratio (red line) and NFP. The latest JOLTS report shows is not confirming the weakness in temp jobs. There is no need to panic, but we will have to keep an eye on these indicators.
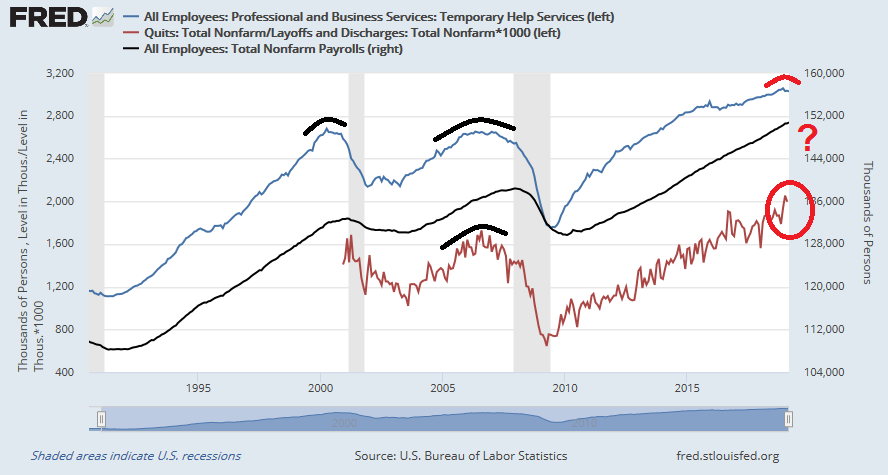
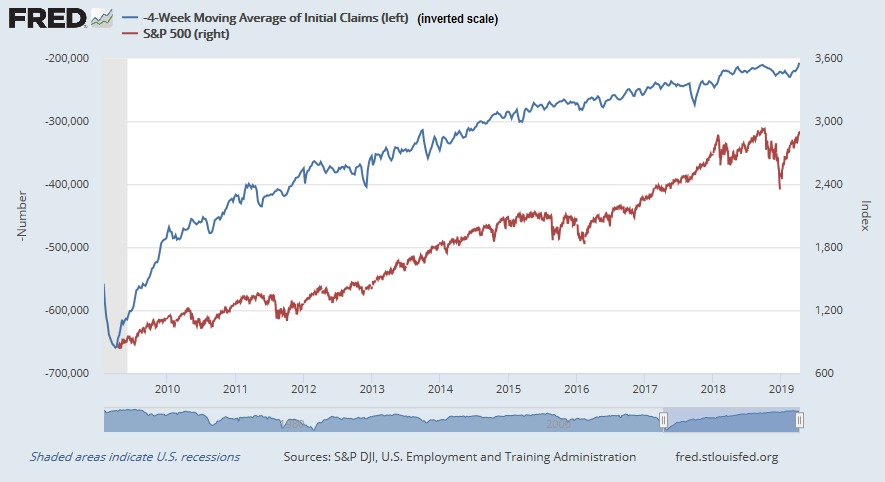
In addition, initial jobless claims fell below 200K last week, which is another cycle low. This does not look like the picture of labor market weakness. As a reminder, initial claims have been highly inversely correlated to stock prices.
A warning from small business?
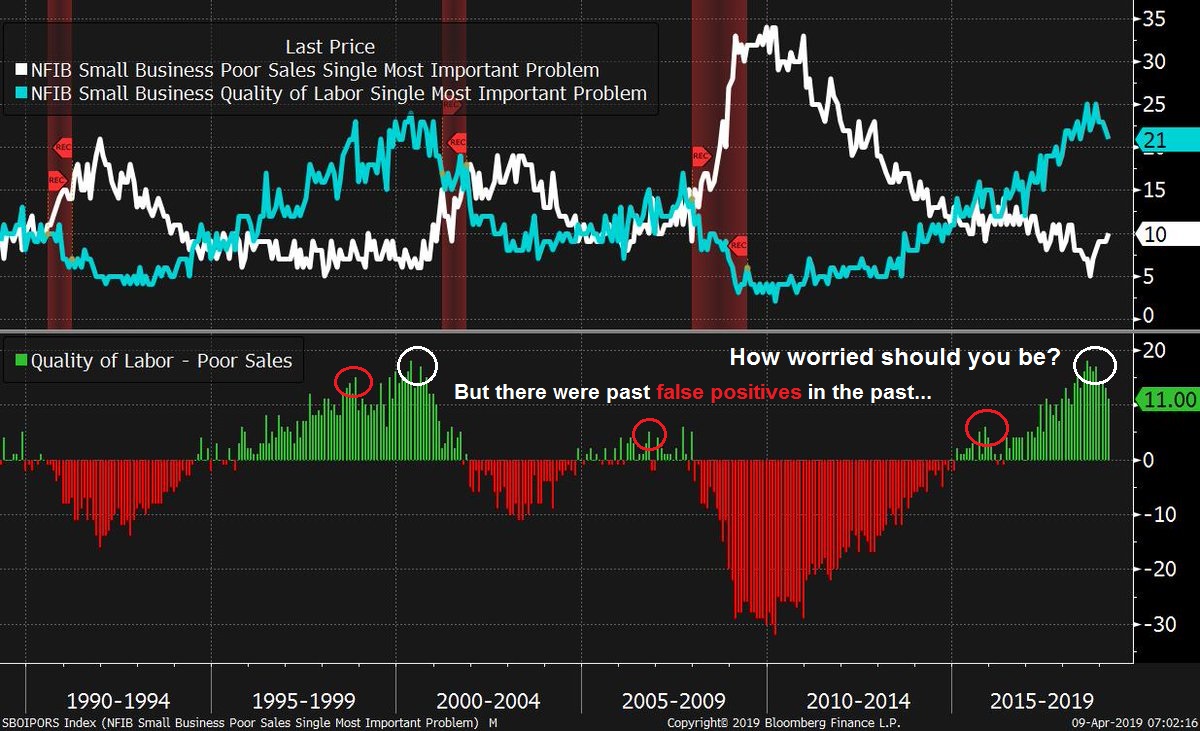
Another worrisome sign appeared with the latest monthly NFIB small business survey. Small businesses can be regarded as sensitive economic barometers and the canaries in the coalmine because of their lack of bargaining power. Joe Wiesenthal at Bloomberg pointed out that small businesses who cite “poor sales” as their biggest problem (white line) has been ticking up, while businesses who cite “quality of labor” as their biggest problem (cyan line) has been falling. The bottom panel of the chart below shows the spread between the two series. While NFIB data can be noisy, and this indicator has flash false positive signals of economic weakness (red circles) in the past, this is something to keep an eye on.
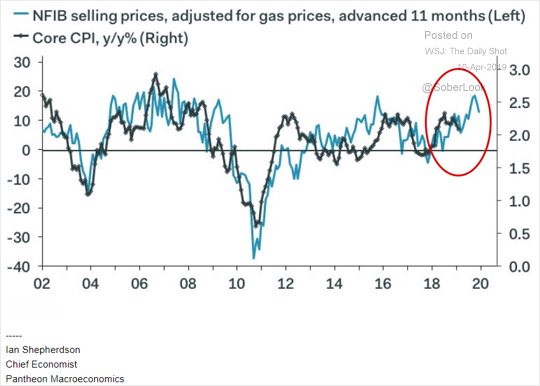
NFIB data can be very noisy and contradictory. Other analysis reveals that NFIB selling prices lead core CPI by about 11 months. How soft can the economy be if leading indicators of inflation are accelerating?
Financial stability risk
Ultimately, what matters to the Fed is the “balance of risks”. Is the economy weakening, or is the softness only temporary? What are the risks to financial stability, as this Fed chair has made this unspoken “third mandate” a key plank of monetary policy. Since financial stability was the root cause of the last two recessions, he wants to ensure that financial risks do not destabilize the economy.
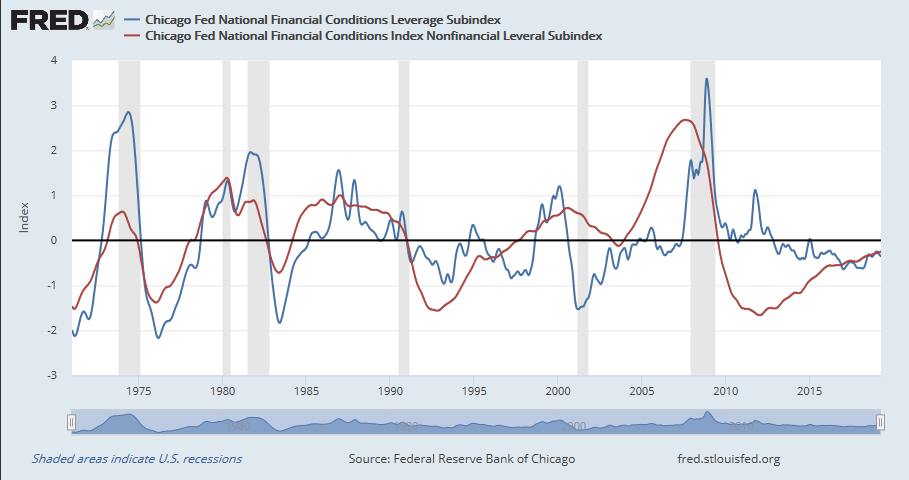
Here, the picture is mixed. The Chicago Fed’s National Conditions Leverage Subindex shows that while financial conditions for banks (blue line) are relatively tame, the level of stress for non-financials (red line) is rising.
There was good news and bad news from the quarterly senior loan officers survey. The bad news is banks tightened credit in Q4 for both small businesses (blue line) and on individuals’ credit cards (red line). The good news is conditions are not alarming and there are no signs of an outright credit crunch.

None of these readings are in red alert territory, but they do serve to underline the financial stability risks.
Green shoots of recovery
The FOMC minutes cited foreign weakness as a source of downside risk:
A number of participants judged that economic growth in the remaining quarters of 2019 and in the subsequent couple of years would likely be a little lower, on balance, than they had previously forecast. Reasons cited for these downward revisions included disappointing news on global growth and less of a boost from fiscal policy than had previously been anticipated.
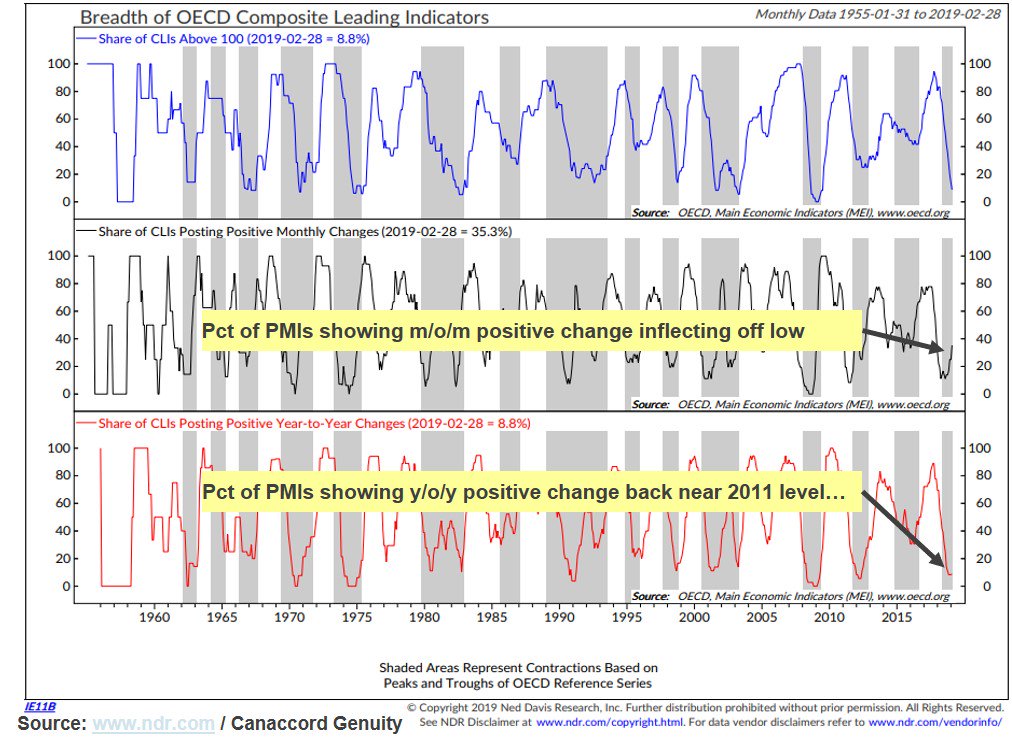
However, a number of global “green shoots” are appearing. Tony Dwyer of Canaccord Genuity observed that while global PMIs are falling, PMI breadth (middle panel) is starting to improve.
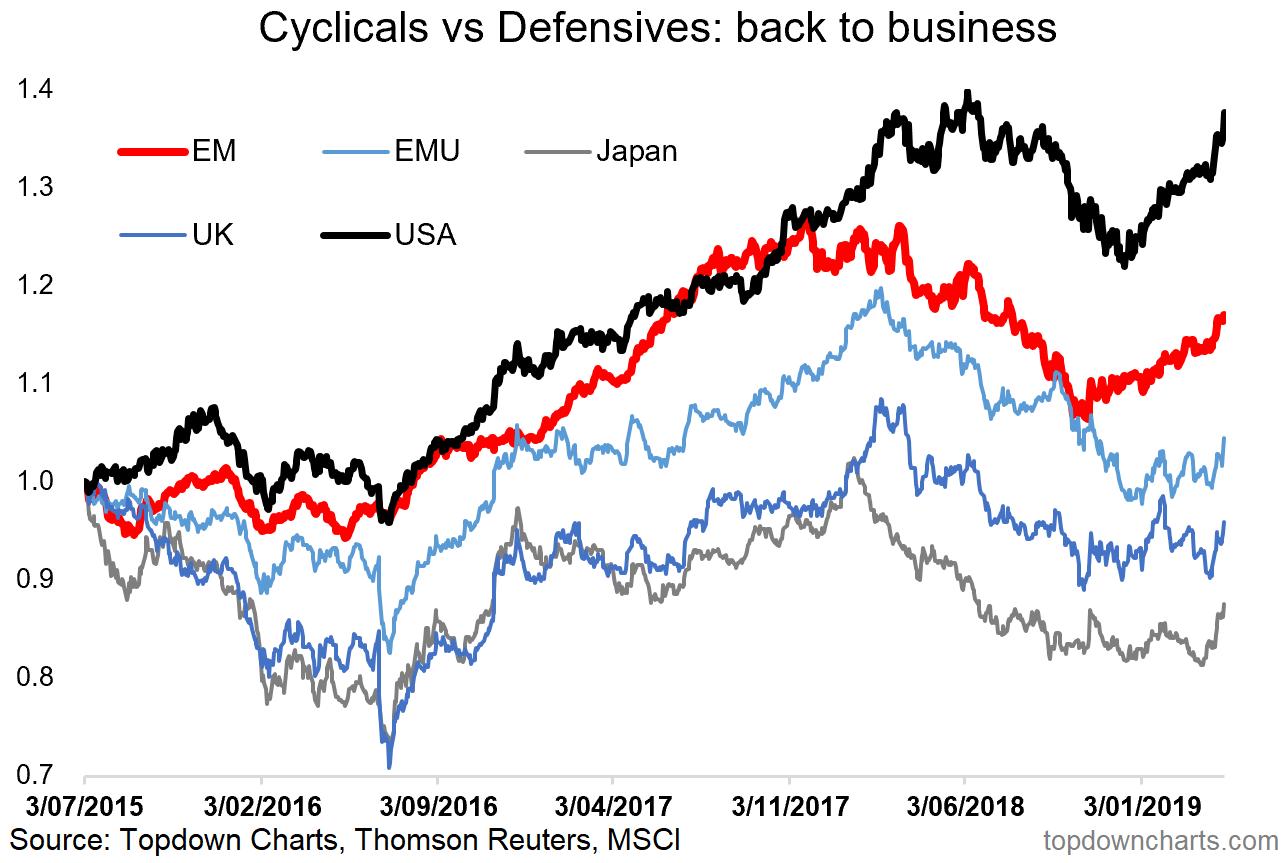
Callum Thomas also pointed out that the relative performance of cyclical to defensive stocks are rebounding all around the world.
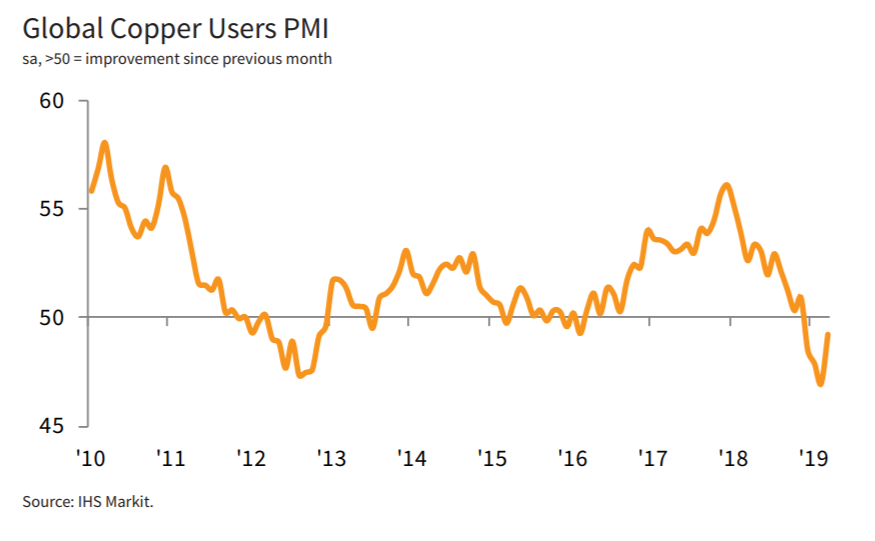
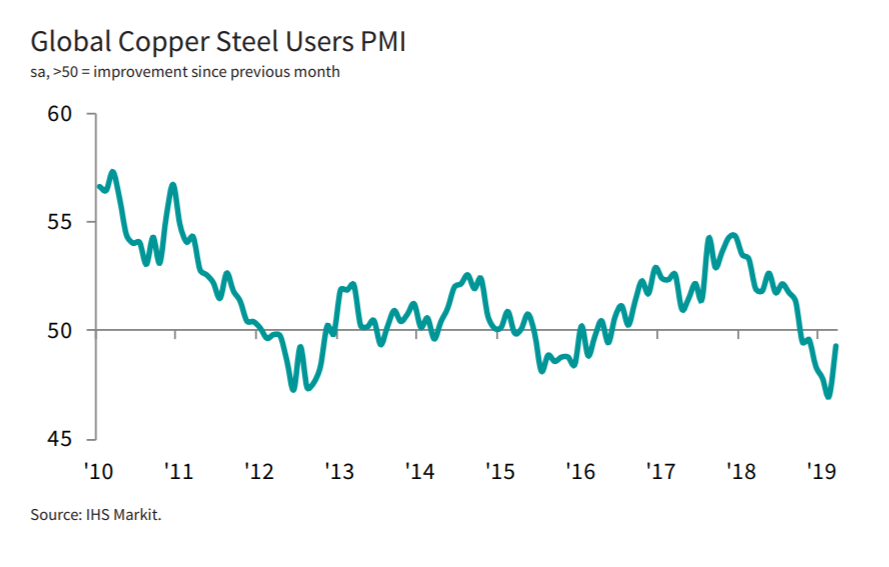
As well, the PMI of the users of cyclically sensitive commodities, namely copper, steel, and aluminum, are all turning up.

Bullish or bearish?
How do we interpret these signals? How patient can the Fed be under these circumstances?
Much depends on the Fed’s view of the balance of risks. While the balance of risks are current even, the current trajectory of economic growth suggests that growth risks will start tilting toward the upside as the year progresses, which will pressure the Fed to raise rates later this year.
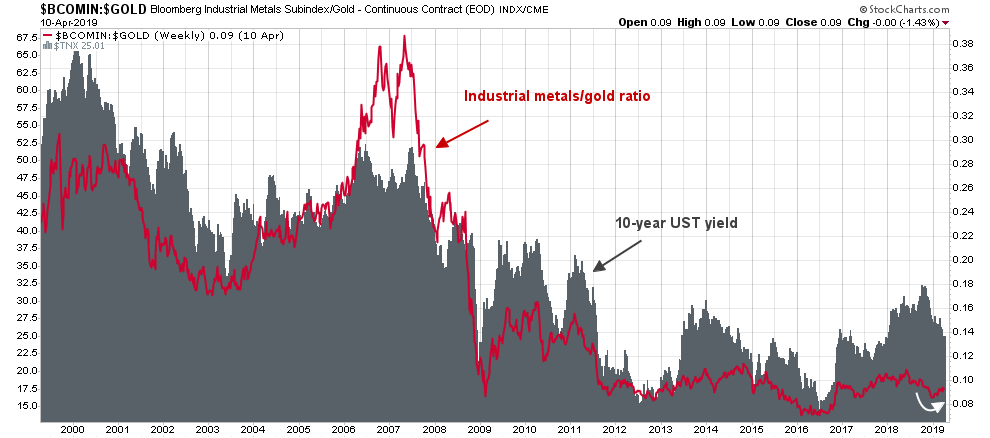
In the past, the industrial metals to gold ratio has been a reliable barometer of global growth expectations, and bond yields. Industrial metals to gold has been highly correlated to the 10-year Treasury yield in the last 20 years. Growing evidence of renewed growth should start to put upward pressure on yields in the near future.
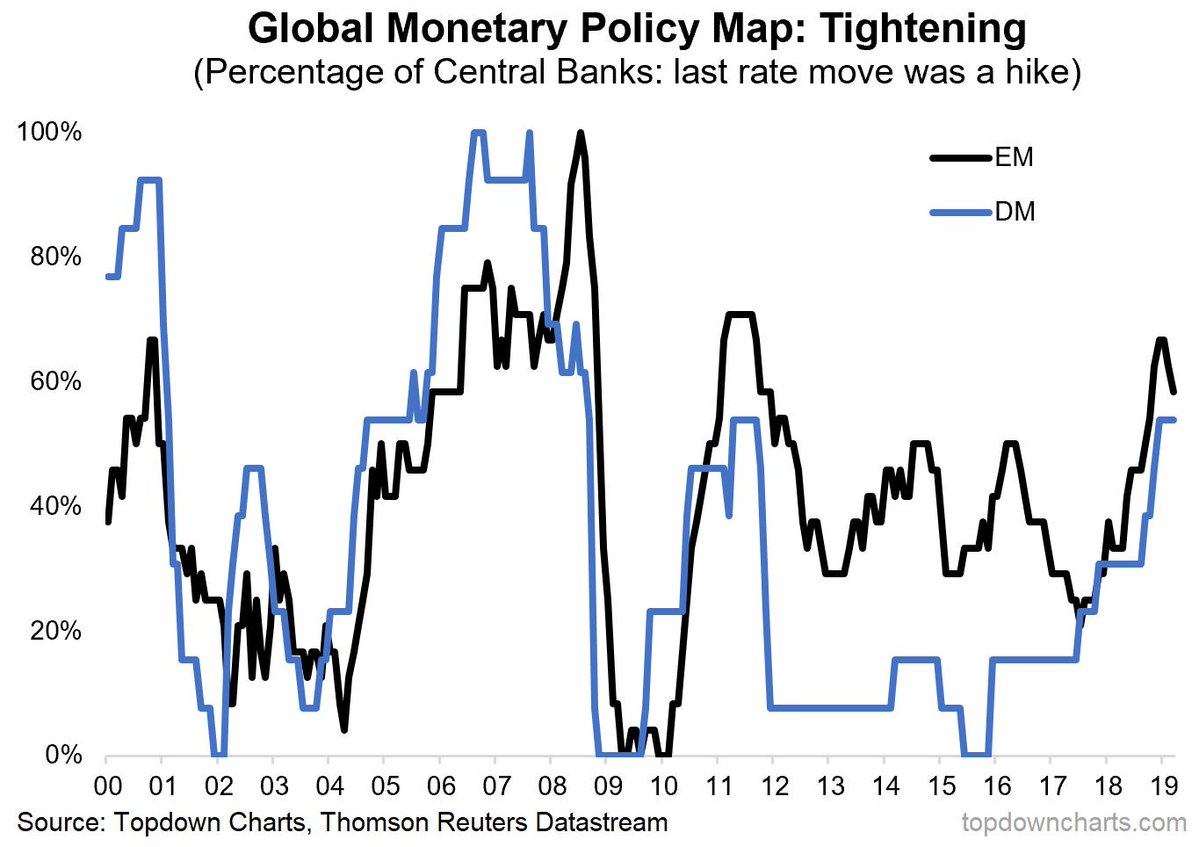
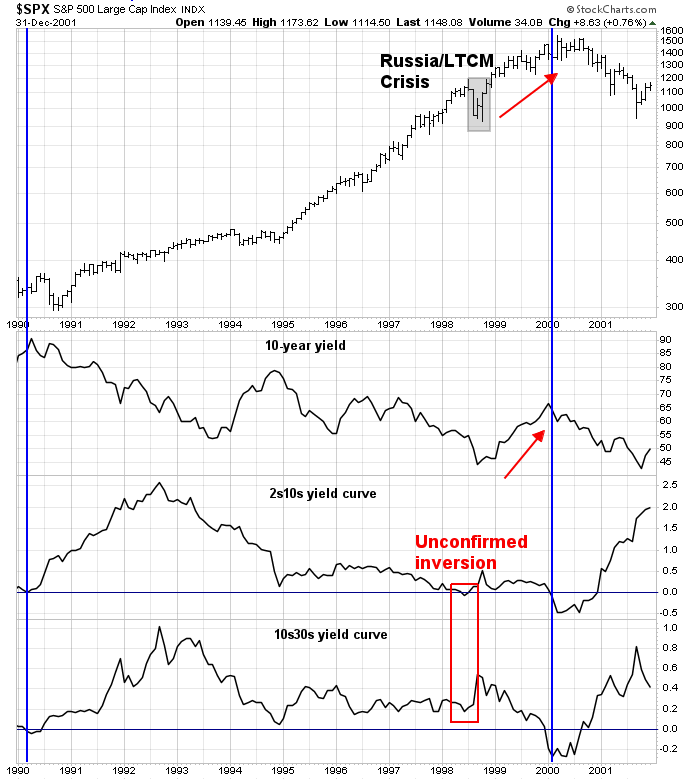
However, rising bond yields are not necessarily fatal to stock prices. One possible template for today’s market may be the late 1990’s. The 2s10s yield curve inverted during the summer of 1998, but it was unconfirmed by the 10s30s yield curve. Today, the 3m10y yield curve inverted, but the 2s10s did not, and the 10s30s had been steepening, instead of flattening. While the 2s10s spread is about 15bp, the 10s30s is over 40bp, which is a highly definitive repudiation of the yield curve inversion or flattening message. In both instances, the Fed stepped in. In 1998, it was in response to the Russia/LTCM Crisis. Today, the Fed made an abrupt policy U-turn to become “patient”. What’s more, global monetary policy has also begun to turn away from tightening.
Here is what happened next in 1998. Growth began to recover, and the 10-year yield rose as a consequence, but stock prices also rose in response to the growth recovery and the Fed’s easy monetary policy, until the ultimate NASDAQ Bubble Top in early 2000.
History doesn’t repeat itself, but rhymes. While I am not forecasting a similar blow-off top, there is still considerable upside potential in stock prices even if growth were to rebound and 10-year yields rise.
In conclusion, the market has likely misjudged the degree of the Fed’s patience. I expect a growth revival later this year will put pressure on the Fed to raise rates, and bond yields will rise. However, this is not necessarily bearish for stock prices, as long as the bullish effects of rising growth expectations outweigh the negatives of rising rates.
The week ahead: Earnings Season ahead
Looking to the week ahead, much of the short-term outlook for stock prices will depend on the reports from Q1 Earnings Season. So far, there are some hopeful signs for the bulls.
FactSet pointed out that the market is entering Earnings Season with diminished expectations: “For Q1 2019, the blended earnings decline for the S&P 500 is -4.3%.” However, with only 6% of the index reporting, the earnings beat rate is 83%, which is above the 5-year average of 72%. Earnings estimates are also coming at 7.5% above expectations, which is above the 5-year average of 4.8%.
If we were to combine the expected EPS growth decline of -4.3% with the 5-year average earnings beat of 4.8%, the market might just manage to avoid the earnings recession, a positive surprise.
In addition, the forward outlook remains positive. FactSet reports that forward 12-month EPS have been recovering and they are rising again, indicating positive fundamental momentum.
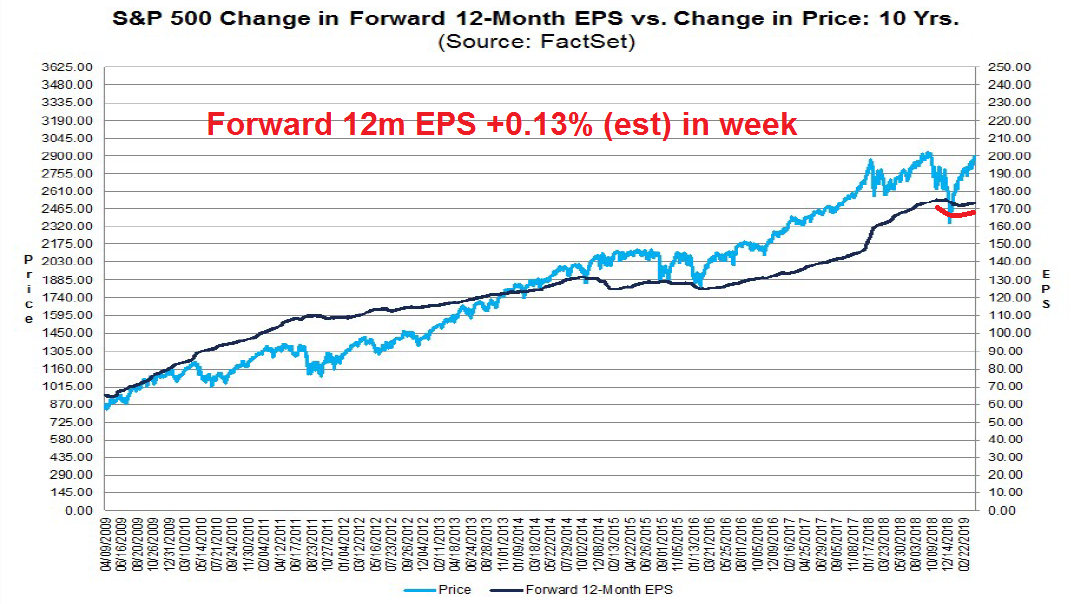
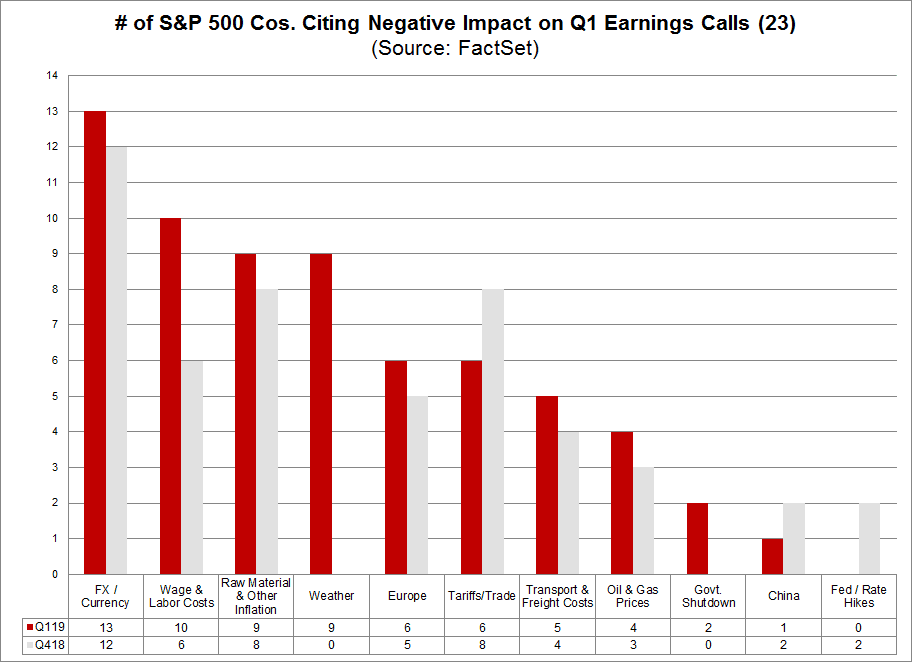
To be sure, companies are citing concerns over FX, labor costs, and materials as earnings headwinds. While these factors have not negatively affected the trend of upward estimate revisions, we will have to watch how this affects margins and inflation expectations in the weeks ahead.
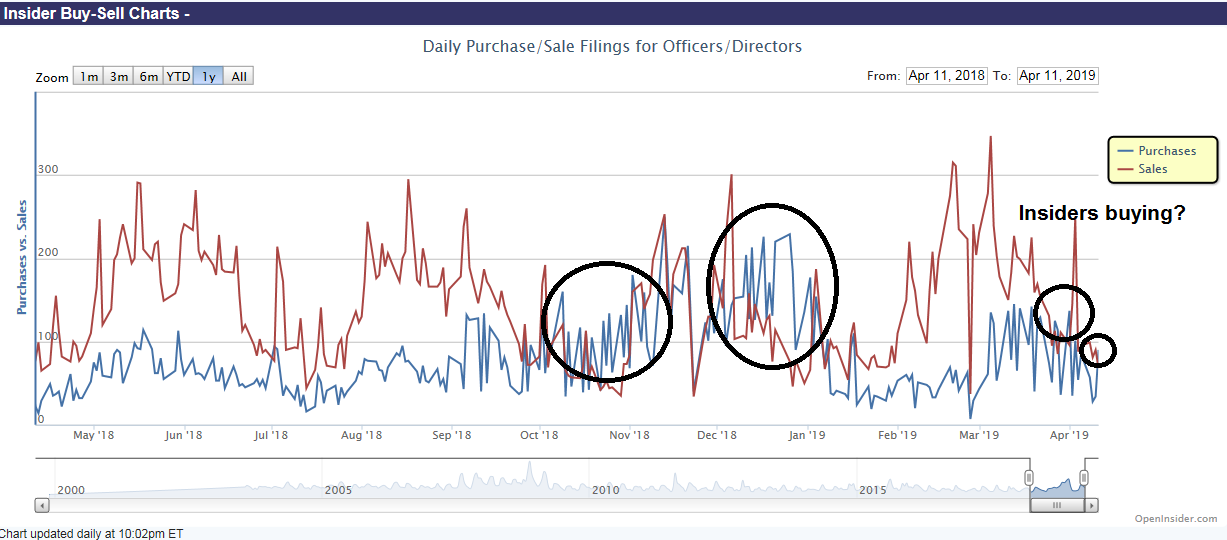
Another possible bullish signal comes from insider activity. While this signal is not as strong as it has been in the past, the latest report from Open Insider shows that insider selling has virtually dried up while the level of buys remain about the same. Recent definitive buy signals occurred during period of market weakness, and the latest mini cluster of insider buying in the face of rising stock prices is constructive for the bull case.
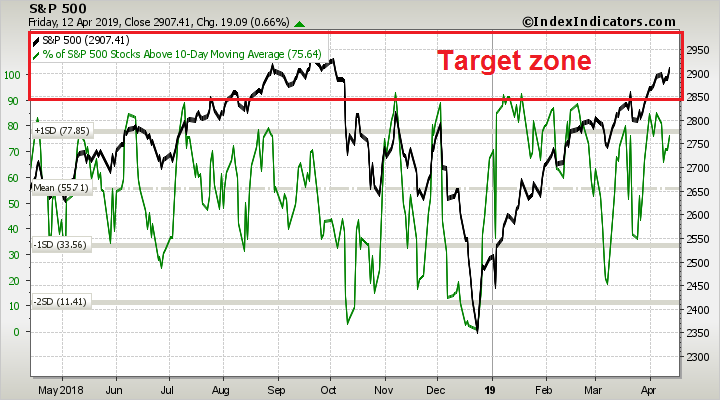
From a technical perspective, the market continues to grind up while exhibiting a series of “good overbought” readings on RSI-5, only to see the rally stall and consolidate as RSI-14 reaches overbought territory at 70, tests the rising trend line, and see the VIX test its lower Bollinger Band (bottom panel).
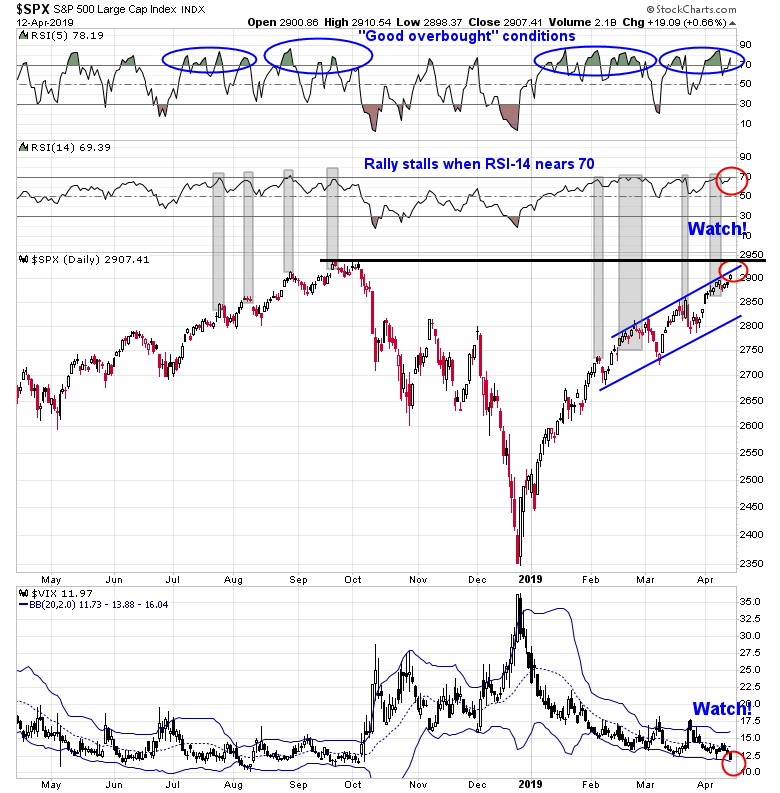
As of Friday’s close, the market stands at a near overbought condition, and it would only take a minor one-day rally for it to flash cautionary signals.
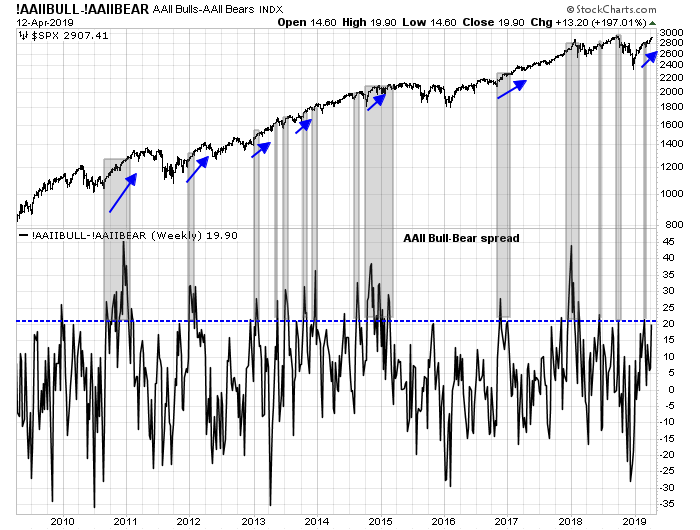
A variety of sentiment models are also supportive of further intermediate term gains. The AAII Bull-Bear spread, which measures individual investor opinion, has reached 20, but the past history of such readings has been a mixed bag. In some cases, the market has reversed course and corrected, but it has continued to grind upwards in other cases.
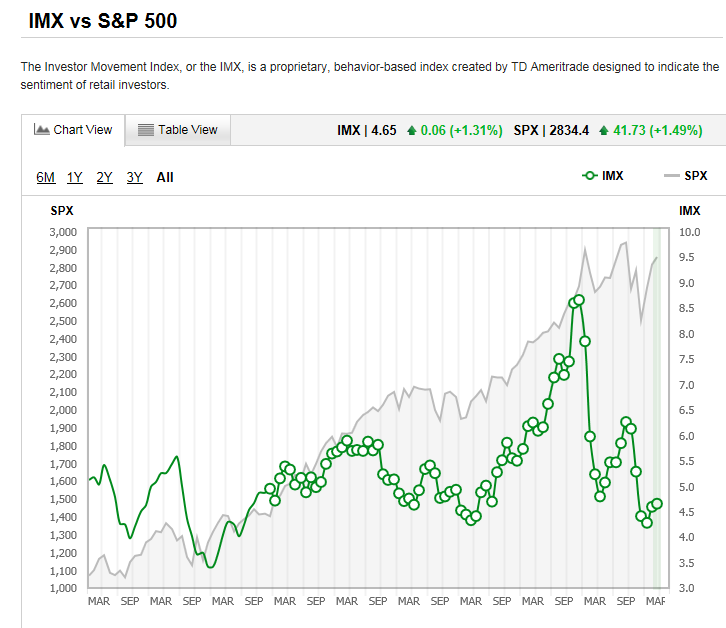
Similarly, the TD-Ameritrade Investor Movement Index, which measures how the firm’s clients are acting in their accounts, shows that bullishness is recovering, but readings can hardly be described as a crowded long.
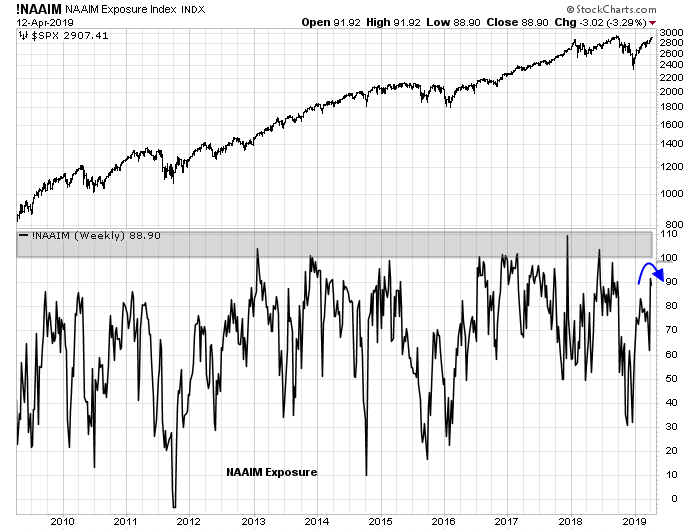
The NAAIM Exposure Index, which measures the opinions of RIAs, saw a minor retreat in bullishness last week. While readings are a little elevated, they are not at a bullish extreme, which would be contrarian bearish.
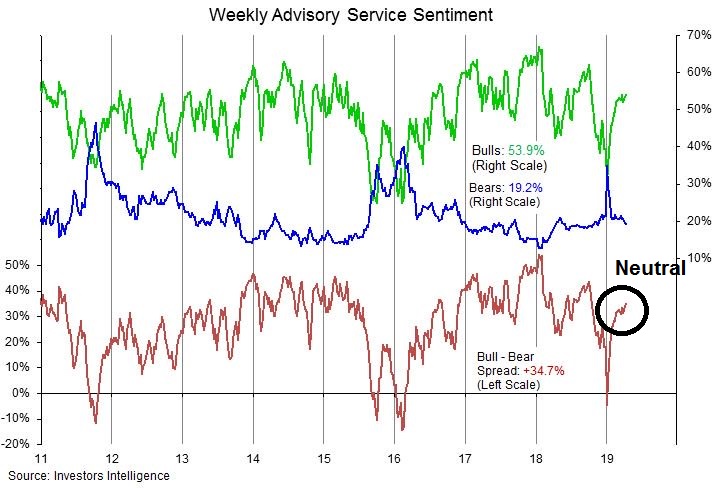
Similarly, Investors Intelligence sentiment, as measured by the bull-bear spread, is firmly in neutral.
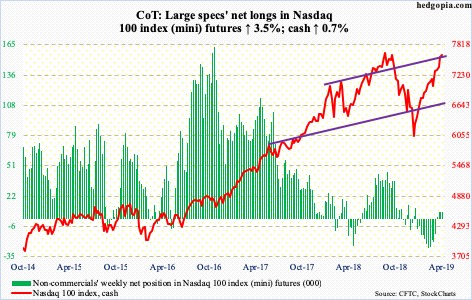
Estimates of hedge fund equity exposure do not indicate excessive bullishness either. The Commitment of Traders data of NASDAQ 100 futures, which is usually the high beta vehicle of choice for hedge funds, indicate that large speculators covered their shorts from a crowded short to a neutral position (via Hedgopia).
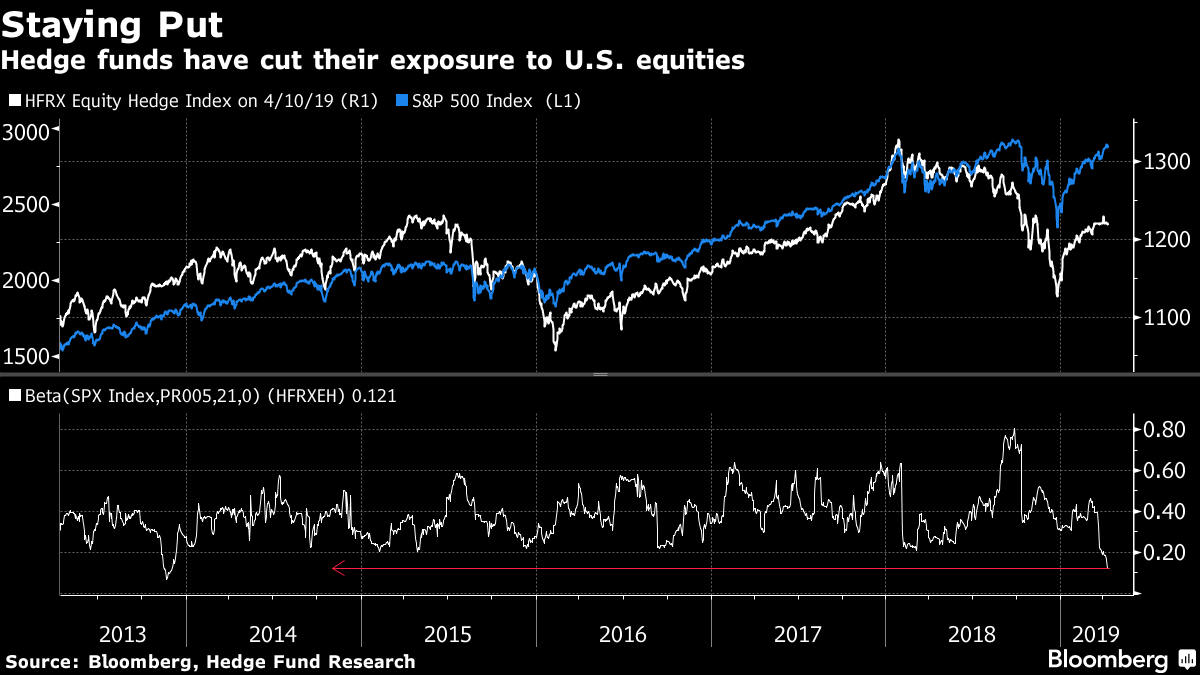
Long-short hedge funds market exposure estimates have fallen to lows not seen since 2013.
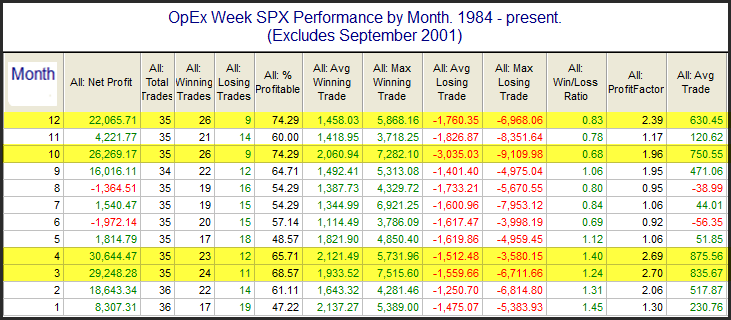
Finally, the market is likely to see some seasonal tailwinds in the coming week. It is option expiry week, and Rob Hanna at Quantifiable Edges found that April OpEx is one of the strongest OpEx weeks of the year.
My inner investor is bullish, and he is slightly overweight equities in his portfolio. My inner trader is also bullish. He is prepared for a week marked by some choppiness, but with a bullish bias.
Disclosure: Long SPXL
There are internal problems with two of the observations. In the case of industrial metals, there has been an instantaneous supply disruption with the tragic dam breaking in Brazil that has shut down major amounts of metals mining production. Gold has been very strong since early December and the Industrial Metals/Gold Index would look a lot different without the tragedy.
With defensives, the Healthcare Index has been hit with the JNJ scandal in Pharma and the Biotech sub-index crashed with Biogen’s alzheimer drug failure. Without those two unique happenings, the swing to cyclicals would not look as strong.
It does appear that the Fed has added financial markets stability to their dual mandate (unemployment and inflation). In that vein, they just learned that VERBAL shifts will do the trick to influence markets to their purpose. This means they will simply have to change the wording of a future post-meeting message without needing to actually raise rates. With stock markets possibly overheating by late summer, I expect they will shift their message to cool it out.
We are in a pre-Presidential Election Year. 1987 was also a pre-Presidential Election Year where markets were up over 30% by September with the economy strong and earnings up over 50%. But markets crashed and finished the year up only 3%.
How the Fed will handle this new mandate is unknown but I expect they will lean against extreme stock market movements in both directions with words.
Watching the movement of Fed Funds futures contracts after Fed meetings will be key in how the markets are absorbing the message.
The 1987 Crash was sparked by a series of inter-meeting hikes to defend the USD. I doubt if the Fed will do that now.
This earnings season has a critical sector that could send markets lower; Internet and Social Media. There are dark forces at work in this sector. Advertising spending could disappoint. Costs of regulations could be surprisingly high. Shifts in consumer habits could show up. This has been the best sector this bull market. If it stumbles, investors will become risk averse.
I know it’s almost impossible to know – but do you have any feeling when this rally may end? When we may get the long anticipated correction?