Mid-week market update: I would like to address a number of bearish themes floating around the internet in the past few weeks, they consist of:
- A low volume stock market rally
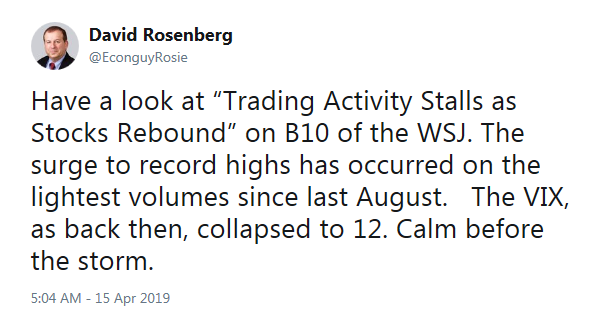
- Extreme low volatility (remember the VIXmageddon of early 2018)
- The closing stock buyback window during Earnings Season, which removes buyback support for stocks
None of these factors are likely to sink stock prices. Here are some reasons why.
VIXmageddon ahead?
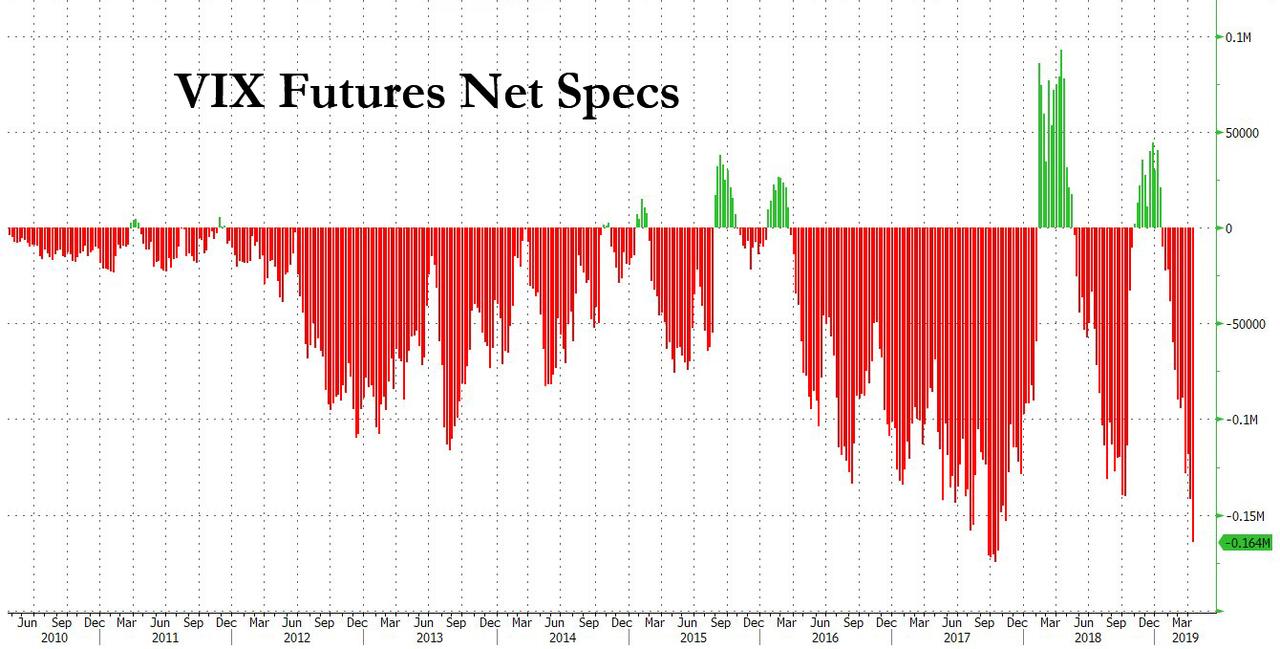
Traders remember the VIXmageddon event of early 2018. Everybody and his brother had shorted the VIX index, and it was easy money until the music stopped. It’s happening again. Zero Hedge, which is our favorite supermarket tabloid for the perma-bear set, pointed out that the Commitment of Futures report shows an extremely crowded short position in VIX futures.
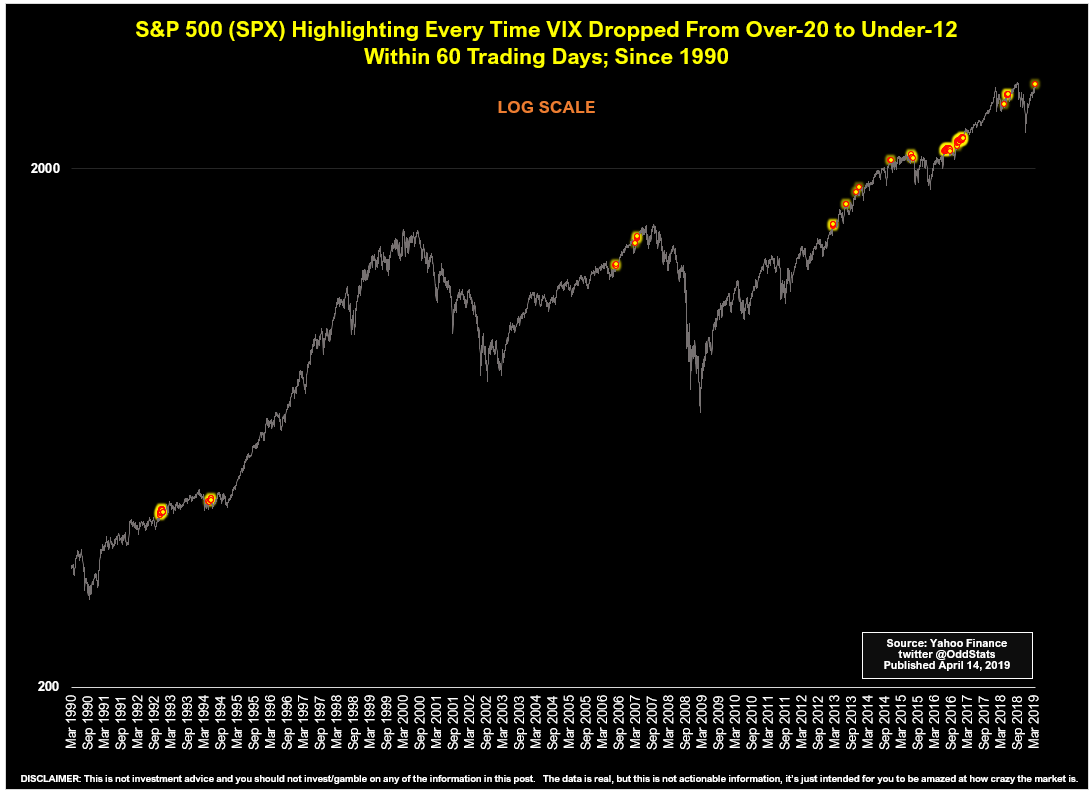
The short position stampede was sparked by a momentum trade. The VIX Index has collapsed from over 20 to 12 within 60 trading days. OddStats showed what happened to the market after such events.
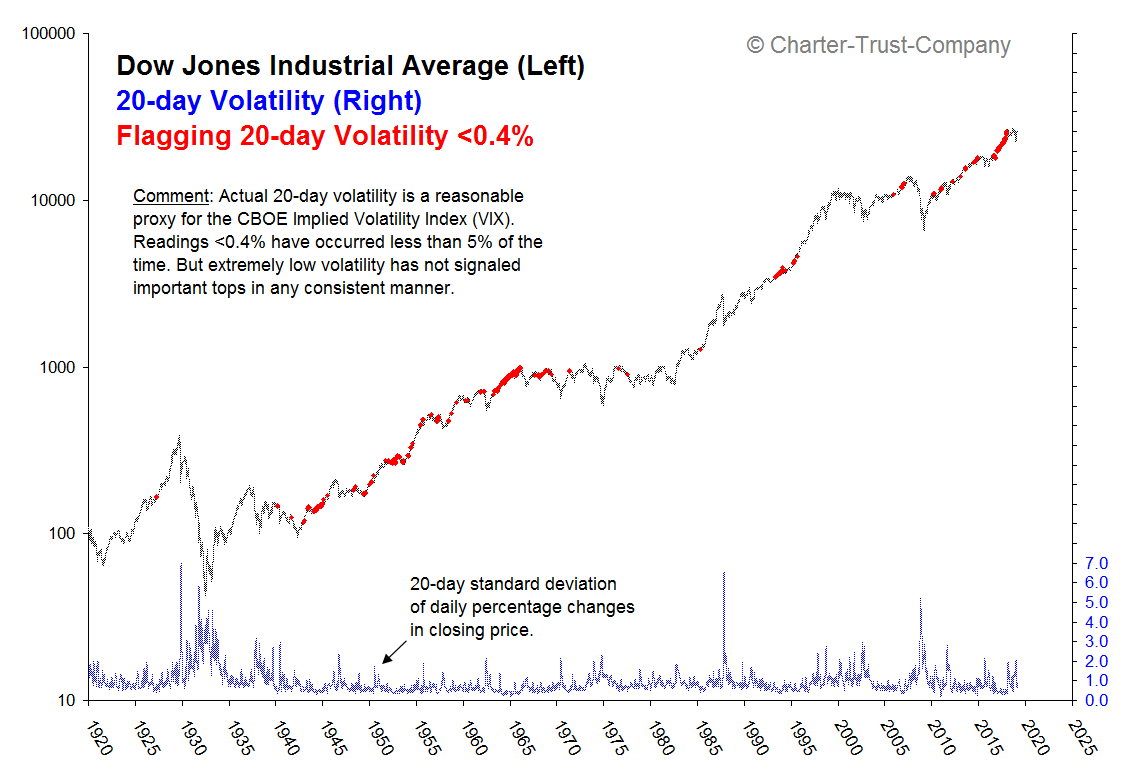
Here is another study that goes back further using the DJIA and low volatility.
Do you feel better now?
I can suggest a more sensible way of analyzing volatility. In the past, the VIX has flashed early warning signs of an impending market retreat. First, the VIX Index trading below its lower Bollinger Band was a sure sign of an overbought market, and the advance was not sustainable. While the VIX did approach its lower BB last week, it did not close below that critical level. In addition, the term structure of VIX futures also foreshadowed market declines. The inversion of the 9-day to 1-month ratio (VXST to VIX), or a spiked above 1, preceded the market collapse in January 2018, and in December 2019. This time, the VXST to VIX ratio has started to rise from a historically low and complacent level, but readings are far from an inversion. In addition, the 1-month to 3-month ratio (bottom panel) never fell to levels indicating excess bullishness.
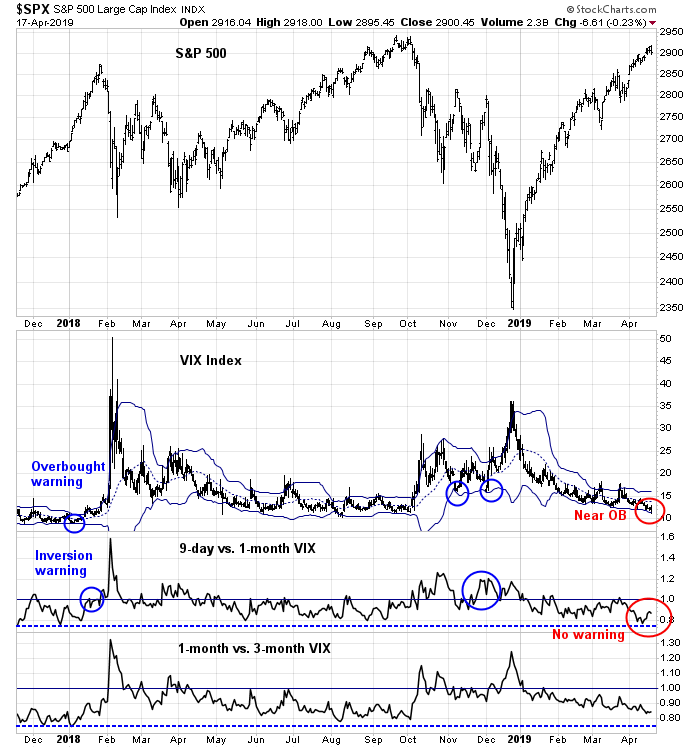
In short, I am monitoring volatility indicators for signs of possible market weakness. Those indicators are not flashing any warning signs yet.
Anemic volume
One of the adages of technical analysis is price follows volume. The current advance on low volume has raised concerns about a negative divergence. Joe Granville codified volume measures with his On Balance Volume Indicator.
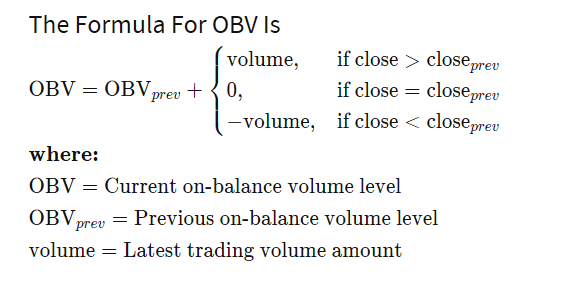
The theory is that traders should be able to spot patterns of accumulation and distribution with OBV. Watch for positive or negative divergences, they said.
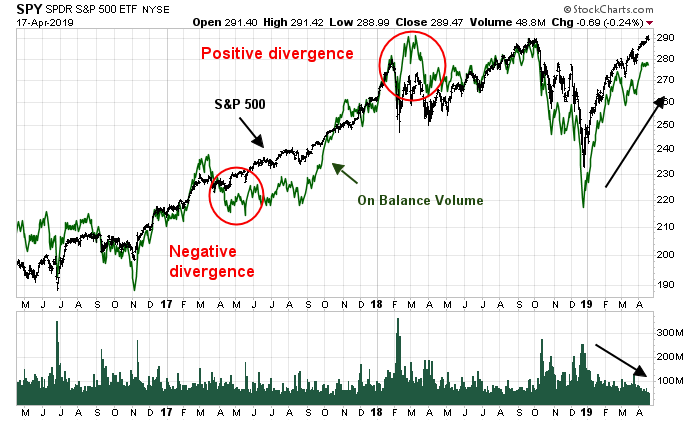
Here is the OBV pattern of SPY. Did the negative divergence in 2017 lead to a correction, or the positive divergence after the VIXmageddon collapse in February 2018 lead to market recovery?
Here is the OBV pattern of the index. The latest episode of advance on low volume, as measured by OBV, is less pronounced. However, the negative divergence in 2017 did not lead to market weakness.

There is a lesson to be learned here. Market structure has changed from the days that Granville formulated his OBV Indicator. Volume statistics are less reliable today. More trades are reported off the NYSE tape, or the consolidated tape. Trades are done off exchange in crossing networks. The presence of HFT algos are also polluting the volume data.
Not all indicators work forever.
Buyback blackout
Another reason to be bearish is the buyback blackout as we enter Earnings Season.

Matthew Bartolini at Alpha Architect studied the October 2018 correction, and he thoroughly debunked the theory that buybacks are supporting the stock market:
If buybacks were the cause of the market correction, we would expect to see poor performance before earnings announcements. Looking at the dates surrounding releases, there is no evidence of worse performance around earnings season. Broadening our scope, the regressions show residual alpha in each time period. The residual alpha should be taken with a big grain of salt since the regressions do not show significance across any time period.
Bottom line: The market isn’t going to fall because of a buyback blackout.
Reasons to be hopeful, and cautious
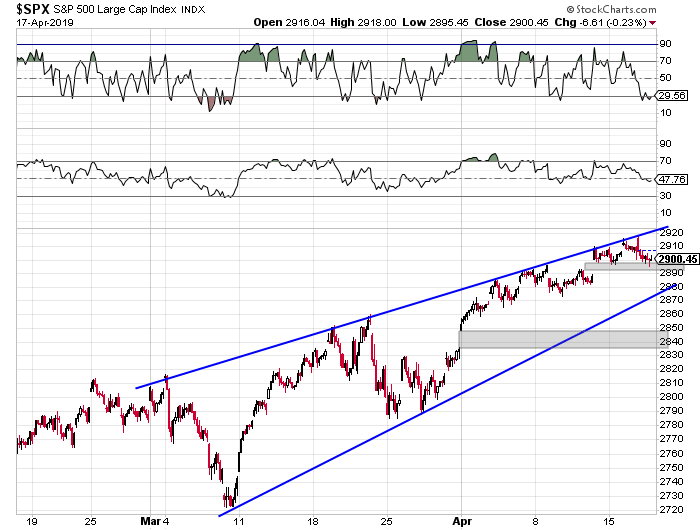
From a trading perspective, there are some reasons to be hopeful, and to be cautious. The market’s sideways action this week is supportive of its slow grind upwards. The hourly chart shows that the market’s weakness halted just short of a gap at 2900, but capped by a rising resistance trend line at about 2915. Moreover, the index may be caught between a wedge, which should be resolved with a breakout within the next week.
On the other hand, positive seasonality has only just begun. Ryan Detrick at LPL Financial pointed out that the market is just entering its most favorable period of April seasonality. The market tends to make most of its gains in the second half of the month.

My inner trader remains bullishly positioned.
Disclosure: Long SPXL
You’d make a great mythbuster. The three things you mentioned were also on my worry list. It looks like things are not as simple as the commentators are trying to portray. But the concurrence of many of these pseudo topping signals is still somewhat disconcerting (which includes the extreme NAAIM bullish reading).
I found that sentiment models behave much better at spotting bottoms than tops. Indicators like NAAIM, AAII, etc. work much better at bottoms when everyone panics. By contrast, excess bullishness tends not to be actionable sell signals and don’t mark tops very well.
That said, I see NAAIM readings as elevated, but wildly excessive.