Preface: Explaining our market timing models
We maintain several market timing models, each with differing time horizons. The “Ultimate Market Timing Model” is a long-term market timing model based on the research outlined in our post, Building the ultimate market timing model. This model tends to generate only a handful of signals each decade.
The Trend Model is an asset allocation model which applies trend following principles based on the inputs of global stock and commodity price. This model has a shorter time horizon and tends to turn over about 4-6 times a year. In essence, it seeks to answer the question, “Is the trend in the global economy expansion (bullish) or contraction (bearish)?”
My inner trader uses a trading model, which is a blend of price momentum (is the Trend Model becoming more bullish, or bearish?) and overbought/oversold extremes (don’t buy if the trend is overbought, and vice versa). Subscribers receive real-time alerts of model changes, and a hypothetical trading record of the those email alerts are updated weekly here. The hypothetical trading record of the trading model of the real-time alerts that began in March 2016 is shown below.

The latest signals of each model are as follows:
- Ultimate market timing model: Buy equities
- Trend Model signal: Bullish
- Trading model: Bullish
Update schedule: I generally update model readings on my site on weekends and tweet mid-week observations at @humblestudent. Subscribers receive real-time alerts of trading model changes, and a hypothetical trading record of the those email alerts is shown here.
The calm before the volatility storm?
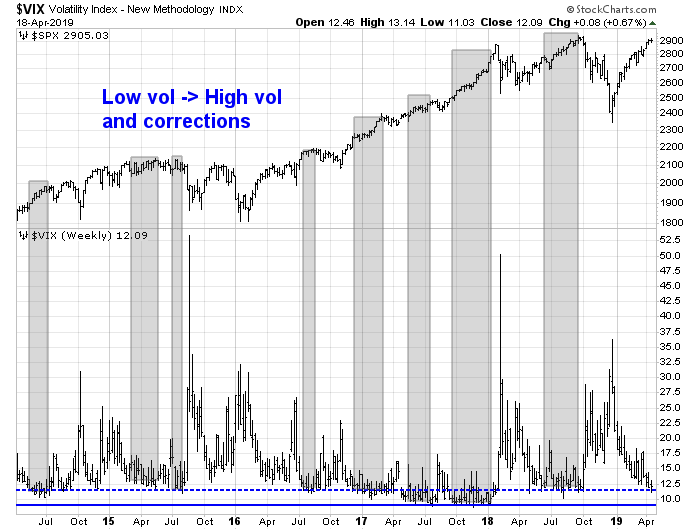
In the past week, there have been a lot of hand wringing about the collapse in volatility across all asset classes. Equity investors know that the VIX Index has fallen to a 12-handle, and past episodes of low VIX readings have resolved themselves with market corrections.
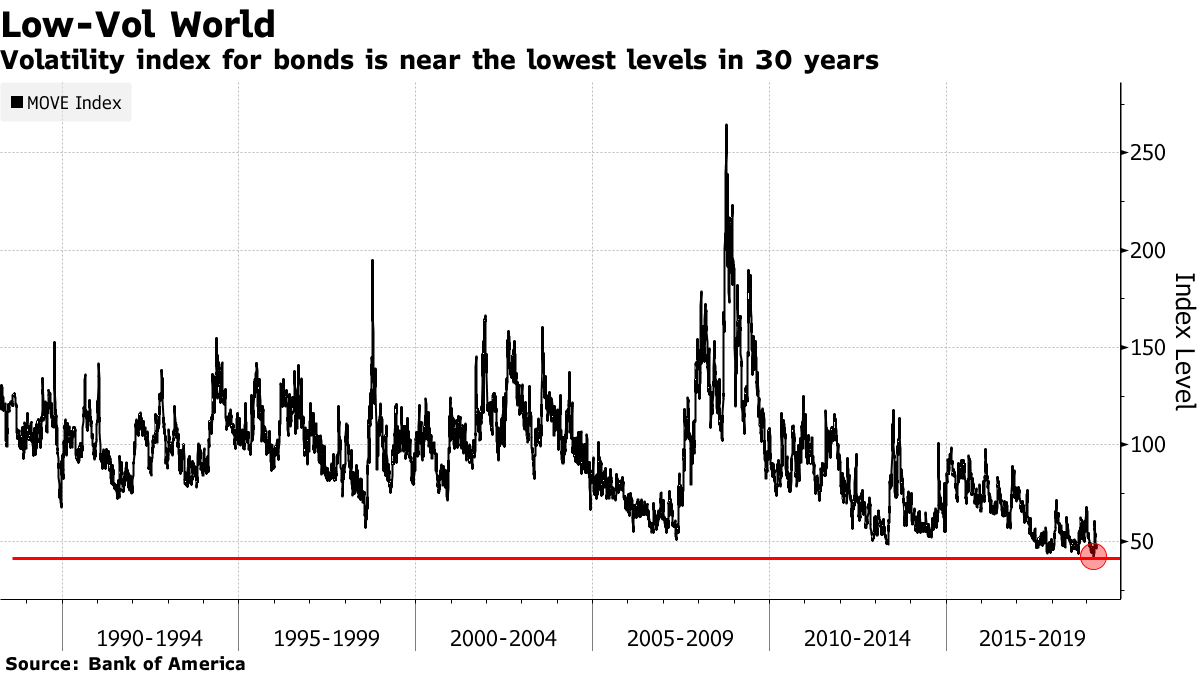
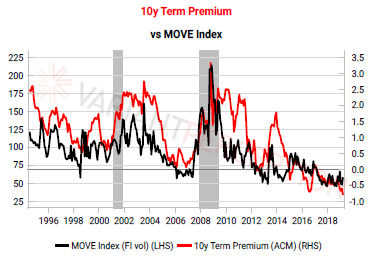
The MOVE Index, which measures bond market volatility, has also fallen to historic lows.
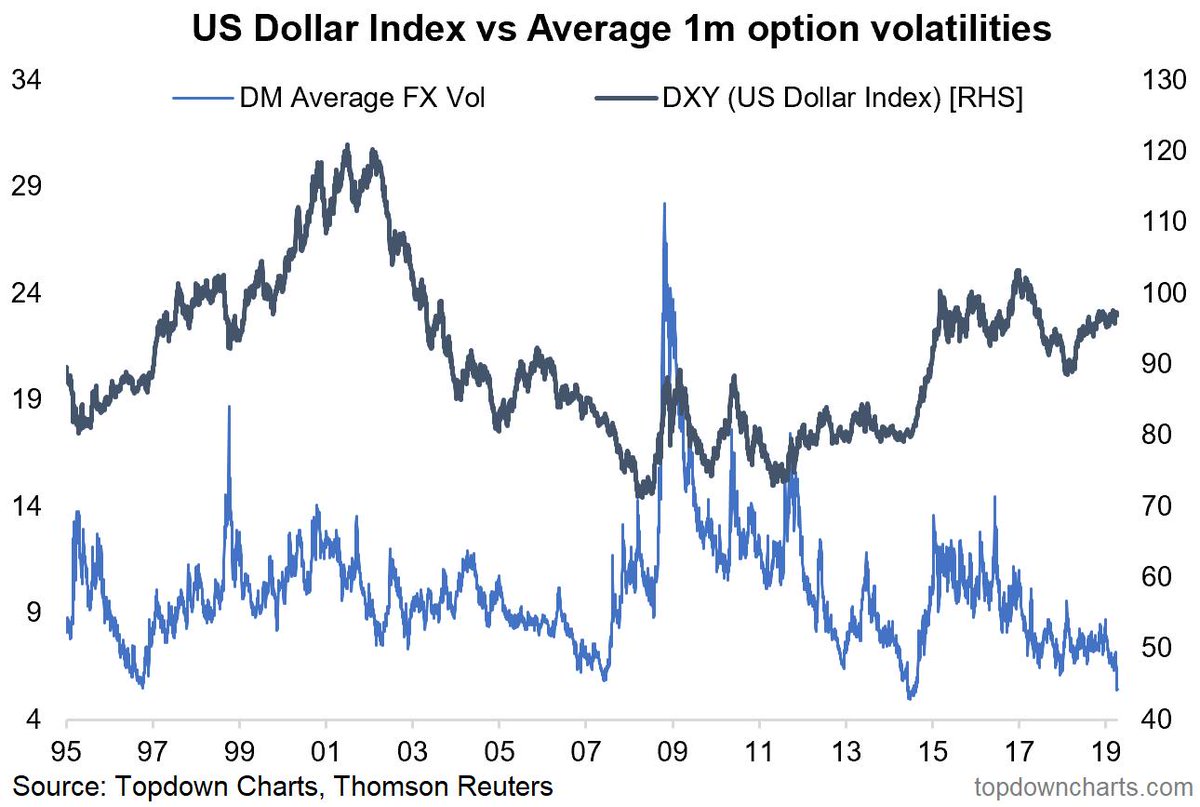
Low volatility has also migrated to the foreign exchange (FX) market.
As a sign of the times, Bloomberg reported that Europe will soon see a new short-volatility corporate debt ETF.
The 50 million euros ($56 million) product, ticker TVOL, aims to deliver steady gains so long as markets demand a higher cushion for price swings on speculative-grade debt compared with what comes to pass, or the volatility-risk premium.
This dynamic — selling volatility when it’s high and waiting for it to deflate — has spurred the post-crisis boom in financial instruments tied to shorting equity swings. Now it offers ETF traders income in the potentially more-stable world of fixed-income options.
“The premium available has been relatively persistent over the last 10 years,” Michael John Lytle, chief executive of Tabula, said in an email. “Most of the time it has also been larger in credit than in equity.”
The Tabula product tracks a JPMorgan Chase index that simulates the returns of selling a so-called options strangle on a pair of credit-default-swap indexes referencing high-yield markets. The underlying index has returned an average 2.9 percent over the past five years but has posted losses over the past 12 months, a period that coincided with the fourth-quarter meltdown in risk assets.
This ETF launch is a classic case of investment bankers feeding the ducks when they’re quacking. What could possibly go wrong?
Is this the calm before the volatility storm? What’s next? The answer was rather surprising.
Some volatility can be ignored
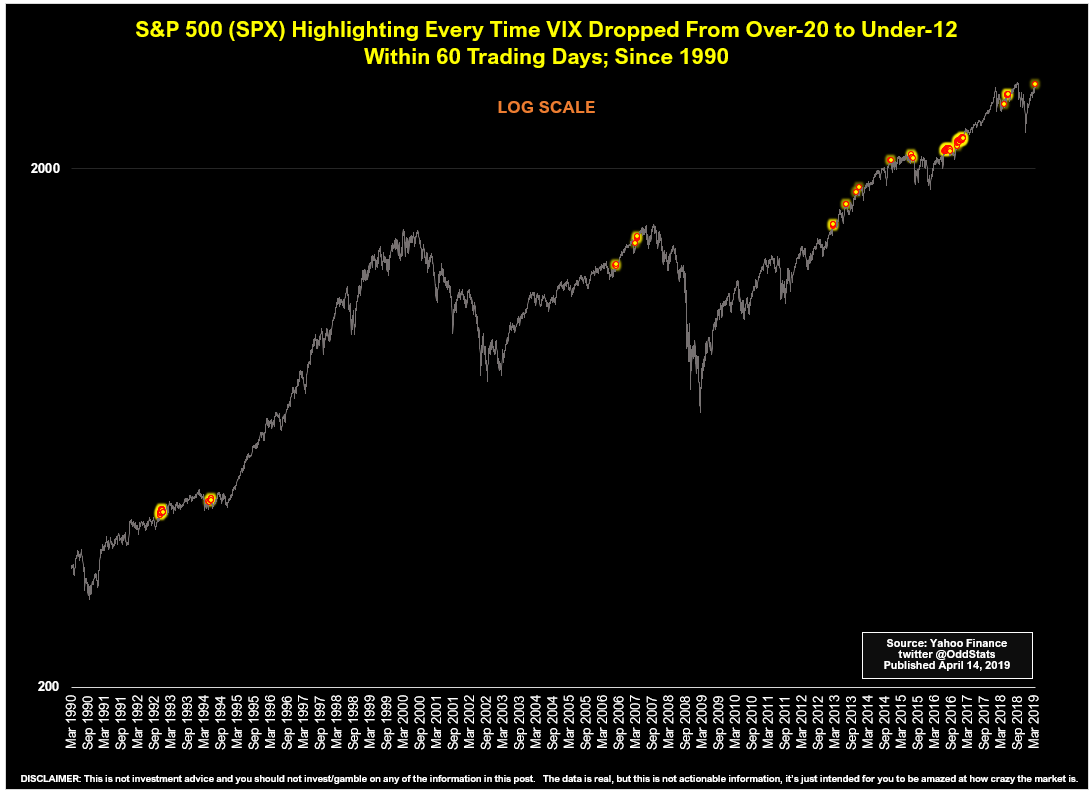
While it is true that low volatility periods are eventually followed by high volatility periods, the mere existence of a low vol state is not an actionable sell signal. For example, OddStats showed what happened to the market after the VIX Index fell from over 20 to 12 within 60 trading days.
Bloomberg reported that Harley Bassman, who invented the MOVE Index, voiced some concerns about the low MOVE Index readings, but they were only cautionary signals.
“Low volatility, by itself, is not a sign of bad things to come,” Bassman said in an interview. “But together with low rates and a flat curve, all three send the same message:
Volatility is going to rise as things become problematic with the economy.” A recession isn’t imminent, but mid-2020 “would be a fine time for historical indicators to reprise their prescience,” he added…Low implied volatility doesn’t cause market disruptions, but it’s often “found loitering near the scene of the crime,” Bassman says. It’s associated with negative convexity, a sort of accessory after the fact that can accelerate a market move in progress.
But a flattening yield curve followed by tightening credit spreads usually precede it, and are the usual suspects when the economy winds up in the tank.
You can also think of low volatility as fuel, Bassman says. As a sign of ebbing demand for risk-management products and overexposure to risky assets such as triple-B-rated bonds (thus the tightening credit spreads), it’s necessary for the explosion, but “is not the match, it’s the gasoline.”
Another reason for the low level of MOVE is lower term premium, according to Variant Perception. As long as the market’s view of uncertainty for holding longer dated fixed income securities persists, bond market volatility will stay low.
Low FX volatility is a bit more worrisome. In the past, extremely low FX volatility has been followed by a large move in the USD, though the direction is unclear. Investors need to understand the potential of the move, work through the implications, and prepare accordingly.
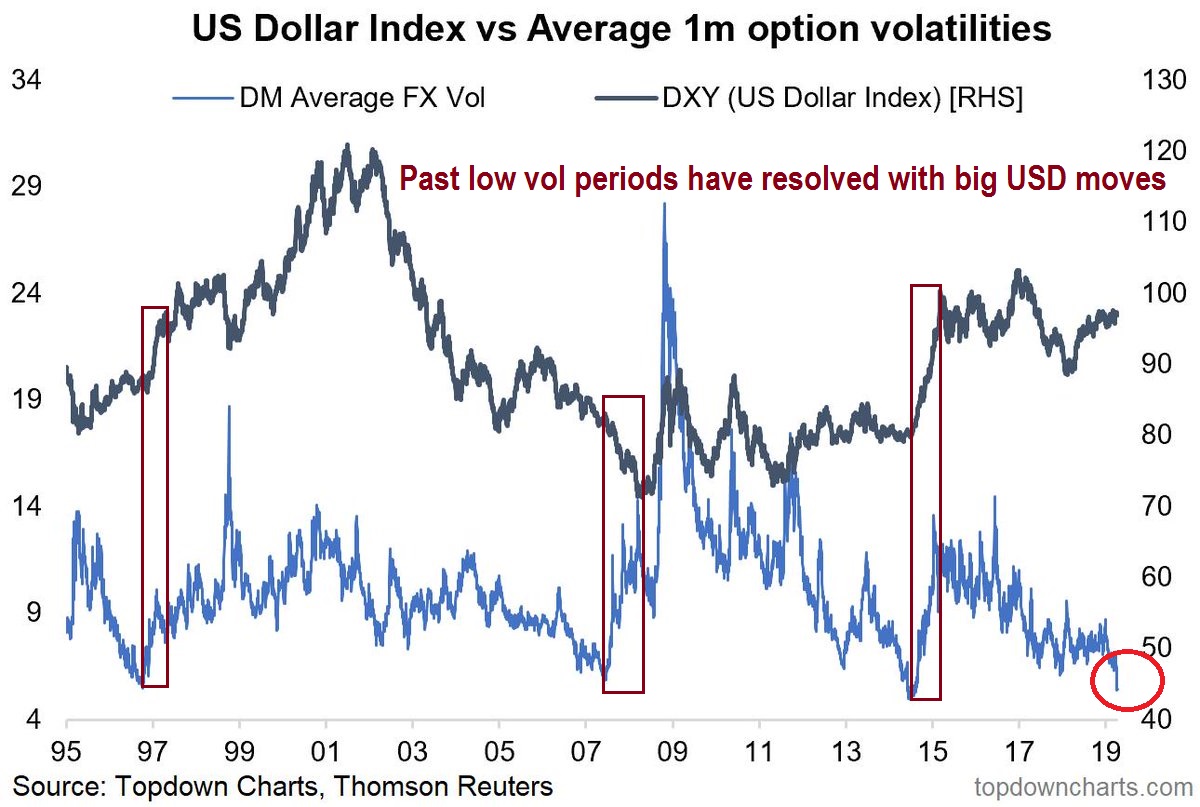
A mean reversion in FX volatility may be the most important driver of asset returns over the next 12-24 months.
Which way the greenback?
Which way is the USD likely to move, up or down? Different techniques yield different results.
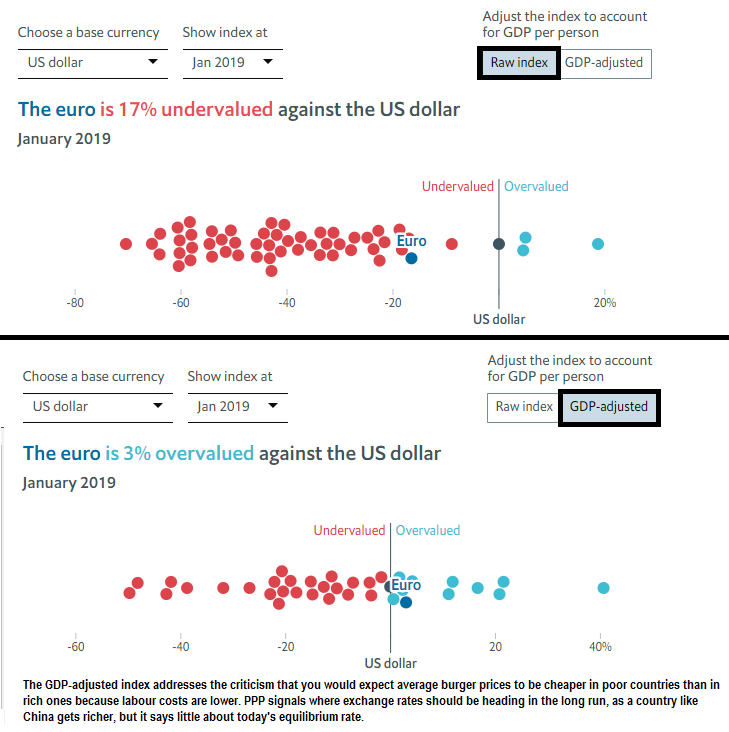
The classic method of purchasing power parity (PPP) points to an overvalued greenback, according to The Economist’s Big Mac Index.
The Big Mac index is based on the theory of purchasing-power parity (PPP), which states that currencies should adjust until the price of an identical basket of goods—or in this case, a Big Mac—costs the same everywhere. By this metric most exchange rates are well off the mark. In Russia, for example, a Big Mac costs 110 roubles ($1.65), compared with $5.58 in America. That suggests the rouble is undervalued by 70% against the greenback. In Switzerland McDonald’s customers have to fork out SFr6.50 ($6.62), which implies that the Swiss franc is overvalued by 19%.
According to the index most currencies are even more undervalued against the dollar than they were six months ago, when the greenback was already strong. In some places this has been driven by shifts in exchange rates. The dollar buys 35% more Argentinian pesos and 14% more Turkish liras than it did in July. In others changes in burger prices were mostly to blame. In Russia the local price of a Big Mac fell by 15%.
The chart below shows the raw Big Mac Index on the top panel, and the GDP-adjusted index on the bottom. As the top panel shows, very few currencies are overvalued against the USD, and most are on the left of the chart, indicating undervaluation. The GDP-adjusted index was developed to address “the criticism that you would expect average burger prices to be cheaper in poor countries than in rich ones because labour costs are lower”, and it shows the USD to be more fairly valued.
While PPP-style techniques like the Big Mac Index does offer some insight into equilibrium exchange rate levels over a 10-year period, The Economist offered the following caveat for the shorter term:
Such deviations from burger parity may persist in 2019. Exchange rates can depart from fundamentals owing to monetary policy or changes in investors’ appetite for risk. In 2018 higher interest rates and tax cuts made American assets more attractive, boosting the greenback’s value. That was bad news for emerging-market economies with dollar-denominated debts. Their currencies weakened as investors grew jittery. At the end of the year American yields began to fall as the global economy decelerated and investors anticipated a more dovish Federal Reserve. But the dollar has so far remained strong.
On the other hand, other analytical techniques indicate a bullish outcome. From a technical perspective, the USD Index may be forming a bullish cup and handle formation.

Currency strategist Marc Chandler also made the case that the greenback is about to enter another significant bull leg:
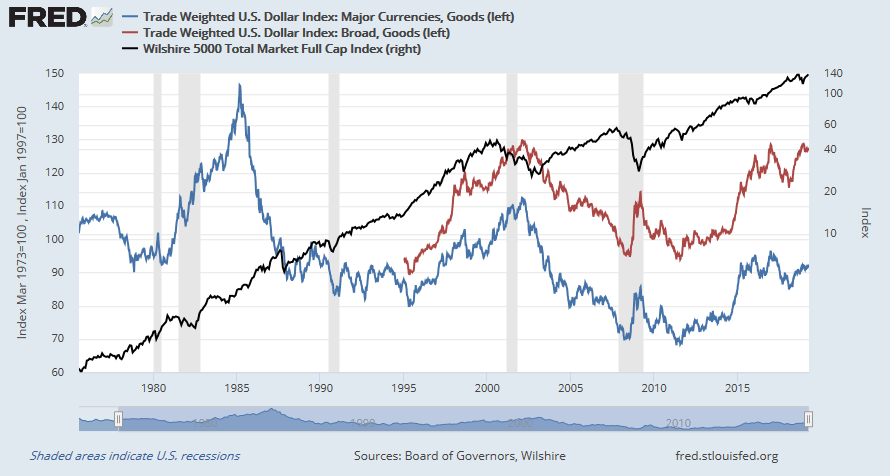
In the big picture, we argue that the dollar’s appreciation is part of the third significant dollar rally since the end of Bretton Woods. The first was the Reagan-Volcker dollar rally, spurred by a policy mix of tight monetary and loose fiscal policies. The rally ended with G7 intervention to knock it down in September 1985. After a ten-year bear market, a second dollar rally took place. It can be linked to the tech bubble and the shift to a strong dollar policy.
Chandler identified three phases of the USD rally. The first phase began Reagan-Volcker era, followed by the Clinton era and tech bubble, which drew foreigners into Dollar assets, and the third phase was the Obama rally, as the US economy recovered faster than its major trading partners in the wake of the Great Financial Crisis. Chandler believes that the US is about to take the global lead in growth again, which would put upward pressure on the USD.
With the fiscal stimulus winding down, the dollar may enter the third phase of its super-cycle: a return to divergence. Recall that the global slowdown began in H2 18, but the fiscal stimulus that is saddling the US with more a trillion dollar a year deficit helped mitigate the pressure. It grew at an average pace of 3.8% in the middle two-quarters last year. The German and Japanese contracted in Q3 and Q4 was only a little better. The Italian economy contracted in both quarters.
Historically, USD strength has been correlated with GDP growth. Renewed growth in the US economy would put upward pressure on the greenback.
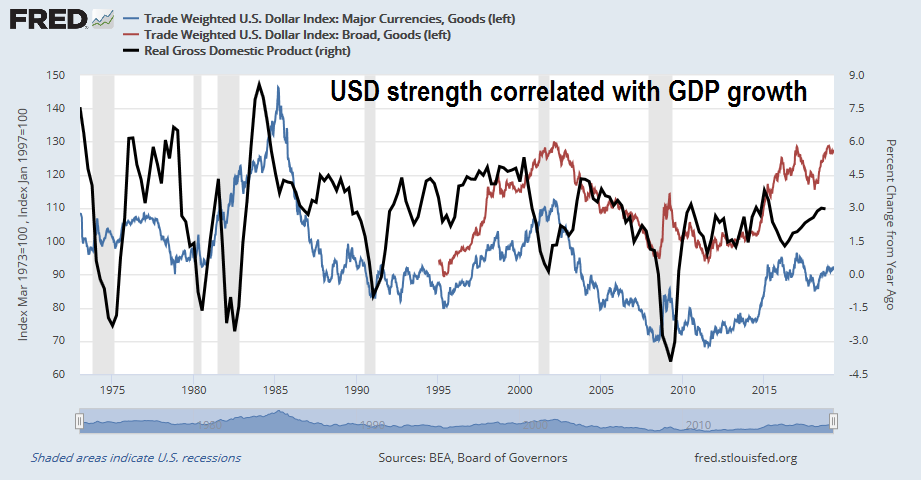
Viewed from this perspective, the technical cup and handle formation makes perfect sense.
Untangling the macro and investment implications
For investors, even knowing the USD is poised to strengthen will be tricky to navigate. There are many moving parts to currency appreciate. Here are some first order effects:
- Dollar strength means commodity weakness, which could spark a manufacturing renaissance as the price of inputs fall in the US.
- A rising USD will put downward pressure on imported inflation, which gives the Fed more room to ease, but
- Rising USD will put pressure on vulnerable EM economies with Dollar debt, and raise financial stability concerns, and
- The flip side of the rising USD coin are depreciating foreign currencies, which will increase trade tensions.
- In the short run, the earnings of large cap multi-nationals would face headwinds, as roughly 40% of the revenues of the companies in the S&P 500 are non-US, but
- Domestic earnings would be boosted by better US growth.
There are many moving parts whose second order effects are not known. What will the policy response be to these developments? From the Fed? From major trading partners? How will US trade policy change as its currency rises?
These are all very good questions with no answers.
For equity investors, I can make the assurance that while the short-term effects of USD strength is negative on earnings and margins, the historical experience shows that stock prices are not correlated in any form to currency movements.
Timing the dollar rally
The timing of a Dollar bull move may not be immediate. There are a number of factors working to suppress the USD, and a breakout in asset volatility.
Firstly, large speculators are already bullish on the USD, and they are adding to their aggregate long positions.

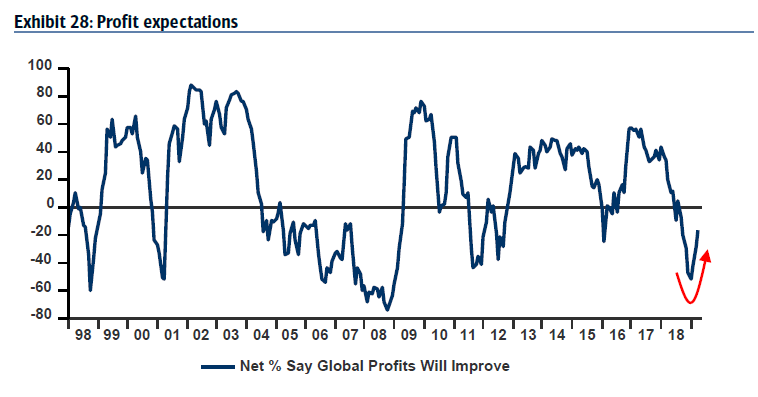
In addition, the USD is unlikely to break upwards until we see some definitive signs of economic strength. The market just underwent a global growth scare. While expectations are starting to turn up, as evidenced by the latest results from the BAML Fund Manager Survey, a consensus about renewed economic momentum is not evident among market participants or policy makers.
To be sure, economic growth is recovering. The Atlanta Fed’s GDPNow, or nowcast of Q1 GDP growth, has recovered to 2.8% from a low of 0.3% on March 1, the New York Fed’s nowcast is 1.4%, and the St. Louis Fed’s nowcast is 1.9%. The real test for Fed officials will come later this year when the growth outlook recovers and stabilizes. When will policy start to tilt more hawkish and when will they signal likely rate hikes, and how will the market respond to the resulting clash between the White House and the Fed?
In conclusion, the market may be setting up for a major currency market move either later this year or early next year. Investors should be aware of such a development, and be prepared for a return of market volatility. At this time, too many unknown variables exist to reliably forecast the direction of stock prices, but history shows that equity returns have not been significantly correlated with the USD. Nevertheless, a mean reversion in FX volatility may be the most important driver of asset returns over the next 12-24 months.
The week ahead
Peering into the crystal ball for the week ahead is a case of fun with technical analysis. It is easy to arrive at both bullish and cautious views of the market, even when analyzing the same chart.
The bulls can point to a pattern of a market that has been grinding upwards as it has exhibited a series of “good overbought” readings on RSI-5, while testing overhead resistance at an uptrend channel, only to pull back and consolidate whenever RSI-14 reaches or nears an overbought level of 70. At the current rate of advance, the market could potentially test its all-time highs in late April, though that is not a specific forecast.
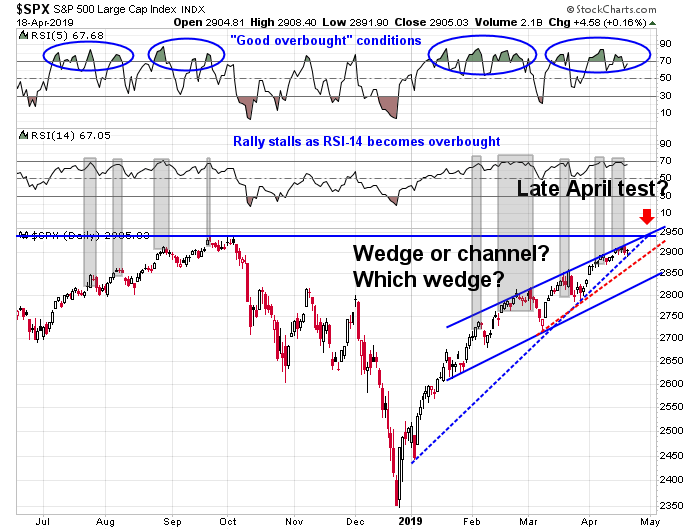
The bear case is based on a market caught in an ever tightening wedge pattern. If the index were to break down through wedge support, it would signal the start of a corrective phase. It is unclear, however, whether the market is rising in an orderly channel, which is market by the solid blue lines, or a wedge. If it is a wedge, how is the underside of the wedge defined? Wedge support could be defined by the dotted blue line, or the dotted red line.
Jason Goepfert at SentimenTrader also highlighted an ominous signal last week. He observed that “Dumb Money Confidence” has reached its highest level in a decade. He added, “Every date that saw this high of a reading in the past 20 years sported a negative return in the S&P 500 at some point between the next 2-8 weeks.”
I analyzed the Dumb Money Confidence indicator and came to the conclusion that this is not an actionable sell signal. The chart below depicts the indicator shown by Goepfert, overlaid with the S&P 500 in the bottom panel. There were two instances when the indicator reached similar levels as it is today, which are shown in black, and four others that were close, shown in grey. I further marked the maximum peak-to-trough drawdown on a closing basis. In some cases, the signal occurred after the market peak, and those instances were marked by “L”.
In half of the cases, the market continued to climb, and the drawdown was minimal. In others, the maximum drawdown varied between -4% and -8%, though the decline measured at the peak of the signal tended to vary between -2% and -6%. While I am always open to new trading system ideas, I conclude that this signal is at best noisy, and at worse no better than a coin toss. The drawdowns do not appear significant compared to an investor who is assuming normal equity risk.

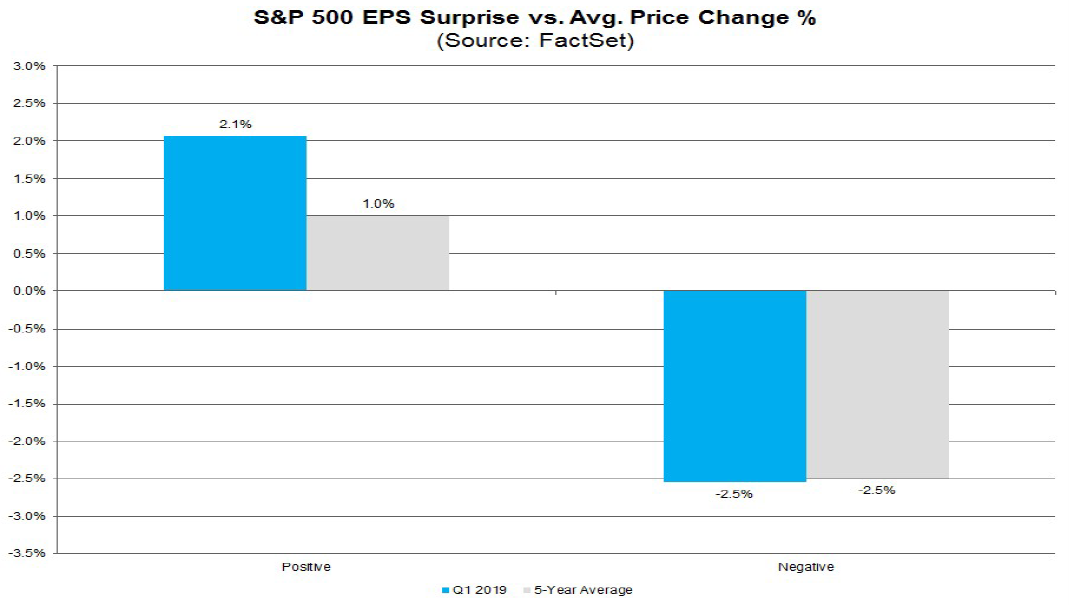
My inclination is to tilt towards the bull case. Q1 Earnings Season is proceeding more or less as expected. While it is still early in the reporting period (15% of the index reported) the EPS beat rate is above average, and the sales beat rate is below average. EPS estimates have shaken off the recent growth scare and they are growing again, indicating fundamental momentum.

Equally important is the market reaction to earnings reports. Beats are rising more than average, and misses are declining in line with historical averages. This is what we would expect in a “normal” market.
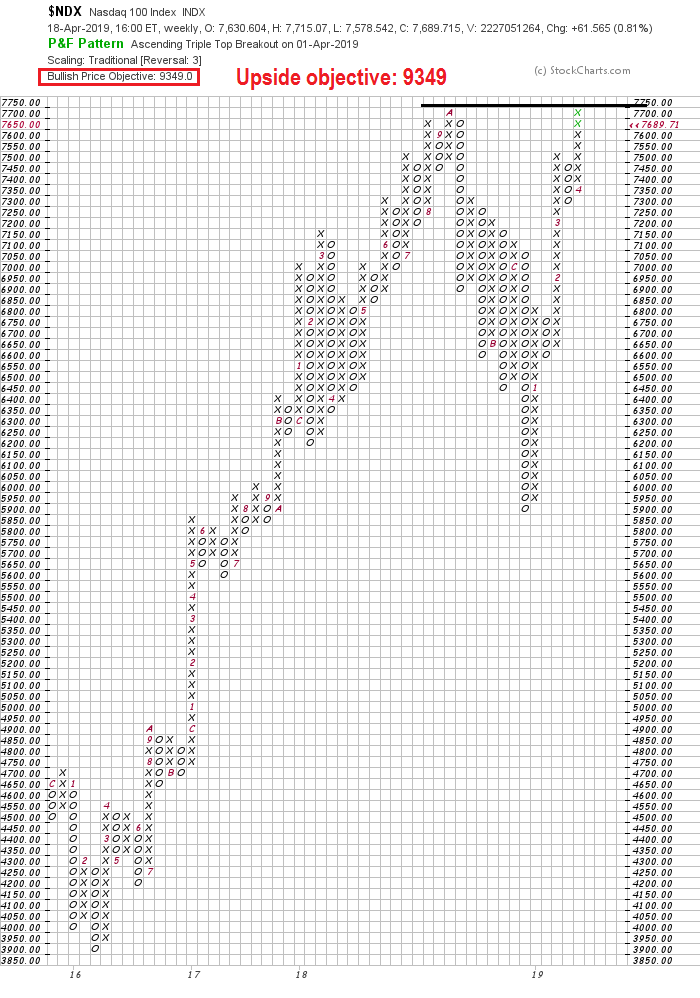
The NASDAQ 100 broke out to an all-time high last week, and the most bullish thing any stock or index can do is to rise to a fresh high. If the breakout holds, the point and figure measured target is 9349, which represents an upside potential of 22% from current levels.
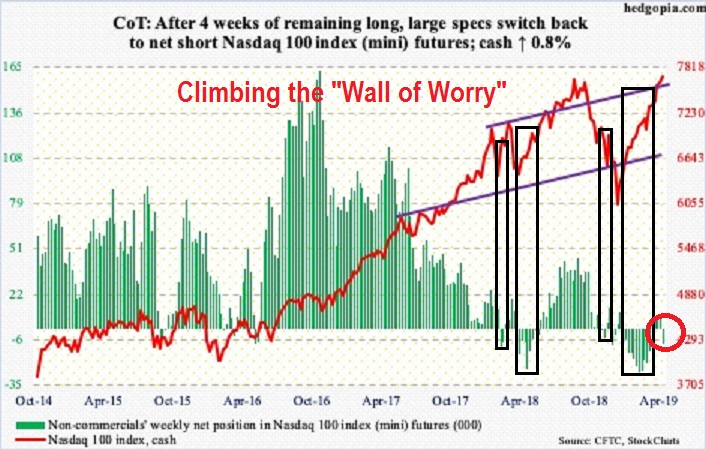
One data point that is supportive of further gains in the NASDAQ 100 is the behavior of large futures speculators. Even as the index tested and eventually broke out to new highs, large speculators (read: hedge funds) sold and moved to a net short position in NDX futures (via Hedgopia).
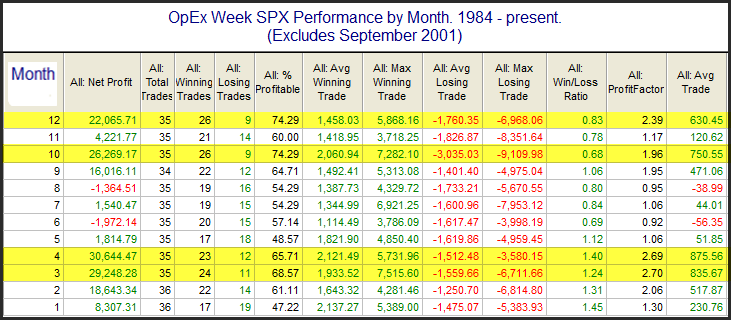
Last week, I highlighted a study by Rob Hanna of Quantifiable Edges indicating positive seasonal tailwinds from option expiry (OpEx) week. In the past, April OpEx week has been one of the most bullish OpEx weeks of the year. Unfortunately, the market did not follow the script and the S&P 500 fell -0.1% on the week.
My own study of April post-OpEx week since 1990 revealed a strong mean reversion effect. If the previous OpEx week was positive (green bars), the market tended to struggle the week after, but if OpEx week was negative (red bars), cumulative returns were strong. (Note that the chart depicts median cumulative returns and not individual daily returns).
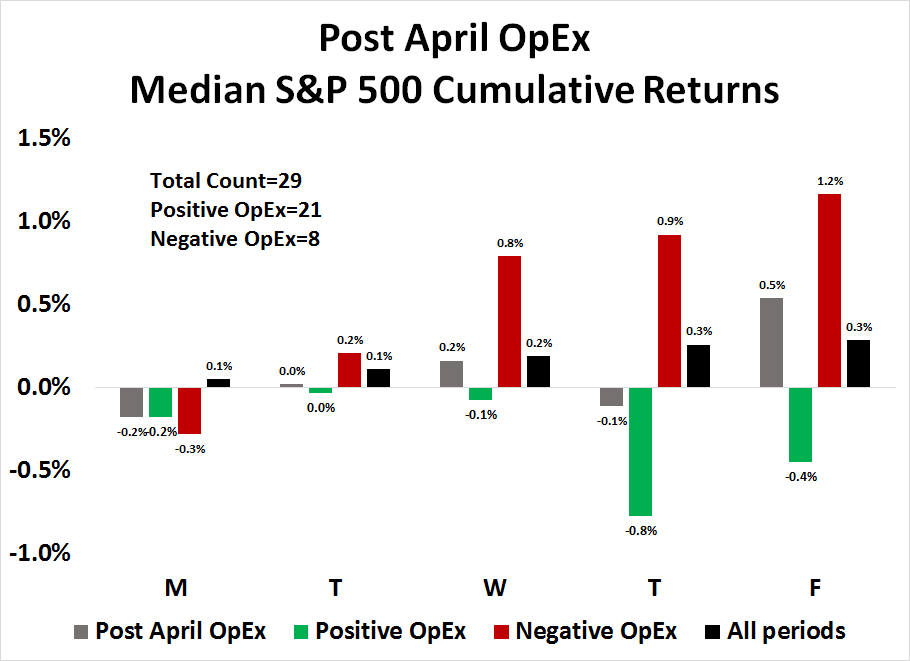
Here is the analysis for % positive during April post-OpEx week. While Monday tended to be weak, the market was 100% by Thursday and Friday, though the sample size is relatively small (N=8).

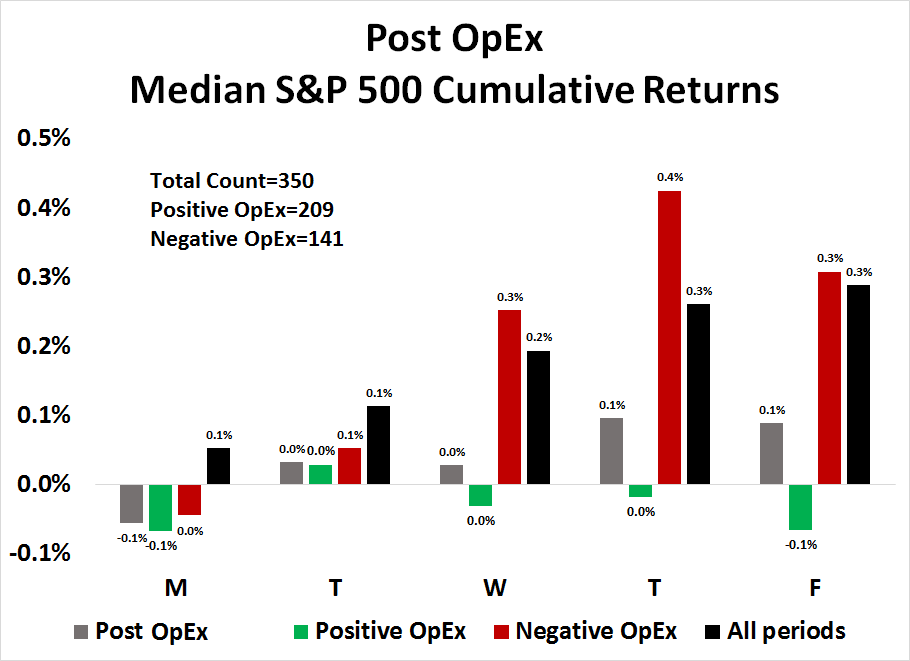
As the sample size for April post-OpEx was small, here is the same study for all post-OpEx weeks. The pattern is similar, with weak Mondays and a strong mean reversion effect for the remainder of the week.
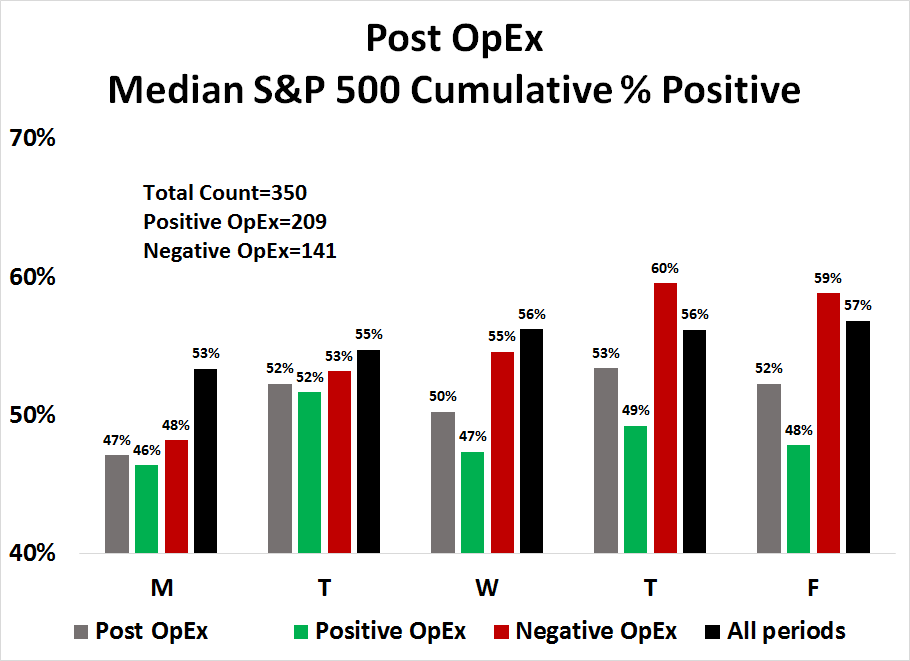
The statistics for % positive tell a similar story.
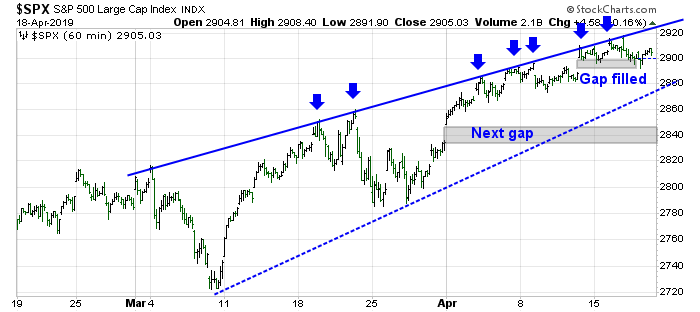
From a tactical perspective the hourly chart looks constructive for the bulls into next week. The market has exhibited a pattern of slowly rising with a series of tests of the ascending trend line. It filled a gap at 2890-2900, but the bulls were able to rally market and the index closed above the upper gap at 2900. Should the market weaken, the gap at 2835-2850 would likely get filled.
My inner investor is bullish and overweight equities relative to his target equity weight. My inner trader is also long and bullish.
Disclosure: Long SPXL
Hi Cam:
Thank you for the great analysis Cam. It’s really one of the best reports I ever subscribed to.
Do you have any thoughts on the TSX making a new all time closing high? Almost at the same time, the monthly MACD triggered a buy signal on TSX. Really impressed that TSX made a new high before S&P.
The TSX upside breakout is encouraging, but you need a magnifying glass to really see it. I am inclined to wait for confirmation of additional strength before getting really excited.
Thanks for the comments. If we look at XIU charts the breakout is more significant with a relatively higher dividend rate for TSX.
I have a potion money that I don’t want to switch to USD so will wait and slowly roll into some Canadian ETFs.
http://www.convexitymaven.com/images/Convexity_Maven_-_A_Guide_for_the_Perplexed.pdf This alink to a recent article by my friend Harley Bassman.
Thanks Barton. Great article.
Thanks, for the link. Interesting a timely read.
This is a perfect time in the markets to talk about my favorite subject MOMENTUM-STYLE INVESTING.
Momentum works because when a new happening kick-starts some sector it take a long time to fully reflect the new happening. As prices go up, investors look back at recent bargain prices and hesitate to buy. This is called Anchoring Bias by behavioral economists. People anchor on recent prices rather than new values. It’s also easier to sell a stock that’s gone up that to buy it. Therefore it takes a long time to get where it’s going.
The massively important change by the Fed Chief Powell’s interest rate policy at the turn of the year was a new happening that will be an extremely positive factor for many years.
Stock markets rightly took off from the low and went straight up. A reader of this blog contacted me about becoming a client. Among other things, he saw that I had called the December low an important low with a new bull market started. But he asked if I would be investing his portfolio at the January 17th high prices if he sent me his money. I said yes and he thought that was not the right answer and stopped the process.
If you look on the above charts at the January 17th price now, it looks like a big bargain. But at that time it seemed so risky compared to December 24th prices.
The other thing at work at the start of a new trend with new fundamentals is that our minds are still in the previous narrative. When we look back at mid-January, it seems obvious now that the new interest rate outlook was extremely bullish. But we were still fresh from a massive crash where investor sentiment (that’s all of us) was in the pits. We weren’t sure about this new Powell factor.
With this knowledge of human biases, I’ve learned to put my reservations aside and buy (or sell if the happening is negative) at whatever the going price is when the new information is extremely important enough to change a trend. I do this even though I’m also nervous and anchoring like everyone else. I’ve found the more nervous I am, the better the outcomes after I make the plunge. I intellectually expect the trend to be in place for a long time and at the end of it, late comers will be piling in to push things beyond correct value. That by the way is called herding Bias.
Am I saying to buy the market now, no. I’m just saying it’s a good time to learn about behavioral economics in general and momentum investing in particular.
The momentum trend is up because of the new Powell Put. Happy investing.
Ken, Thanks for sharing your thoughts.
=> The massively important change by the Fed Chief Powell’s interest rate policy at the turn of the year was a new happening that will be an extremely positive factor for many years.
Do you expect the Fed to stay put for many years to come? As the growth improves in coming quarters, won’t the Fed re-consider the interest rate and QT policies? Or, do you think the Fed is unlikely to do 180 again on policies again just a few quarters after the last one (behavior biases Consistency, Commitment and Avoiding looking foolish in the public)?
Read ConvexityMaven. The whole Fed “policy” is a bunch of baloney. The Fed will do whatever is required to keep off deflation, and keep asset prices afloat, until one day the system spins out of control.
I sound like a cynical person, but look at what the Fed did. It made a policy mistake, that tanked the market by 20%, and sure enough, it made an about turn. What a joke.
Read ConvexityMaven article posted above. The massive over investment in BBB rated scrips is a warning, that something beneath is rotting.
A strengthening $ will be an indicator of a credit squeeze and hurt the Credit market. I remain puzzled how/why one should be long the market (unless the Fed drops rates).
Sanjay, what we can conclude is that for the first time in history the Fed has added a new leg to its policy decisions: the stock market. Before it was a dual mandate; inflation and full employment.
This lowers future risk for stock markets.
But there is a fly in the ointment as my mother used to say. Minsky, the great economist, discovered that low risk eventually leads to a high volatility crash now called a “Minsky Moment.”
This is simply that predictable low volatility/risk leads investors to gain confidence and create a bubble that gets to absurd overvalued levels and then crashes.
The Powell Fed Put along with the Trump stock market cheer-leading and possibly a left-leaning Democratic MMT spending spree, will likely lead to a massive stock market bubble that will pop in a “Minsky Moment.”
Enjoy the ride until then.
Ken and D.V., thank you both.
Ken,
what’s the best way to get in touch? Mine is la.dong@gmail.com
I am keen to learn further about your momentum style investing.
Cheers
Too many cross currents/signals in this article. Low volatility is something to be wary of, agree. Should one be long in the market despite the low volatility?
A dollar ‘spike’ may been around the corner, which is usually, asset bearish. So should one be long?
Dumb money is over confident. Should one batten the hatches and cut on long exposure?
Lots of signals to be wary here. Puzzled at long exposure that Cam concludes.