Preface: Explaining our market timing models
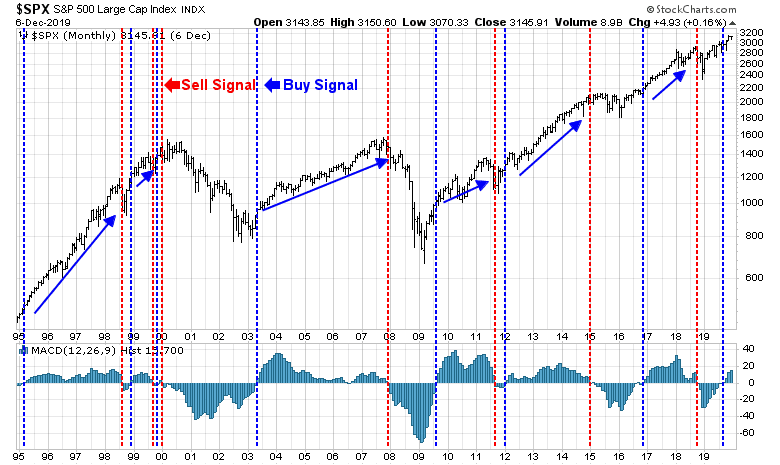
We maintain several market timing models, each with differing time horizons. The “Ultimate Market Timing Model” is a long-term market timing model based on the research outlined in our post, Building the ultimate market timing model. This model tends to generate only a handful of signals each decade.
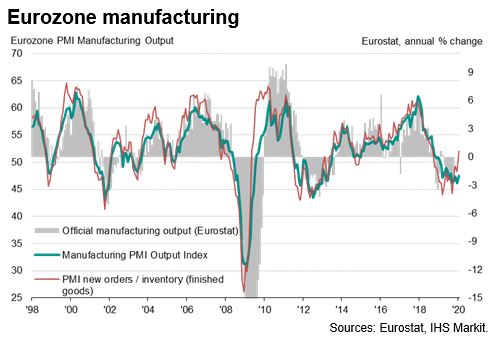
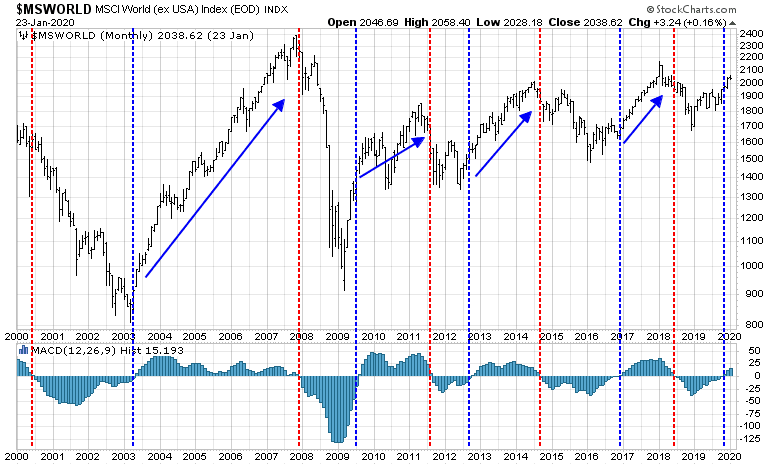
The Trend Asset Allocation Model is an asset allocation model which applies trend following principles based on the inputs of global stock and commodity price. This model has a shorter time horizon and tends to turn over about 4-6 times a year. In essence, it seeks to answer the question, “Is the trend in the global economy expansion (bullish) or contraction (bearish)?”
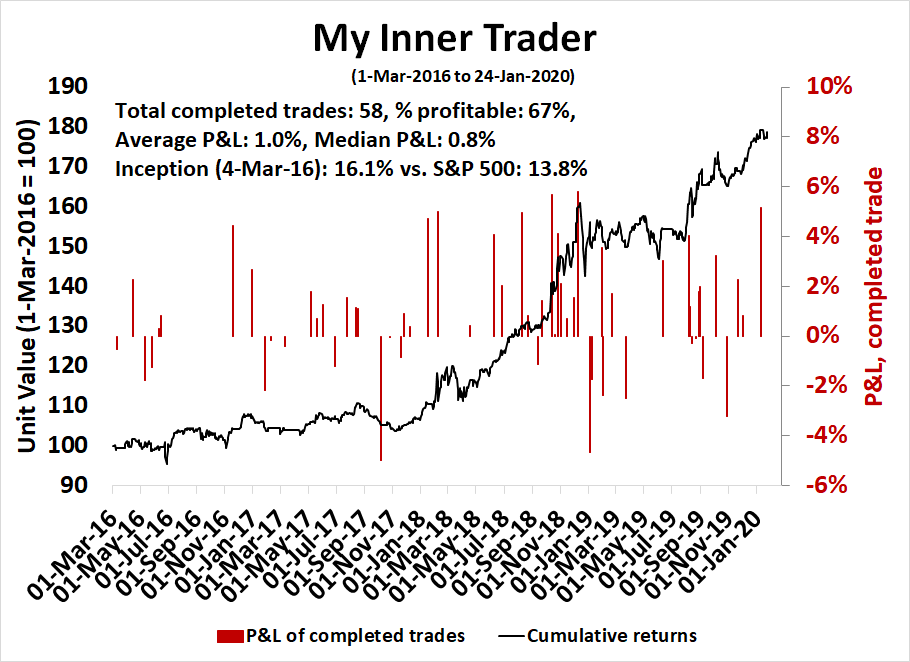
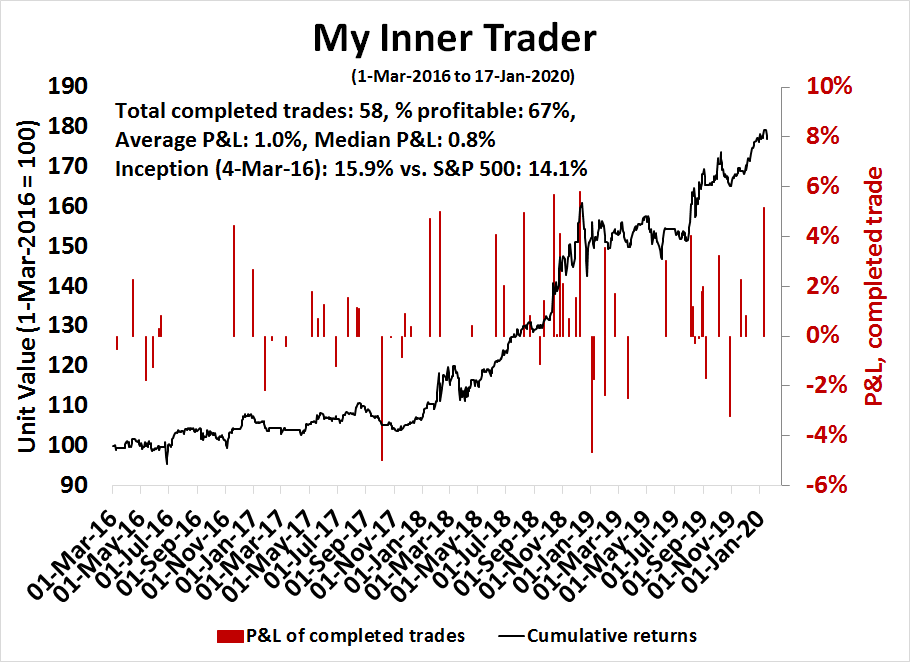
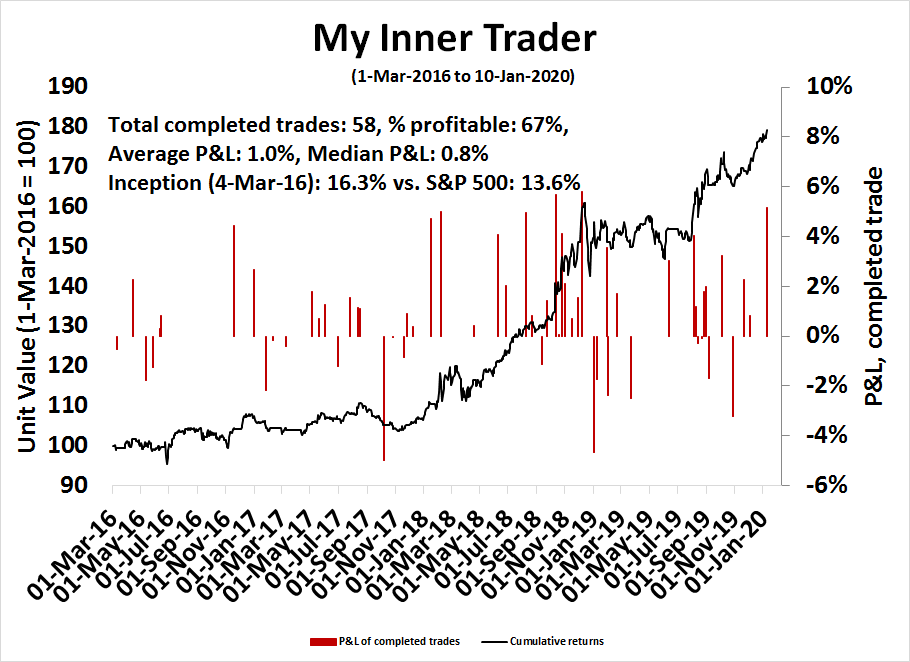
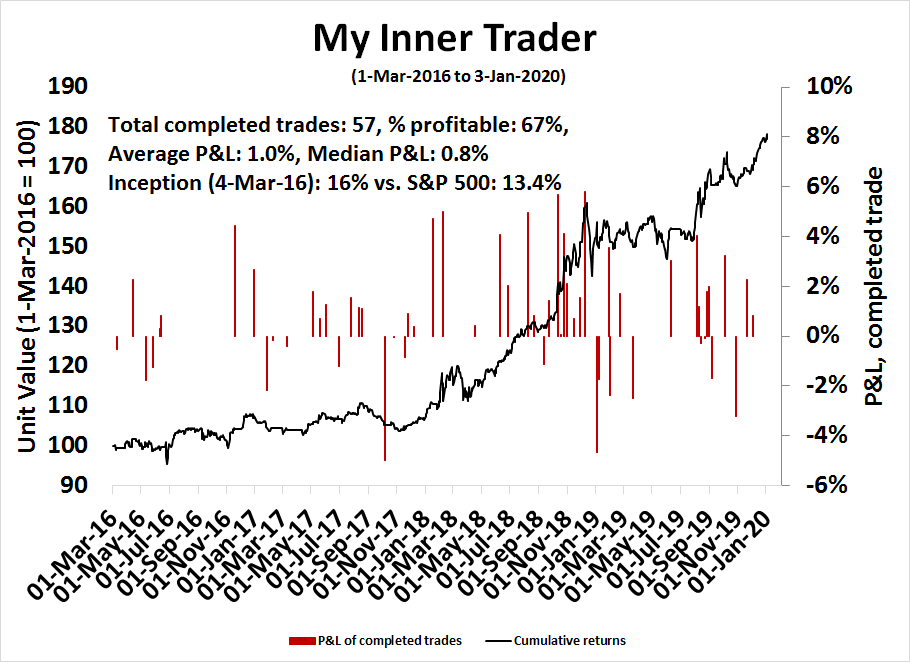
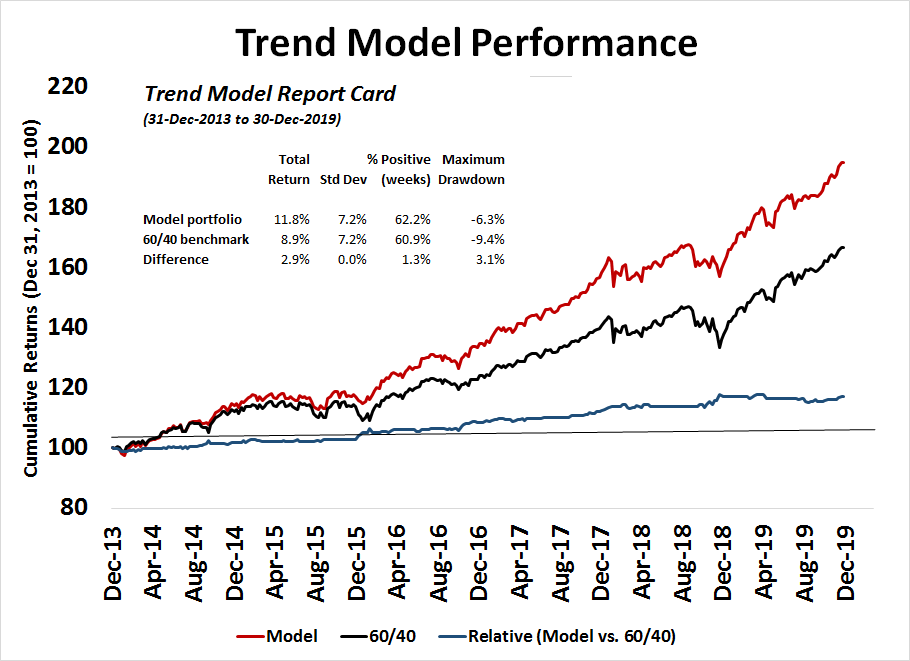
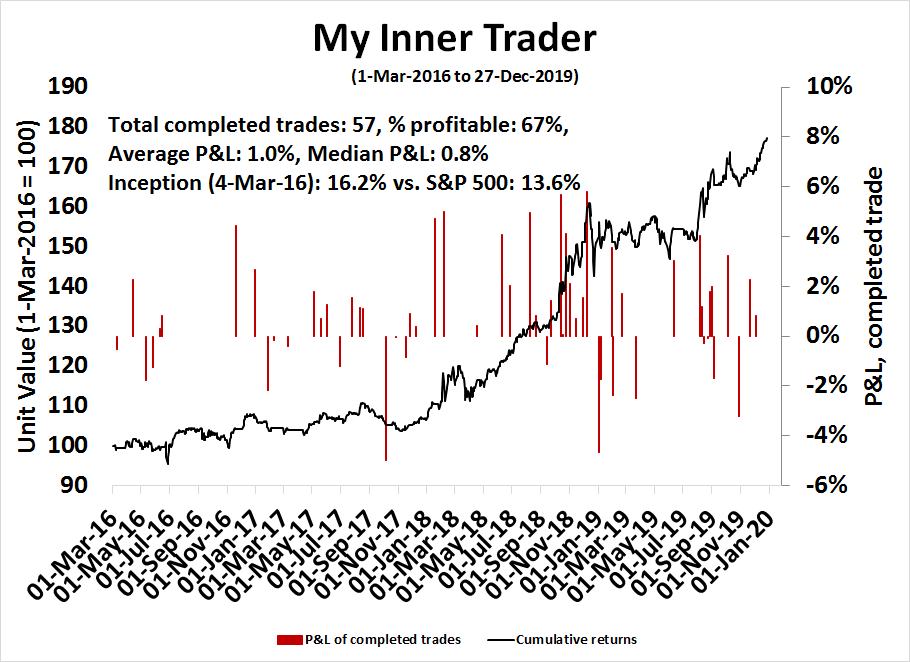
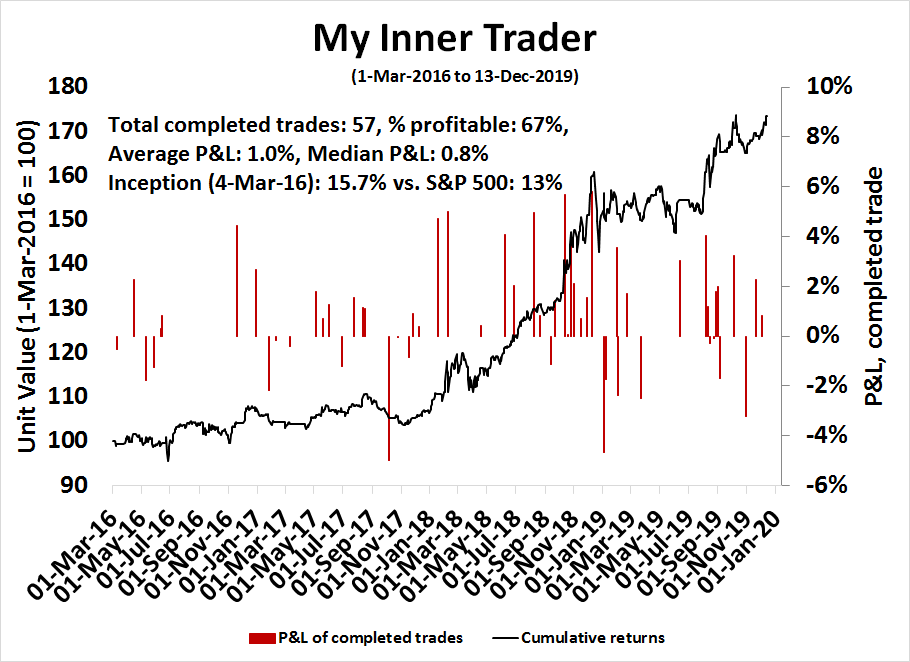
My inner trader uses a trading model, which is a blend of price momentum (is the Trend Model becoming more bullish, or bearish?) and overbought/oversold extremes (don’t buy if the trend is overbought, and vice versa). Subscribers receive real-time alerts of model changes, and a hypothetical trading record of the those email alerts are updated weekly here. The hypothetical trading record of the trading model of the real-time alerts that began in March 2016 is shown below.
The latest signals of each model are as follows:
- Ultimate market timing model: Buy equities
- Trend Model signal: Bullish
- Trading model: Bullish
Update schedule: I generally update model readings on my site on weekends and tweet mid-week observations at @humblestudent. Subscribers receive real-time alerts of trading model changes, and a hypothetical trading record of the those email alerts is shown here.
Defining the China threat to America
‘Tis the season for strategists to publish their year-end forecasts for 2020. Instead of participating in that ritual, this is the first of a series of think pieces of what might lie ahead for the new decade. We begin with the difficult challenge of Sino-American relations.
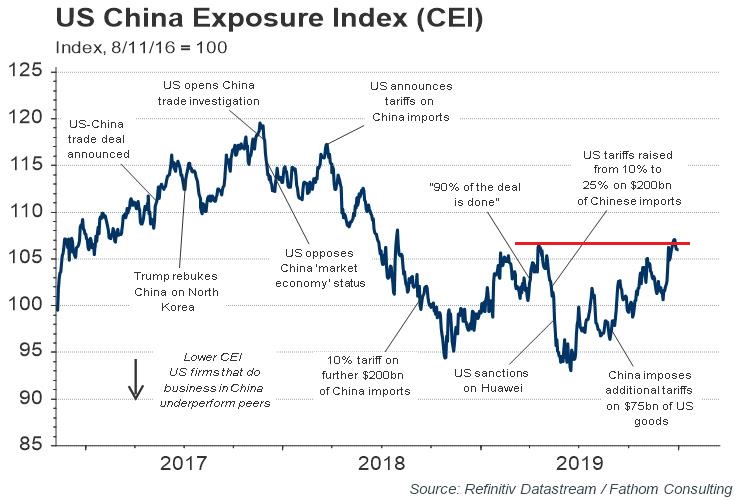
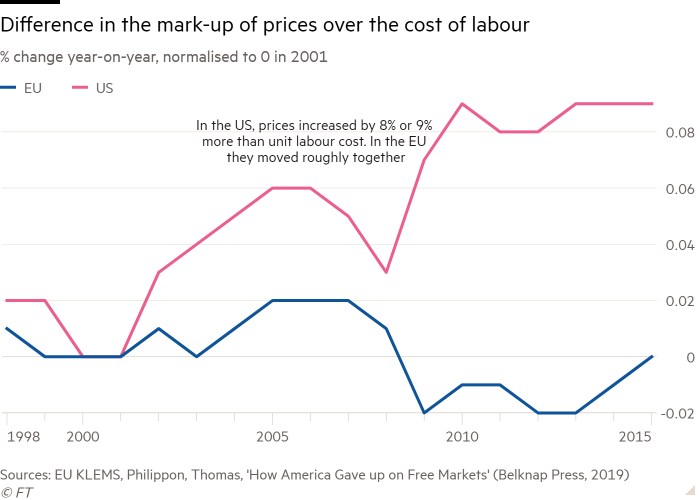
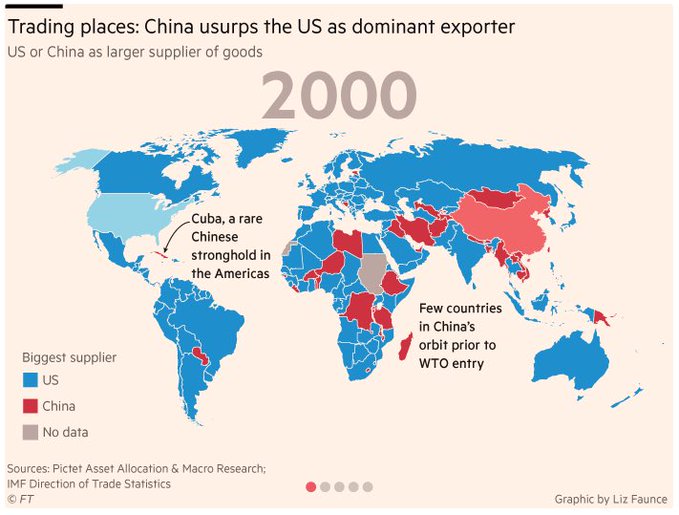
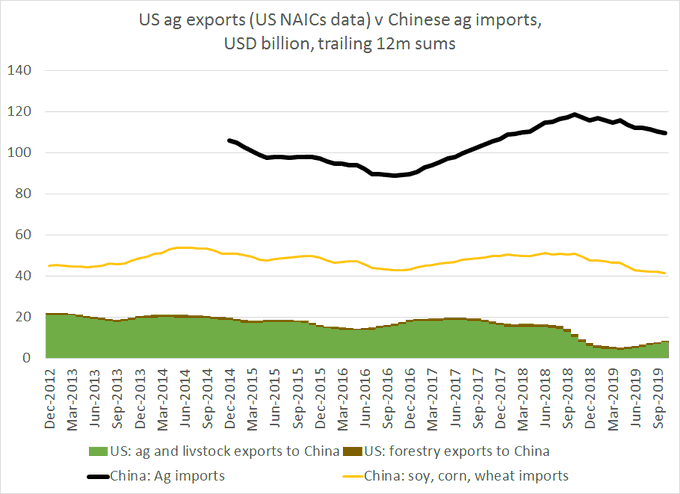
What is the nature of the Chinese threat to America? On the surface, it is the threat of the emergence of a new economic power, as illustrated by the FT (h/t Liz Ann Sonders). As recently as the year 2000, the US was the dominant global exporter.
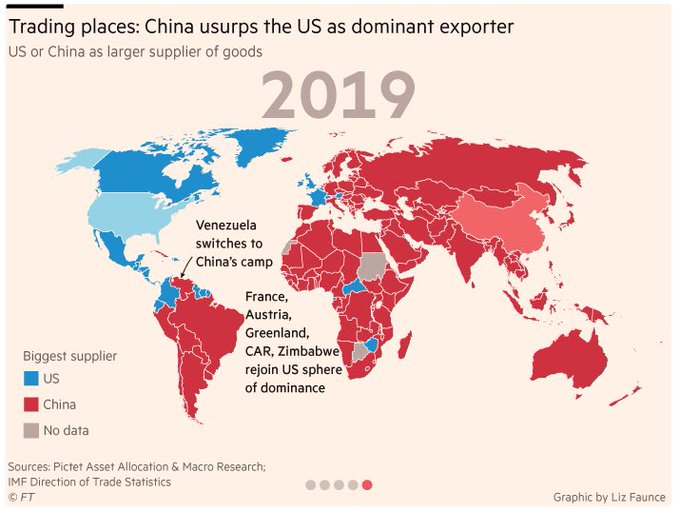
Fast forward to 2019, China is ascendant, and America is in retreat.
Evan Feigenbaum had a more nuanced explanation of the issues in a half-hour interview.
From a geopolitical viewpoint, Feigenbaum made the point that China is a revisionist power, but it is not a revolutionary power like the Soviet Union, which tried to export its revolution around the world. As an example, China set up the Asian Infrastructure Investment Bank (AIIB) in parallel to the Asian Development Bank (ADB). But it’s also the third largest shareholder in the ADB. It’s also a major contributor to the IMF and World Bank. This shows that it is trying to become a regional power, and it is trying to mold global institutions in its own image, but it is not being disruptive in the same way as the Soviet Union.
Feigenbaum concluded that China is a major economy, and it is here to stay. This matters to American policy. It’s not useful to try to bury one’s head in the sand and force China to decouple. American policy makers have to be more adaptive rather than trying to rewind the clock to the 1950s and 1960s eras of Pax Americana.
What decoupling means
Even as the US-China trade talks remain unresolved, there is a growing consensus that, in the longer term, the two economies are going to decouple. Do you want to know what decoupling looks like? The Financial Times reported that the Party has ordered the removal of all foreign hardware and software from government offices in three years. The policy has been called “3-5-2” because replacement will occur at a rate of 30% in 2020, 50% in 2021, and 20% in 2022.
In addition, initiatives such as the PBOC’s definition of credit card encryption standards, which is incompatible to the ones used by VISA and MasterCard, but used only by state-owned Union Pay, is just one example that could split the global financial system.
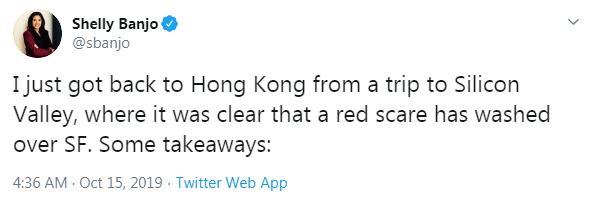
Bloomberg reporter Shelly Banjo showed the way in a Twitter thread.
Banjo continued:
Some tech execs openly worrying that China’s approach to censorship and authoritarianism is bleeding into the U.S., posing a severe threat to America
Bankers confused around working on financing for companies that could be blacklisted by US
VC funds not taking money from Chinese GPs or in some cases, LPs, asking folks for copies of passports to prove US citizenship
Startups wondering what happened to the the Silicon Valley outposts of China’s Tencent, Alibaba and Baidu, which have all gone dark
Despite claims of China’s tech prowess, met with Chinese developers, scientists and students who won’t leave the US to go back to China. They want to keep research in the US, even if they are working for Chinese companies
And all of these meetings came on the backdrop of the NBA’s decision to kowtow to China, underscoring the question — what should American companies do? What are the wider implications of this?
Do you keep the wait and see attitude and keep tiptoeing in or near China with the hopes that one day things will change? Or do you call it quits and leave? I just don’t feel like waiting is a viable strategy anymore
I think you either have to call it quits or you commit and say, hey, we’re a company and our goal is profits for shareholders so we don’t care to claim a moral high ground and will fully embrace the China line.
The other worrying factor was how much China-bashing I found bordered on racism, causing the US to create this sense of other and retreat deeper inward. As a Chinese scientist, inventor, technologist, how does that make you feel?
The US National Security Strategy of 2017 made a little noticed pivot by branding China a strategic competitor. Ever since that document was published, US strategy has been focused on containing China`s rise, not just from an economic viewpoint, but on a variety of other geopolitical dimensions as well.
This paradigm shift is leading the world into a possible Thucydides’ Trap, where existing Great Powers is unable to accommodate the rise of a new Power, leading to competition, and eventually a catastrophic war. While the gloomy Thucydides’ Trap thesis explained the First World War, where European Powers was unable to cope with a newly industrialized Germany, wars are not necessarily a foregone conclusion. The West was able to deal with the rise of the Soviet Union through a containment policy after the Second World War without triggering a Third World War.
During the Vietnam War, Mao branded the US as a paper tiger. I would argue that the appearance of the Chinese threat to the US is another paper tiger, as long as the relationship is managed properly. War is not always the end result.
Policy options: Rsponding to the Chinese threat
There are two ways to deal with the growth of Chinese influence in the world. America can either by itself, or enlist the help of allies, to counter Chinese geopolitical creep, and take advantage of China’s missteps and overreach.
The US need to take advantage of China’s missteps in extending its influence, and step into a leadership role by enlisting allies to contain China. Consider this Drew Thompson OpEd in the SCMP, “From Singapore to Sweden, China’s overbearing campaign for influence is forcing countries to resist and recalibrate relations with Beijing”:
China’s campaigns range from overt diplomacy and public messaging disseminated through propaganda organs, to covert cyber exercises by specialised hackers and the “50-cent trolls” on social networking sites.
Its capabilities are built into the government’s vast propaganda apparatus, including the People’s Liberation Army, intelligence departments, and the foreign education and culture ministries.
The influence mission is integral to the Communist Party, most notably in the United Front Work Department, which is responsible for engaging intellectuals, including overseas and ethnic Chinese.
The elevation and rejuvenation of the United Front, and the formation of a Leading Small Group chaired by President Xi Jinping to oversee its work, has increased its bureaucratic capacity to extend China’s influence over ethnic and overseas Chinese populations.
China has made a number of mistakes in extending its political reach:
The United Front’s efforts are clearly being felt in countries with large Chinese diaspora populations, such as Australia and Canada. Pro-China “patriotic” demonstrations and the destruction of Lennon Walls in Canada are worrying Canadians that a globally assertive and nationalistic China is impinging on Canadians’ rights.
A recent poll found that less than a third of Canadians have a favourable view of China.
Similar scuffles between pro-Hong Kong and pro-Beijing protesters in Australia have punctuated inappropriate displays of Chinese nationalism on foreign soil, including the raising of a Chinese flag over an Australian police station while the Chinese national anthem was sung.
Public servants paying allegiance to a foreign country is not the manifestation of a healthy bilateral relationship but, literally, a red flag that China’s influence campaign has overreached and is damaging.
Similar instances of geopolitical overreach can be found in Sweden:
Last year, three Chinese tourists claimed they were abused by Swedish police following a dispute over their hostel reservation.
Soon after arriving in Stockholm, Chinese ambassador Gui Congyou embarked on an extensive campaign, accusing Swedish police of brutality even when a video of the incident showed police standing to one side while the tourists prostrated themselves on the pavement.
Gui conducted media interviews and released almost 60 statements criticising Sweden’s commitment to human rights and accusing it of tyranny, arrogance, racism and xenophobia.
Time for the US to re-engage Asia and be a stable counter to China
Faced with this barrage of government-sanctioned accusations, and with public opinion polls showing 70 per cent of Swedes viewing China unfavourably, Sweden announced in February that it was updating its China strategy.
In a memorandum to parliament last month, the government said: “The rise of China is one of the greatest global changes since the fall of the Berlin Wall.”
These fumbled Chinese initiatives open the door for American policy makers to create an alliance to counter growing Chinese political influence around the globe. China has funded a network of Confucius Institutes around the world to spread Chinese culture, to monitor the activities of overseas Chinese students, and to advocate for China’s position, such as the Hong Kong protests and its position on Taiwan, around the world.
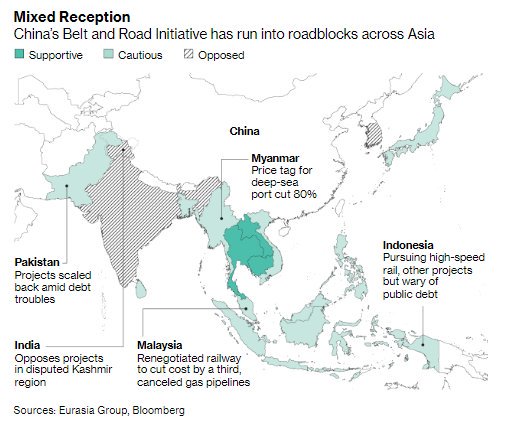
Already, China’s BRI initiative is rubbing a lot of its Asian neighbors the wrong way.
Present with these openings, what is the Trump administration doing? Conducting a bean counter analysis of how much American troops in South Korea costs?
Time as the Great Healer
While Americans are focused on the numerous ways that China represents a threat to US interests, I would argue that the best solution is time. One major source of angst is the China 2025 industrial strategy of aiming for dominance in selected industries and technologies while favoring domestic companies. While talk of China 2025 has disappeared, Beijing has not renounced the principles behind that initiative.
If you are afraid, then does that mean you believe in industrial strategy? If industrial strategy worked, then we would all be admiring the dirigiste French with the long tradition of a strong government control of the economy, and fostering national champions.
Consider, for example, the threat of Chinese AI dominance. An article in New America indicated that China may be in for an “AI winter”:
Last December, China’s top AI scientists gathered in Suzhou for the annual Wu Wenjun AI Science and Technology Award ceremony. They had every reason to expect a feel-good appreciation of China’s accomplishments in AI. Yet the mood was decidedly downbeat.
“After talking about our advantages, everyone mainly wants to talk about the shortcomings of Chinese AI capabilities in the near-term—where are China’s AI weaknesses,” said Li Deyi, the president of the Chinese Association for Artificial Intelligence. The main cause for concern: China’s lack of basic infrastructure for AI.
More than two years after the release of the New Generation Artificial Intelligence Development Plan (AIDP), China’s top AI experts worry that Beijing’s AI push will not live up to the hype. The concern is not just that China might be in for an “AI winter”—a cyclic downturn in AI funding and interest due to overly zealous expectations. It’s also that for all China’s strides in AI, from multi-billion dollar unicorns to a glitzy state plan, it still lacks a solid, independent base in the field’s foundational technologies.
That’s because most of the basic software tools are American:
A brief glance at the infrastructure Chinese developers are using to run their algorithms reveals one reason for concern. The two dominant deep learning frameworks are TensorFlow and PyTorch, developed by Google and Facebook, respectively. A “framework” is essentially a set of programming shortcuts that makes it simpler for researchers and engineers to design, train, and experiment with AI models. Most AI research and deployment uses one framework or another, because frameworks make it possible to use common deep learning concepts (such as certain types of hidden layers or activation functions) without directly implementing the relevant math.
While Chinese alternatives to TensorFlow and PyTorch exist, they have struggled to gain ground. Baidu’s PaddlePaddle scarcely appears in either English- or Chinese-language listicles of top framework comparisons. Although it’s difficult to find reliable and up-to-date usage statistics, various informal indicators all point to a large discrepancy in usage. According to Github activity, Baidu’s PaddlePaddle trails PyTorch and TensorFlow by a factor of 3–10 on various statistics. In one Zhihu thread on comparing frameworks, only one user stood up for PaddlePaddle—the PaddlePaddle official account.
The same story goes for AI hardware:
When it comes to AI hardware, the outlook is equally troubling for China. Despite buzz in venture capital circles about Chinese AI chip startups like Cambricon and Horizon Robotics, Chinese AI developers continue to rely heavily on western hardware to train their neural networks. This is because Chinese AI chips have so far largely been confined to “inference,” or running existing neural network models. In order to “train” those neural nets in the first place, researchers need high-performance, specialized hardware. Unlike most computational tasks, training a neural network requires massive numbers of calculations to be performed in parallel. To accomplish this, AI researchers around the world rely heavily on graphics processing units (GPUs) that are mainly produced by U.S. semiconductor company Nvidia.
Originally designed for computer graphics, the parallel structure of GPUs has made them convenient platforms for training neural networks. SenseTime’s supercomputing center DeepLink, for instance, is built on a staggering 14,000 GPUs. However, GPUs are not the only hardware platform that can train neural nets. Several chips including Google’s Tensor Processing Unit (TPU) and field-programmable gate arrays (FPGAs) from companies like Intel and Xilinx will likely reduce the importance of Nvidia GPUs over time. Notably, none of these competitors to the GPU are Chinese.
Why are there no Chinese competitors challenging the GPU’s reign? The answer, according to Sun Yongjie, a notable tech blogger in China, is that Chinese AI chips are created for “secondary development or optimization” rather than replicating fundamental innovations.
Force China to decouple, then you force them to build their own infrastructure, instead of remaining integrated with Western researchers.
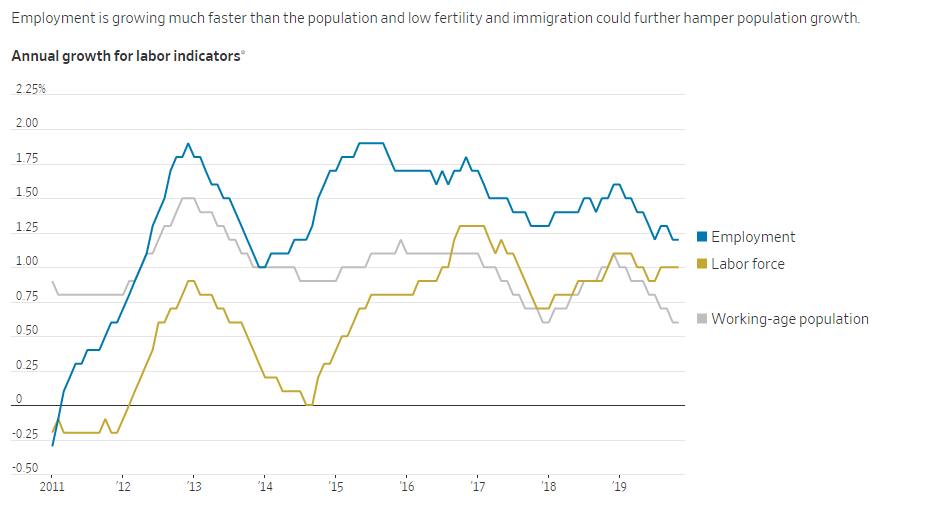
Demographic headwinds
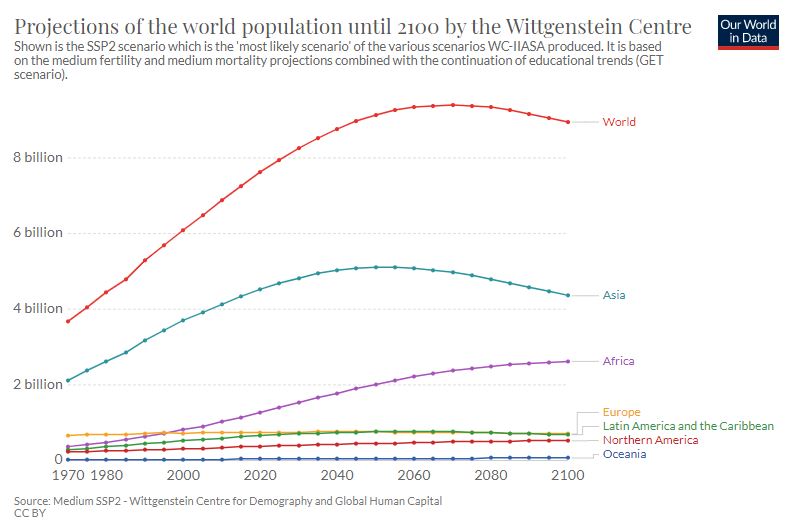
Another headwind that China faces is demographics. The Economist observed China is about to get old before it gets rich.
The coming year will see an inauspicious milestone. The median age of Chinese citizens will overtake that of Americans in 2020, according to UN projections (see chart). Yet China is still far poorer, its median income barely a quarter of America’s. A much-discussed fear—that China will get old before it gets rich—is no longer a theoretical possibility but fast becoming reality.
This table from China watcher Michael Pettis tells the Chinese demographics story in an even more dramatic way. By 2050 China’s population will be 4% lower than today, while it’s working-age population will have declined by 12%.
China’s population may even age faster than these projections. These estimates are based on the standard assumption that the fertility rate rises from the current rate of 1.6 to 1.7-1.8 live births per woman. New estimates from The Economist’s Economic Intelligence Unit the fertility rate is far lower than initially thought, and “peak population comes four years sooner that the UN’s baseline ‘medium-fertility’ variant”.
A pivot to state control
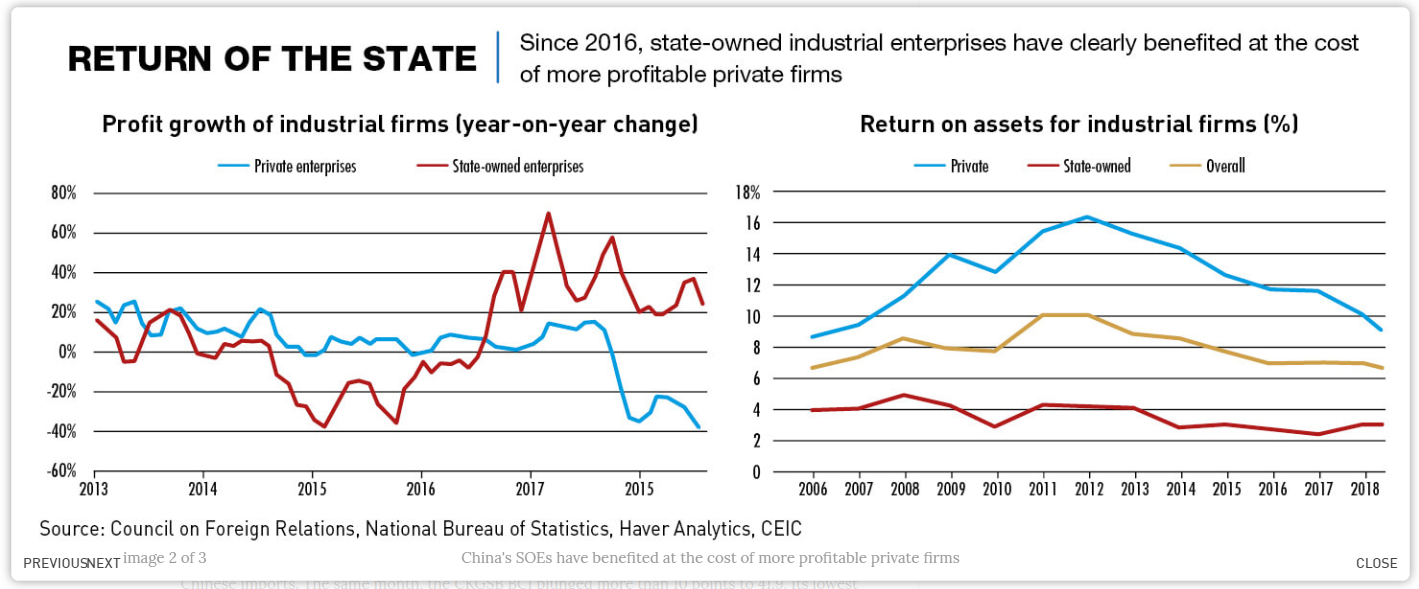
Another threat to Chinese dominance is Xi Jinping’s pivot to greater Party control of the economy. Instead of Deng Xiaoping’s “it is indeed glorious to be rich” philosophy that unleashed the power of private enterprise that have led to China’s ascent, Xi has asserted power and tightened the State’s grip on the economy. Consequently, SOE profitability has grown at the expense of the privately owned SMEs. But the ROAs of SOEs continue to lag SMEs. Moreover, this policy pivot has stopped the development of an independent judicial system and enforcement of property rights in favor of Party control. In addition, senior SOE managers wear the dual hats as Party committee members and corporate executives, which complicates corporate governance issues. This has the potential to either lead to a capital strike, or capital flight. If China, Inc. is the combination of SOEs and SMEs, then expect its competitive position to erode over the course of the next decade.

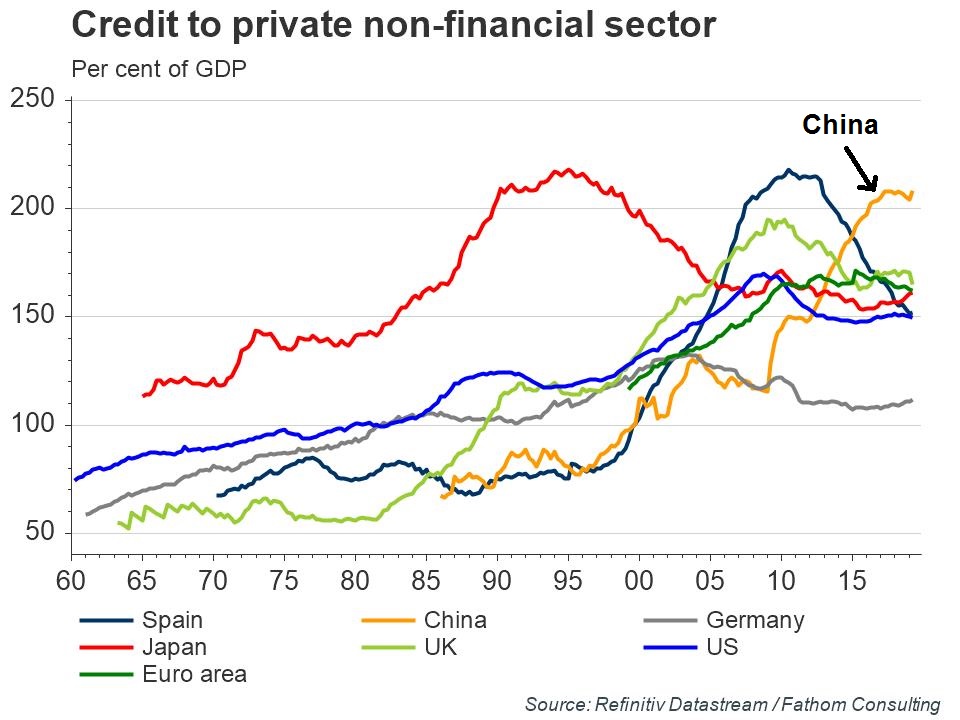
China will also have eventually deal with their mountain of debt. As a reminder, this is the China bears’ favorite chart.
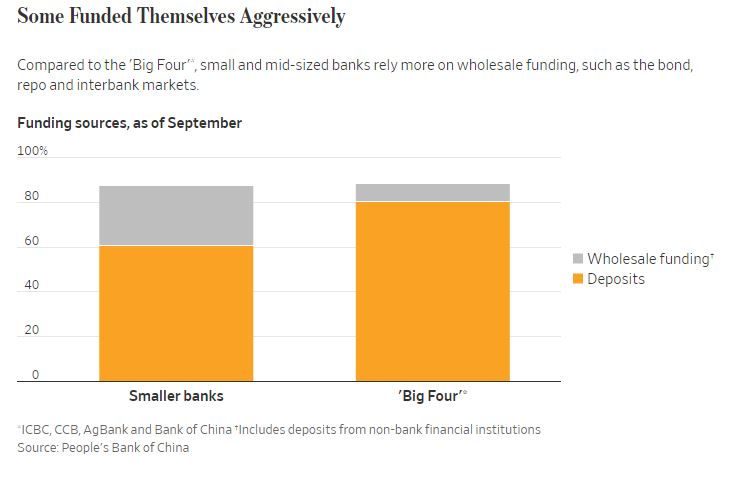
A recent WSJ article highlighted some of the woes of the Chinese banking system, much of which are concentrated in the smaller banks. During China’s hyper-growth period, there have been thousands of smaller local banks controlled by local politicians that were being used for their pet projects. These banks relied much more on wholesale funding than on retail deposits. If it were not for the implicit government guarantees, many of these small local banks would have collapsed a long time ago. Beijing’s preferred solution is to merge the bad banks, as they appear, with stronger large banks. But this sets up a Japanese 1990’s problem of bank zombification – which was the catalyst for the start of Japan’s Lost Decades.
The climate change threat
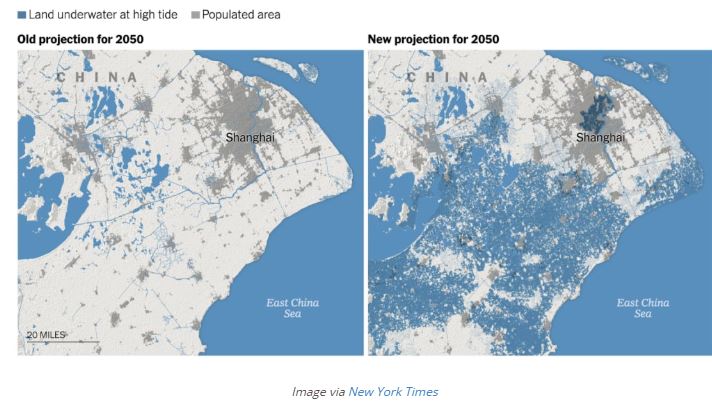
Another potential threat to the Chinese growth engine may come from climate change. A new study published in Nature Communications revealed that a new study indicates rising sea levels from climate change means the coastlines are three times more exposed than previously thought, and China accounts for 15-28% of the total population threatened by rising sea levels, Especially at risk is Pearl River Delta (Guangzhou and Shenzhen) and Shanghai. These models project that most of Shanghai may be under water by 2050.
Key risk: American isolationism
In summary, I have made the case that the Chinese economic threat is mostly a paper tiger, and Chinese growth is likely to converge to developed market levels by the end of the 2020s. How the world manages that transition will be key to sustaining global growth and geopolitical stability over the next decade.
The biggest threat to the stability of the global economic order is American isolationism.
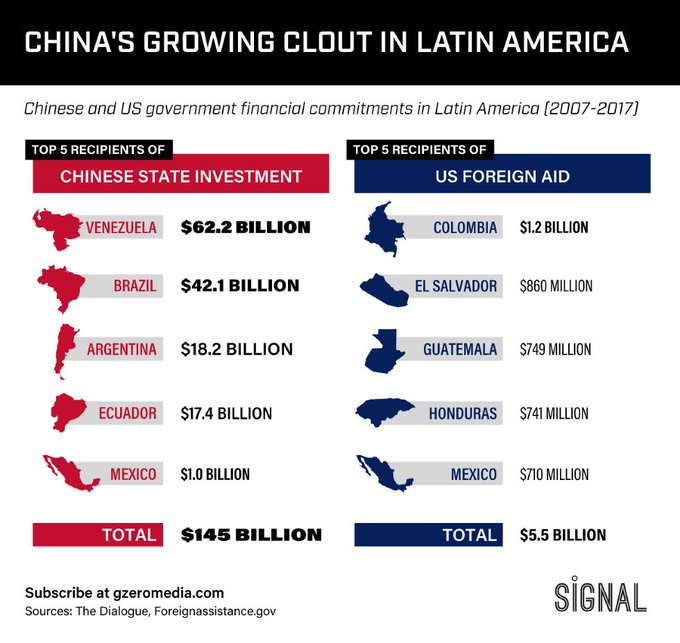
Even if American policy makers wanted to contain China’s rise, unilateralism and a singular focus on trade is precisely the wrong way to do it. Ian Bremmer of GZERO Media pointed out that China has invested an order of magnitude more in Latin America than the United States. In light of Trump’s isolationist bent, and transactional approach to foreign policy, it may not be long before someone asks, “Who lost Brazil, or Mexico, and so on?”
More importantly, will someone ask, “Who lost South Korea?” Yahoo Finance recently reported that China and South Korea signed a defense agreement in the wake of American demands on Seoul to pay for US troops:
The defence ministers of South Korea and China have agreed to develop their security ties to ensure stability in north-east Asia, the latest indication that Washington’s long-standing alliances in the region are fraying.
On the sidelines of regional security talks in Bangkok on Sunday, Jeong Kyeong-doo, the South Korean minister of defence, and his Chinese counterpart, Wei Fenghe, agreed to set up more military hotlines and to push ahead with a visit by Mr Jeong to China next year to “foster bilateral exchanges and cooperation in defence”, South Korea’s defence ministry said.
Seoul’s announcement coincided with growing resentment at the $5 billion (£3.9bn) annual fee that Washington is demanding to keep 28,500 US troops in South Korea.
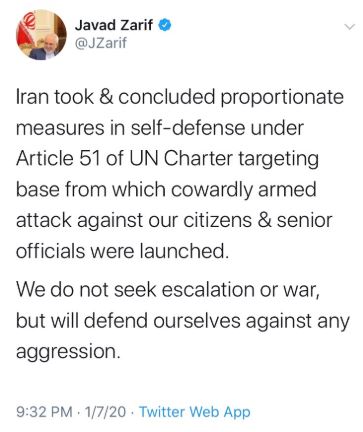
These American fumbles have created a geopolitical opening for the Chinese. The SCMP reported that former Chinese trade negotiator Long Yongtu said that China would prefer Trump to be re-elected, because he is so easy to read:
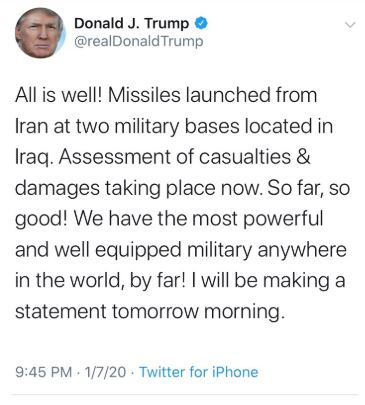
The US president’s daily Twitter posts broadcast his every impulse, delight and peeve to 67 million followers around the world, making him “easy to read” and “the best choice in an opponent for negotiations,” said Long Yongtu, the former vice-minister of foreign trade and point man during China’s 15-year talks to join the WTO nearly two decades ago.
“We want Trump to be re-elected; we would be glad to see that happen,” Long said during Credit Suisse’s China Investment Conference yesterday in Shenzhen.
Long, who turned 76 in March, has retired from active ministerial posts and doesn’t speak for China’s government in matters concerning the domestic affairs of other countries. But the comment from someone considered the elder statesman of China’s trade diplomacy does offer a hint of the thinking in Beijing’s policymaking circle, as officials grapple with how best to handle the bruising trade war between the two largest economies on Earth.
Despite his fickleness, Trump is a transparent and realistic negotiator who is concerned only with material interests such as forcing China to import more American products, on which Beijing is able to compromise, Long said. Unlike his predecessors, Trump does not pick fights with China on hot-button geopolitical issues such as Taiwan or Hong Kong, where Beijing has little room to manoeuvre, said Long, who now heads the Centre for China and Globalisation, a Beijing-based think tank.
“Trump talks about material interests, not politics,” Long said in an interview with South China Morning Post in Shenzhen. “Such an opponent is the best choice for negotiations.”
While the US is distracted on trade, China could increase its geopolitical reach in Asia and the rest of the world. Already, Trump is visibly abandoning the US leadership global position, and leaving a vacuum for another Great Power to step in. Here are two examples, Japan and South Korea, two key US allies in Asia, are engaged in a very visible trade spat, The US has stepped aside from the dispute, and China has moved in to try and mediate. In addition, the PLA Navy engaged in joint naval exercises with Saudi Arabia. As America retreats from its role as superpower, China moves in.
In effect, American policy is at risk of falling into the Kindleberger trap, as explained by this article in The Diplomat:
Professor Joseph Nye Jr. raised an important new concept of the “Kindleberger trap” weeks ago. It follows late MIT professor Charles Kindleberger’s classical arguments that the Great Depression in the 1930s was caused by the shortage of global public goods provision when the isolationist United States refrained from assuming the responsibility while the Great Britain lost its capability to play the role. Nye thus cautions the American leaders to be wary of a China that seems to be too weak to take international responsibility rather than too strong as the now popular concept “Thucydides Trap” implies.
This new warning deserves close attention. It reminds us that global order cannot function efficiently without sufficient public goods provision from powerful states. However, we must also note that the reality today also diverges significantly from the 1930s. In fact, the actual challenge now is not that the established power has lost its capability while the rising power is unwilling to assume responsibility. Instead, as shown by President Donald Trump’s isolationist “America First” inaugural address and President Xi Jinping’s pro-globalization speech in Davos, the current situation is much more that the established power still enjoys power superiority but refuses to assume its responsibility while the rising power is eager to play a greater role but still lacks sufficient capability.
The road ahead
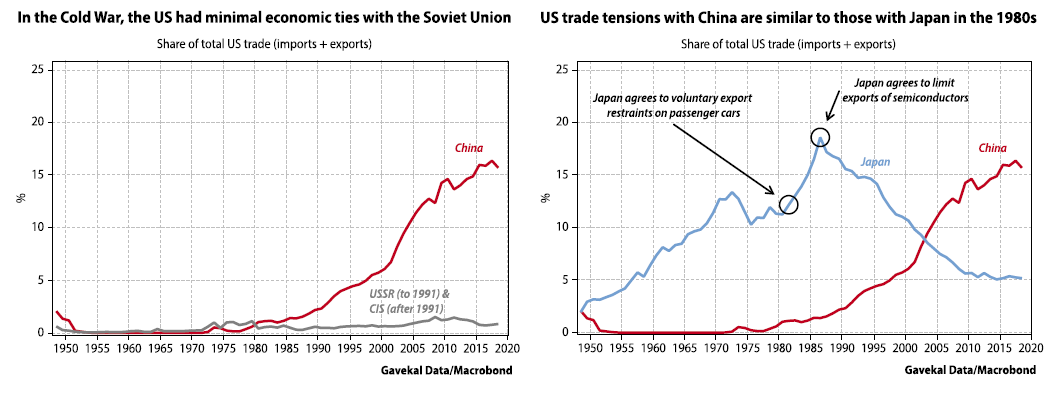
There are still reasons to be optimistic. The US-China relationship is still deep and difficult to unwind. John Authers recently highlighted analysis comparing the degree of integration of the Soviet Union and China to the global economy. China is not the Soviet Union, and any Cold War style containment will be difficult.
It is also instructive the story of TikTok, which is one of the few Chinese social media companies that have been successful. The WSJ reported that it is trying to distance itself from its Chinese roots in order to keep growing.
TikTok this year made history as China’s first social-media company to make it big in the U.S. Now, TikTok wants to shed its label as a Chinese brand.
As TikTok faces mounting scrutiny from U.S. lawmakers and regulators, some employees and advisers in recent weeks have approached senior executives to suggest ways the company could rebrand, according to people familiar with the discussions.
Ideas discussed include expanding operations in Southeast Asia, possibly Singapore—which would allow executives to distance the video-sharing app from China—and rebranding it in the U.S., the people said.
The rupture has largely been contained. China’s brand of revisionist power means that it is unlikely to seek a direct geopolitical confrontation with American forces. It is not the Soviet Union, who tried to export its revolution abroad. There are not even any proxy wars, where each side supports one faction in a local conflict. Business Insider reported that the old Cold War warrior Henry Kissinger declared that the US and China are “in the foothills of a Cold War”:
Legendary former US diplomat Henry Kissinger warned that if the trade war is left uncontrolled, it could spiral into a conflict like World War I.
“If conflict is permitted to run unconstrained the outcome could be even worse than it was in Europe. World War I broke out because a relatively minor crisis could not be mastered,” Kissinger said at a session of the New Economy Forum, organized by Bloomberg.
However, Beijing is trying to to redefine global institutions, and take leadership. Active examples include its BRI initiative to extend its global influence, the seeding of Confucius Institutes around the world to extend its soft power, and the formation of AIIB to take a leadership role in Asia. The risk is an American withdrawal from established global institutions like the United Nations, IMF, and WTO, which leaves a vacuum for Beijing to assume a great leadership role.
Another risk is the growing alliance in DC against China, which exists across the aisle, and allied with business and labor interests, serve to enlarge the rupture in the relationship. This could lead to an isolationism which could disrupt global institutions that have been the foundation of post-War global stability.
In conclusion, this essay is my own equivalent of American diplomat George Kennan’s “long telegram” of 1946, in which he argued that if the Soviet Union was properly contained, it would collapse under the weight of its internal pressures. However, if the Sino-American relationship is properly managed, the fears over the strategic threat from China will prove to be as alarmist as the fears that arose in the late 1980’s over Japanese dominance of the global economy.
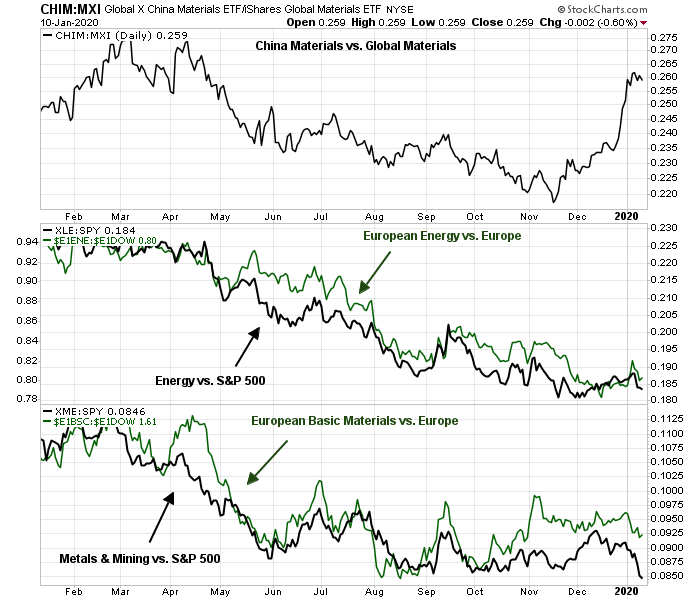
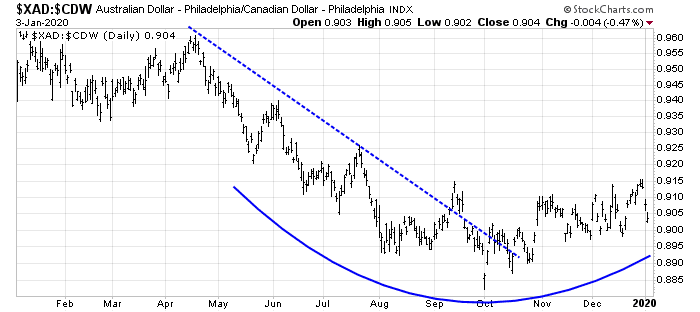
For investors…navigating the coming era of decelerating Chinese growth will be the key to asset returns. The losers are readily identifiable. Economies exposed to Chinese growth, such as Asia and resource exporting countries like Australia, New Zealand, Canada, and Brazil will see sub-par growth as China slows. The winners are less obvious, and depend on the trajectory of US foreign policy, as well as the reaction of other major players like the EU and Japan.
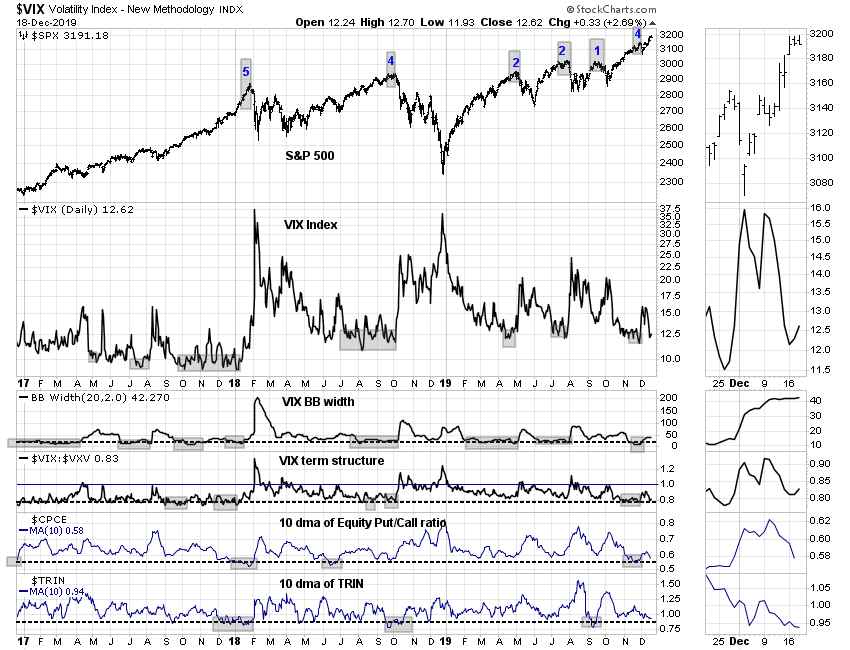
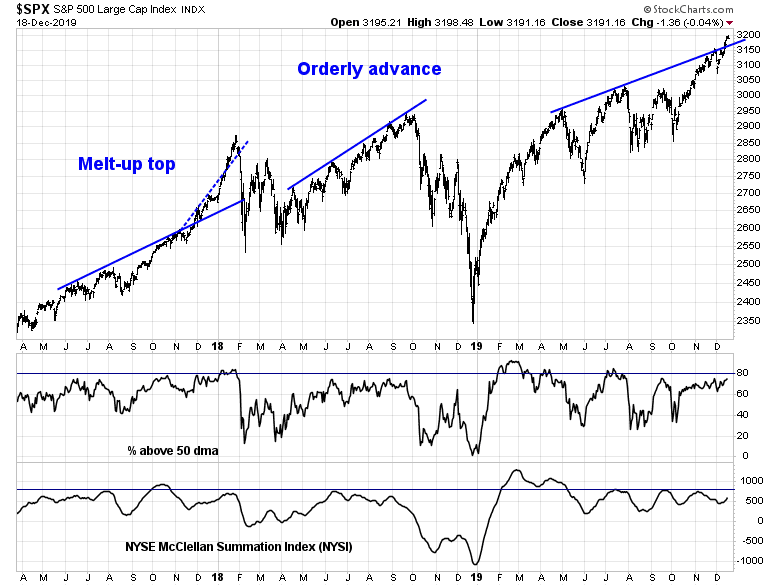
The week ahead
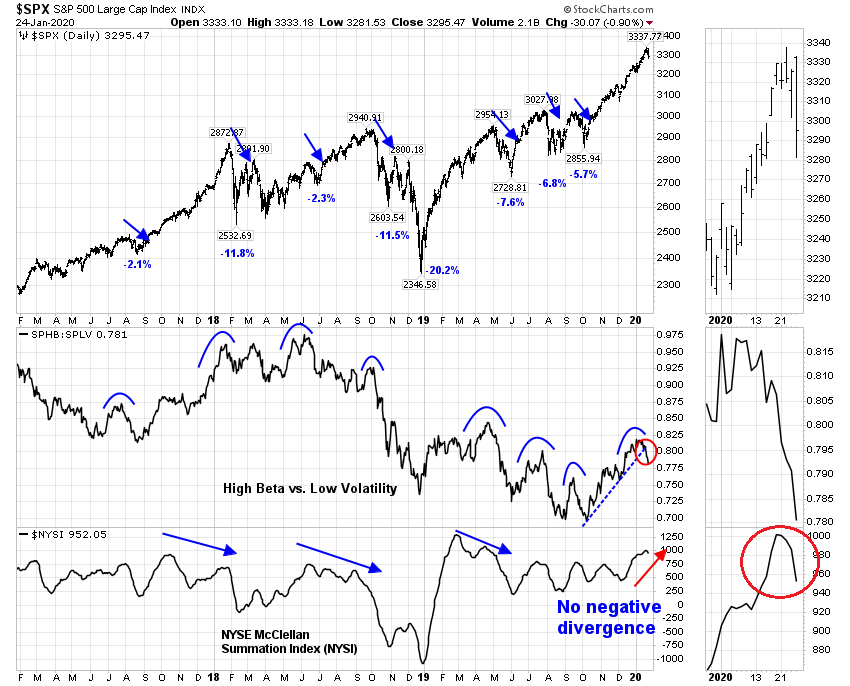
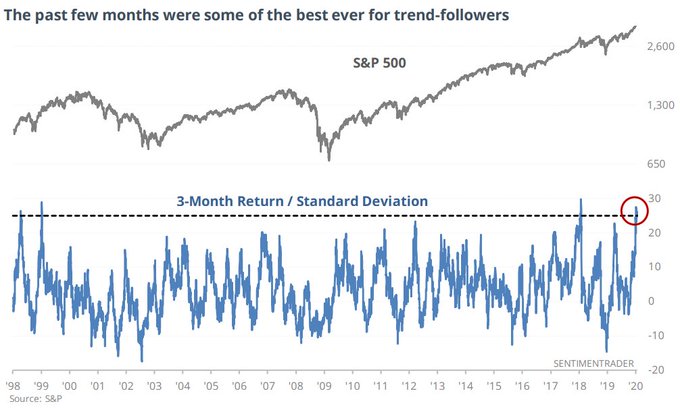
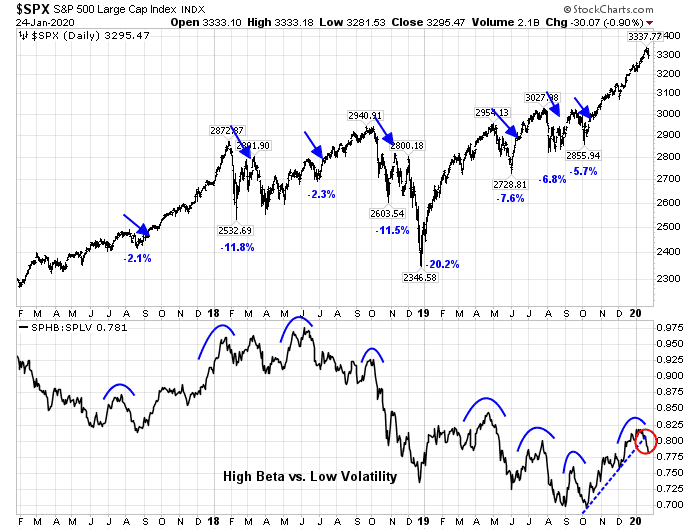
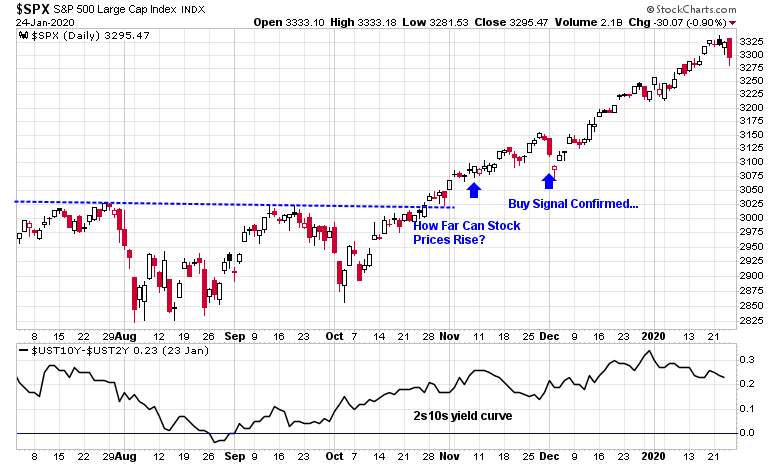
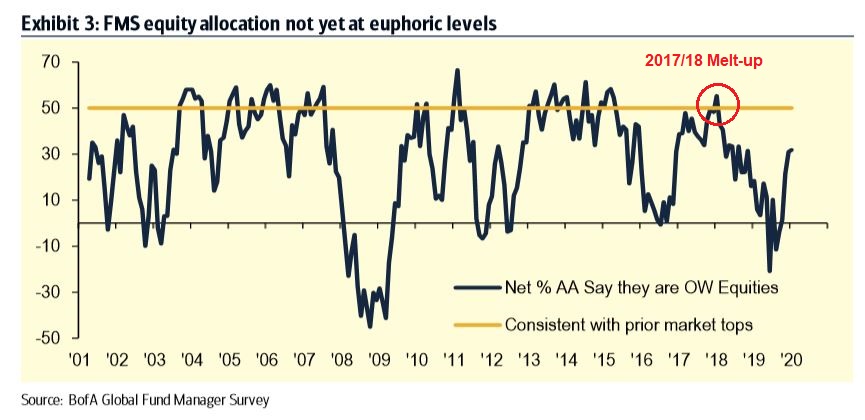
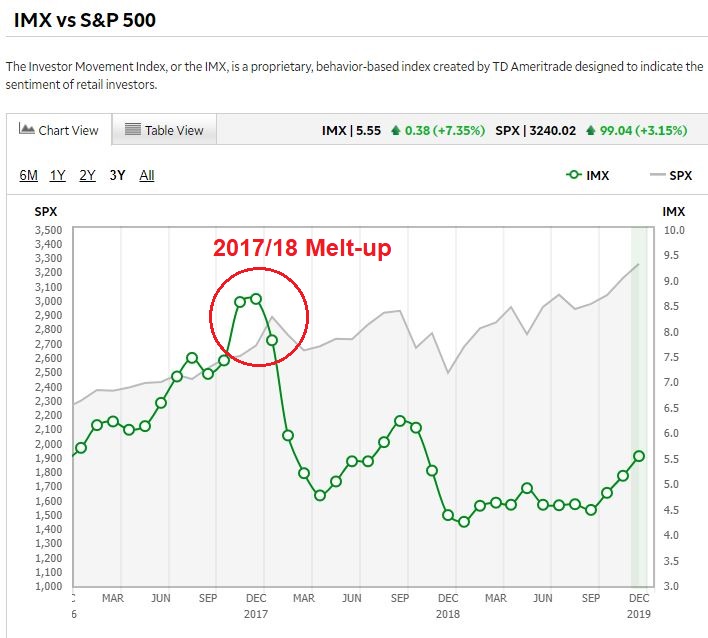
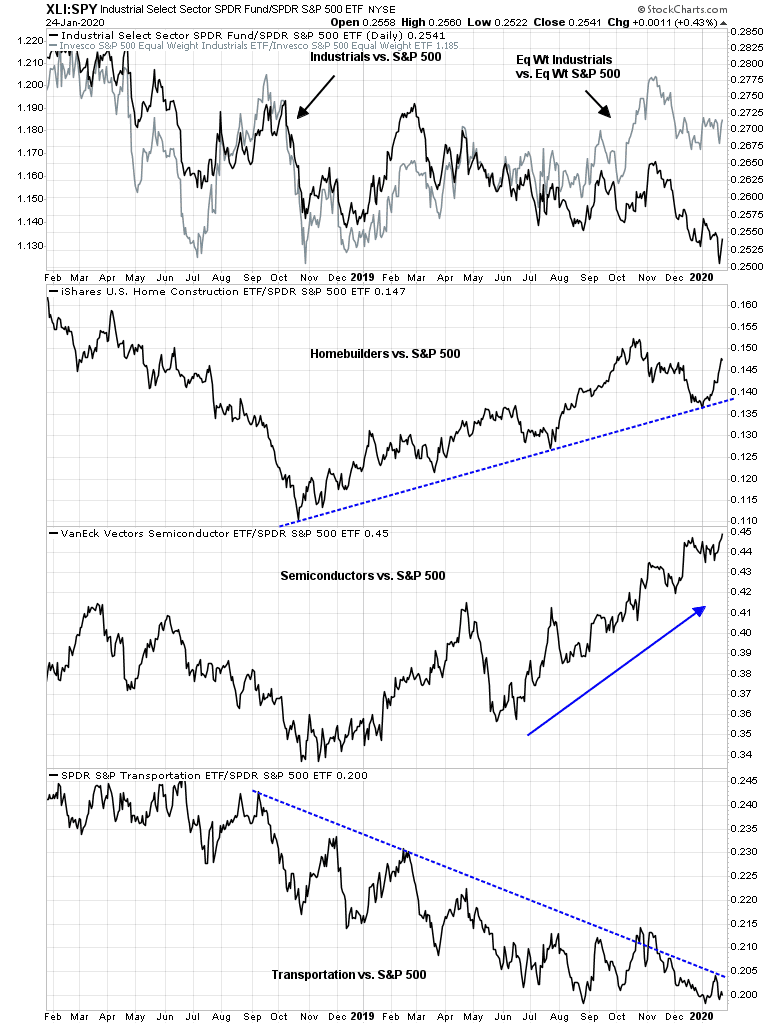
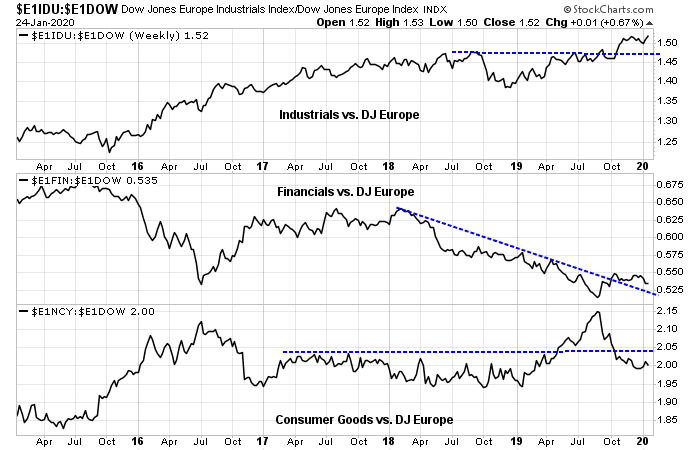
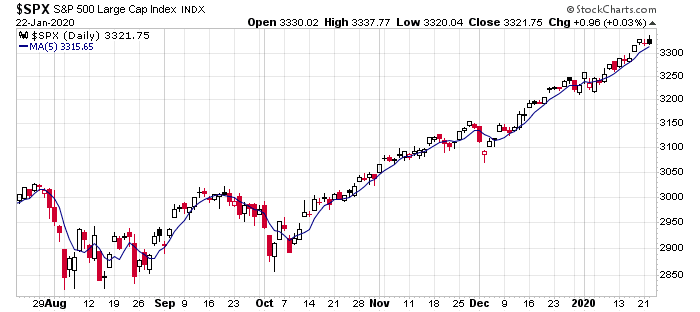
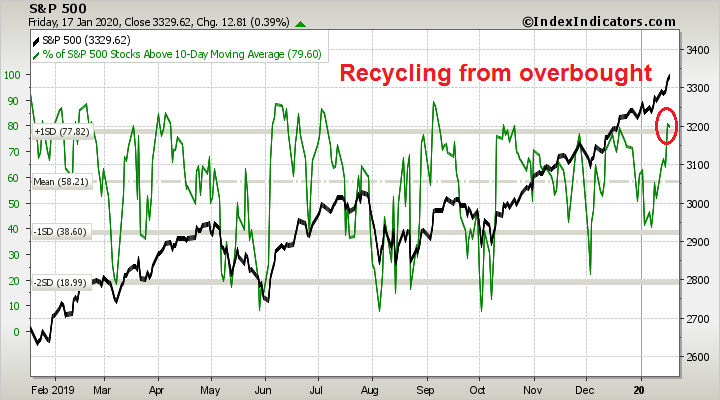
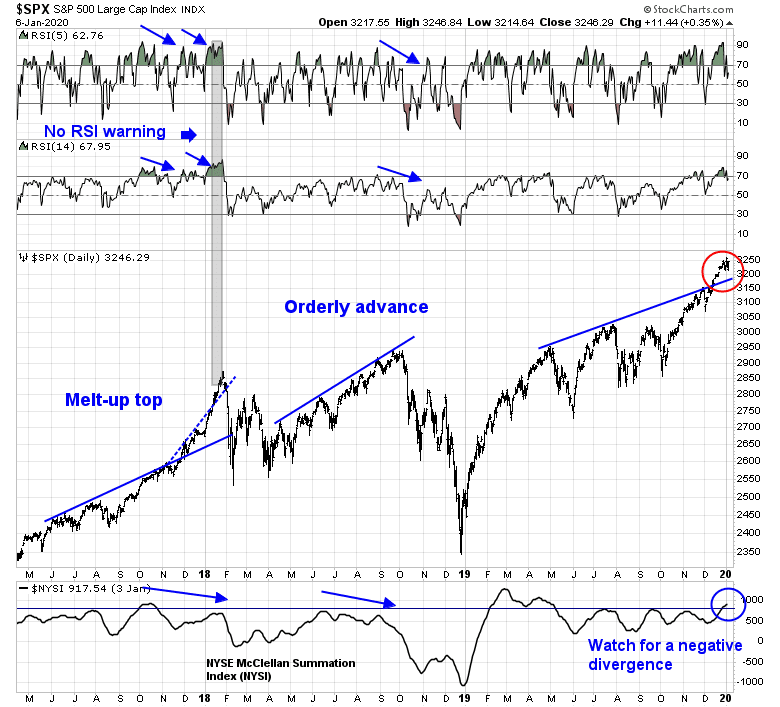
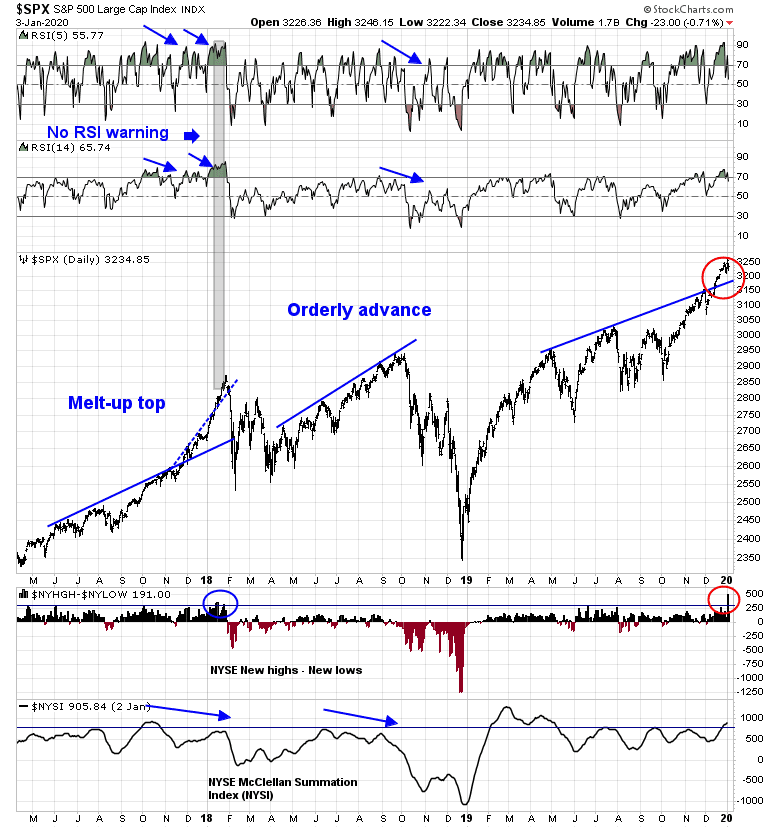
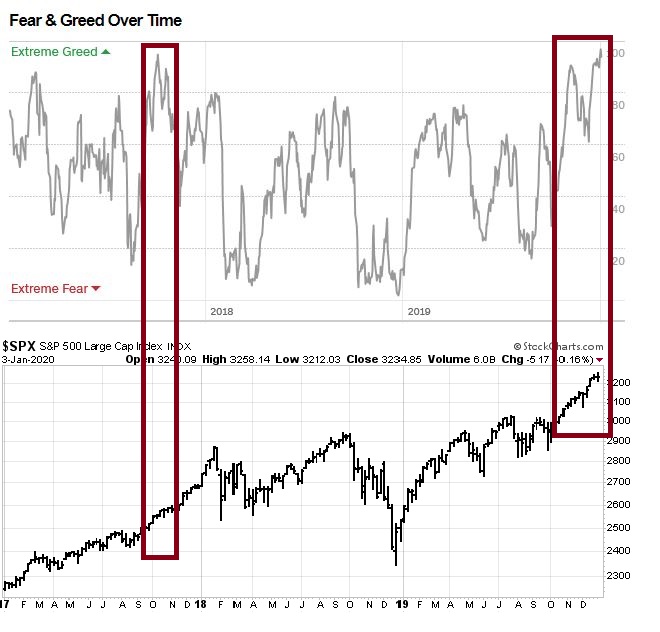
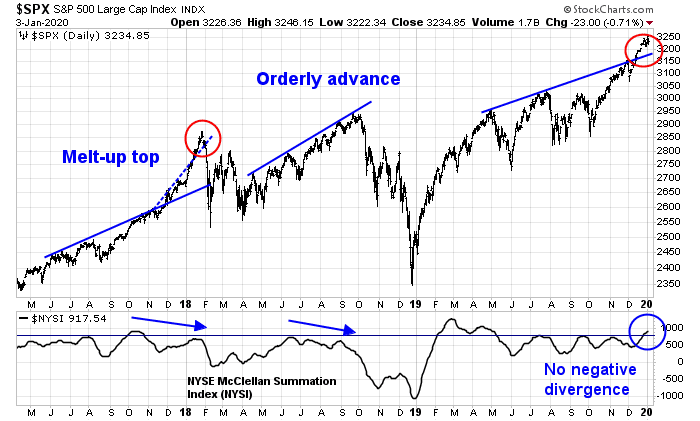
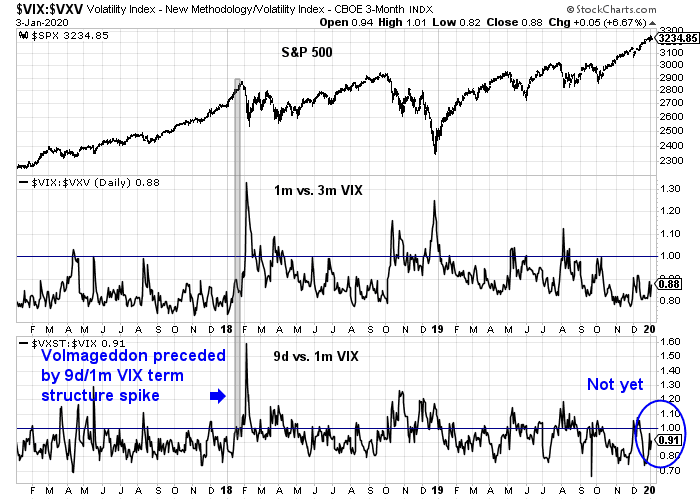
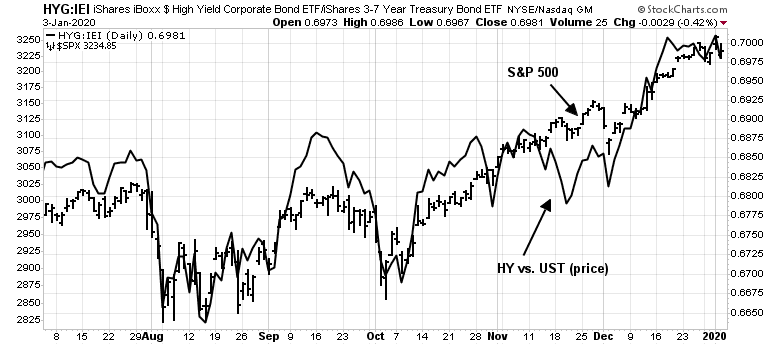
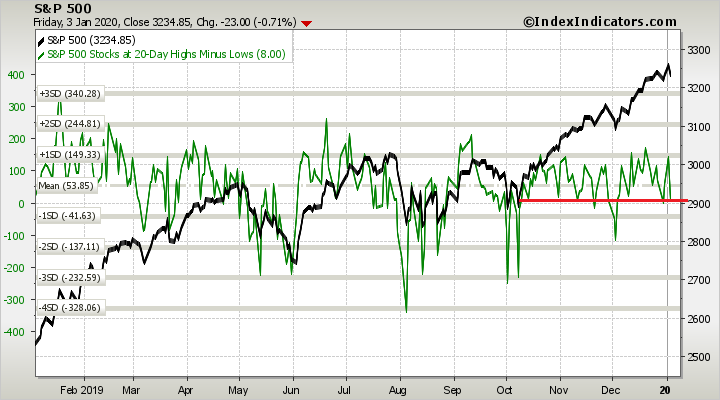
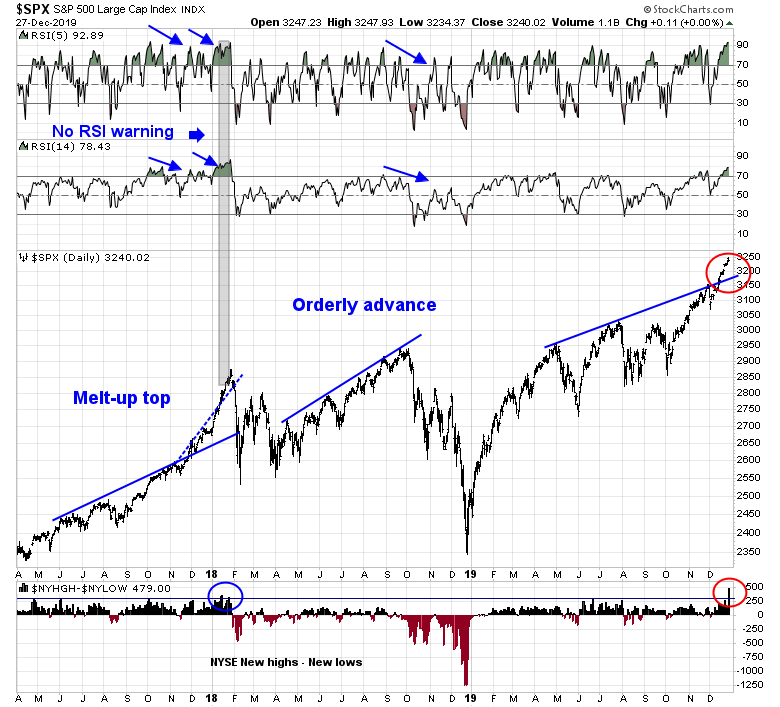
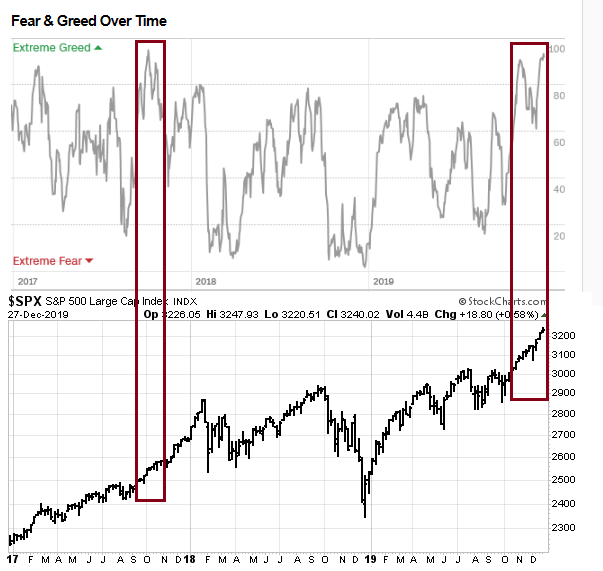
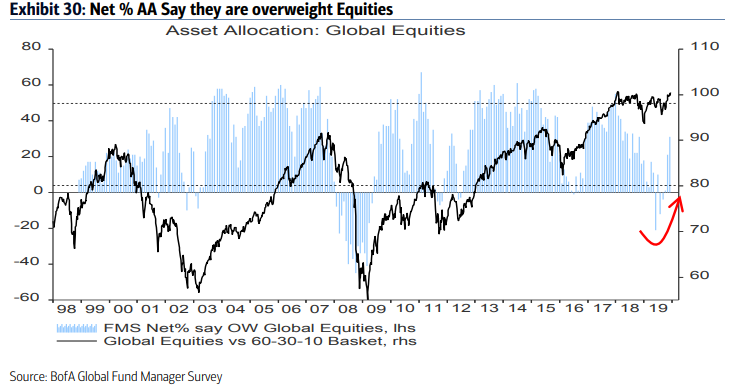
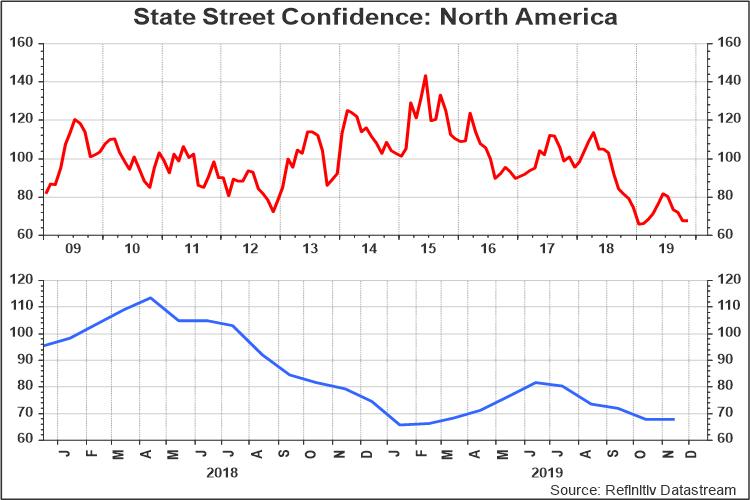
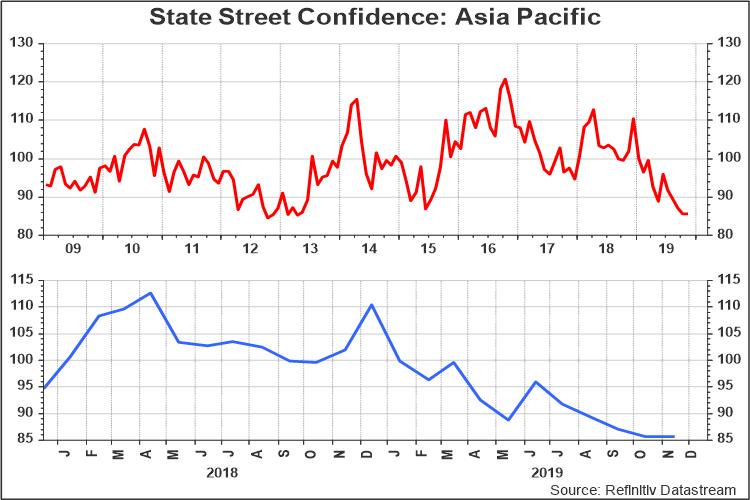
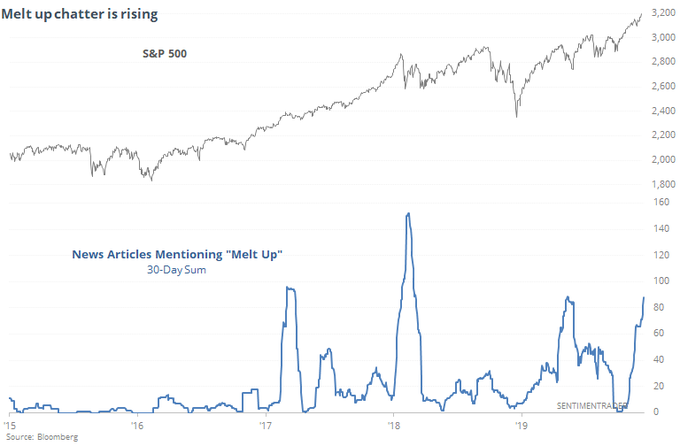
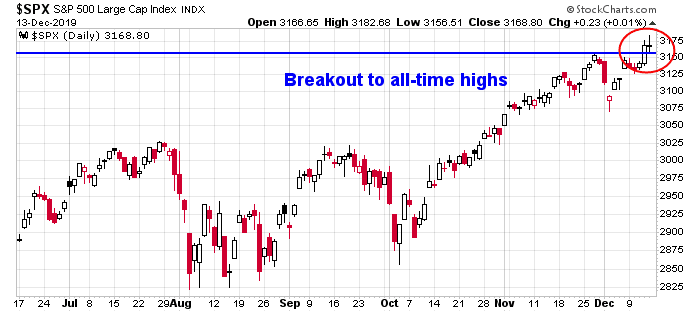
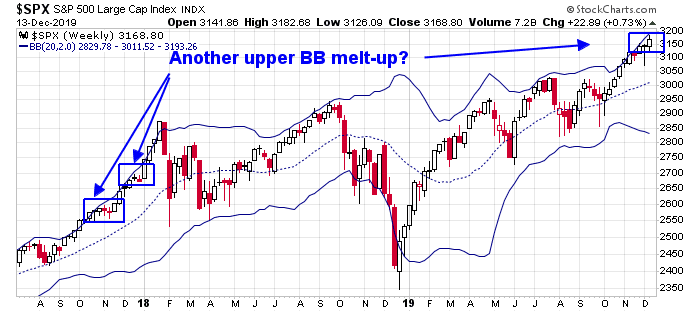
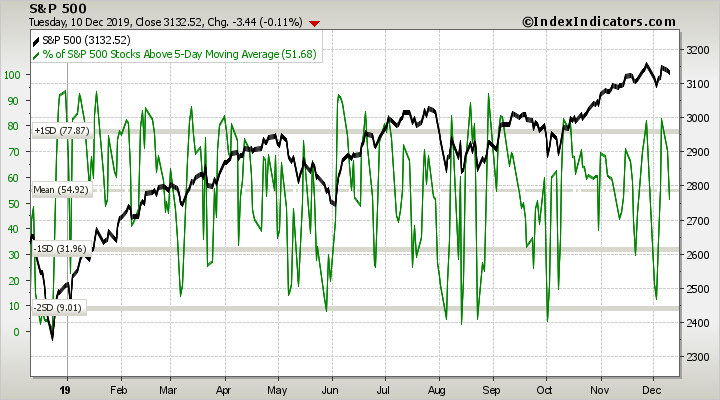
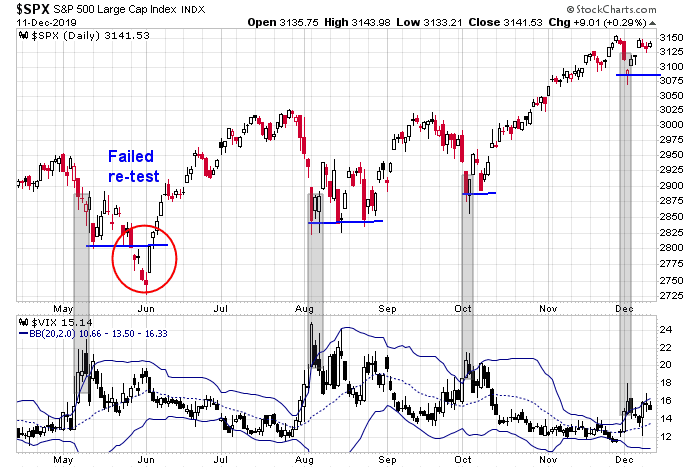
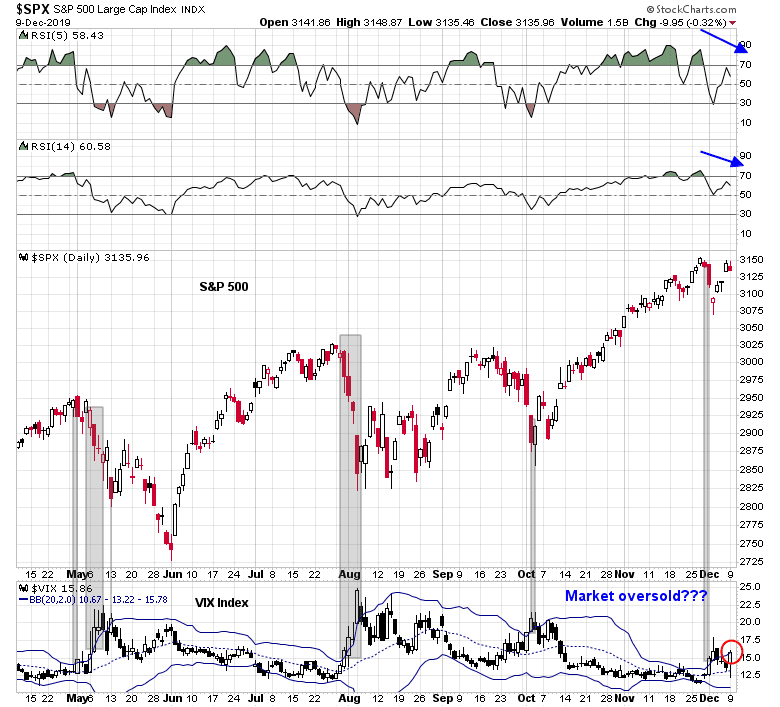
As I am traveling this week, I don’t have any more to add, other than the guidance offered in my previous post (see Is the market melting up?). I have included a number of key links in that post that update the technical conditions of the market that readers can monitor.
Good luck.
Disclosure: Long SPXL