Mid-week market update: I wrote last week that the market gods were favoring the equity bulls, The relief rally would likely last about another week (see How far can this rally run?), but the market is likely to remain range-bound until the trade tensions are resolved.
In conclusion, until these trade tensions are resolved, expect the market to remain range-bound and move in reaction to the latest headlines. This suggests that traders should adopt a position of “buy the dips” and “sell the rips”. If history is any guide, I expect the current rally to peter out some time next week, with the most probable peak occurring about mid-week.
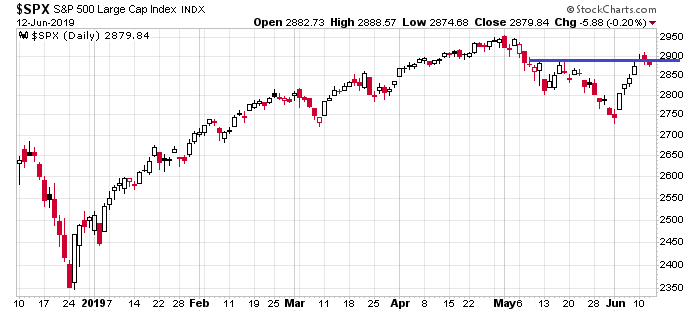
The market has rallied substantially since last Wednesday. It is now mid-week, and the market appears to be stalling at resistance. Is this simply a test and pullback to test resistance, or something worse?
What’s next?
Some historical studies
Rob Hanna at Quantifiable Edges went back in time and studied new 52-week high surges from a market low. He found that these are rare events (N=3).
One notable from Friday was that the number of NYSE new highs expanded to the largest number in over a year. That’s quite remarkable considering the SPX closed at a 50-day low just 4 days ago. In looking at my new high data going back to 1970, I looked for other times where the NYSE new highs count reached the largest level in over a year within 1 week of a 50-day SPX low. I only found 3 other instances. All 3 saw further rallying over the next month, but returns after 1 month were very different.
The first time this happened was in 1982. The surge coincided with the generational market bottom of that year. This was a classic breadth thrust, and strong overbought readings are common during such occasions. Stock prices went on rising and never looked back.

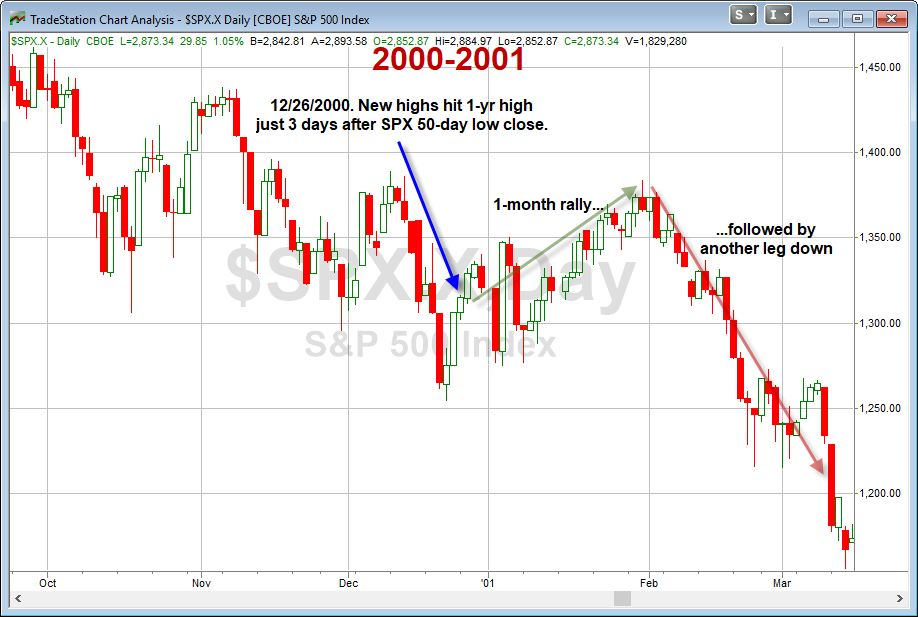
The second episode occurred in 2000, which was a bear market rally. The market rallied for another month, but fell back below the previous low soon afterwards.
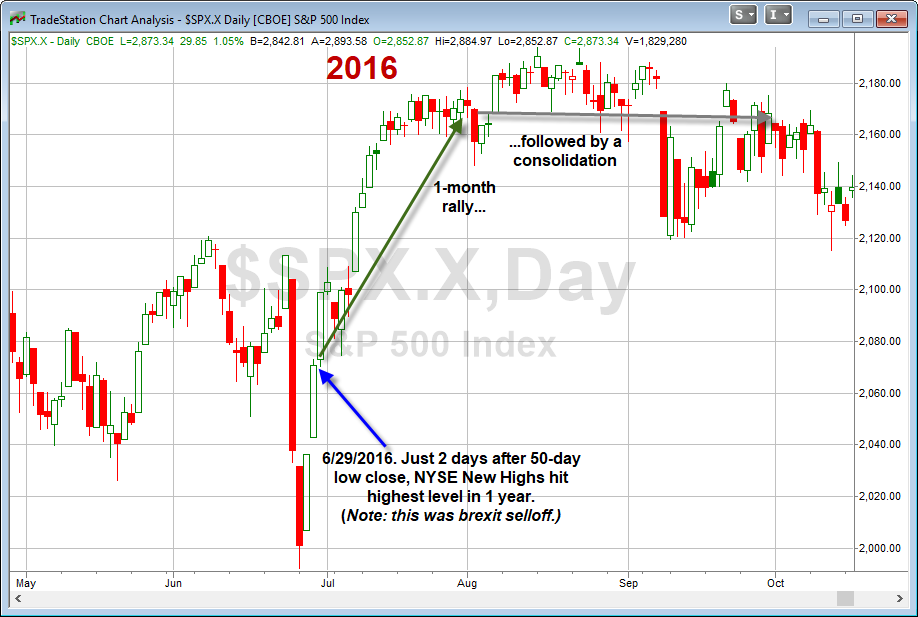
The third occurrence was the Brexit sell-off and recovery. The market rose for a month, but consolidated and went sideways afterwards.
A sample size of three is way too small to perform any kind of meaningful statistical analysis., All three episodes occurred under different market backdrops. 1982 was a rally off a historic bottom , 2000 was a bear market rally, and 2016 was a market panic and recovery. All had different macro, fundamental, and technical drivers. However, there are some commonalities, and here are my main takeaways.
- The market tends to consolidate for 2-4 days after the new high surge, and that consolidation window began on Monday.
- Historically, the market rose for another month or so after the new high surge, and those rallies occurred in the absence of other binary event-driven inflection points. Today, we have an FOMC meeting next week, and the Trump-Xi G20 meeting the following week. Don’t count history repeating itself, it only rhymes.
Caveats to new highs surge
Before the bulls get too excited, there are a number of caveats to the new high surge. Bloomberg reported that Jeff deGraaf sounded a cautionary note about the character of the latest breadth thrust:
To analysts who watch charts to predict moves in securities, the broad elevation among stocks is a sign of internal strength that bodes well for the market. Yet Jeff deGraaf, co-founder of RenMac, found a distinctive contrast from 2018 that may cast a shadow on the indicator’s bullishness.
Stocks that made new highs last week came primarily from defensive sectors, such as utilities, real estate and consumer staples. Back in early 2018, it was technology and cyclical shares that dominated the list.
“That number is bullish historically; its constituency, however, is questionable if not curious,” deGraaf wrote in a note to clients.
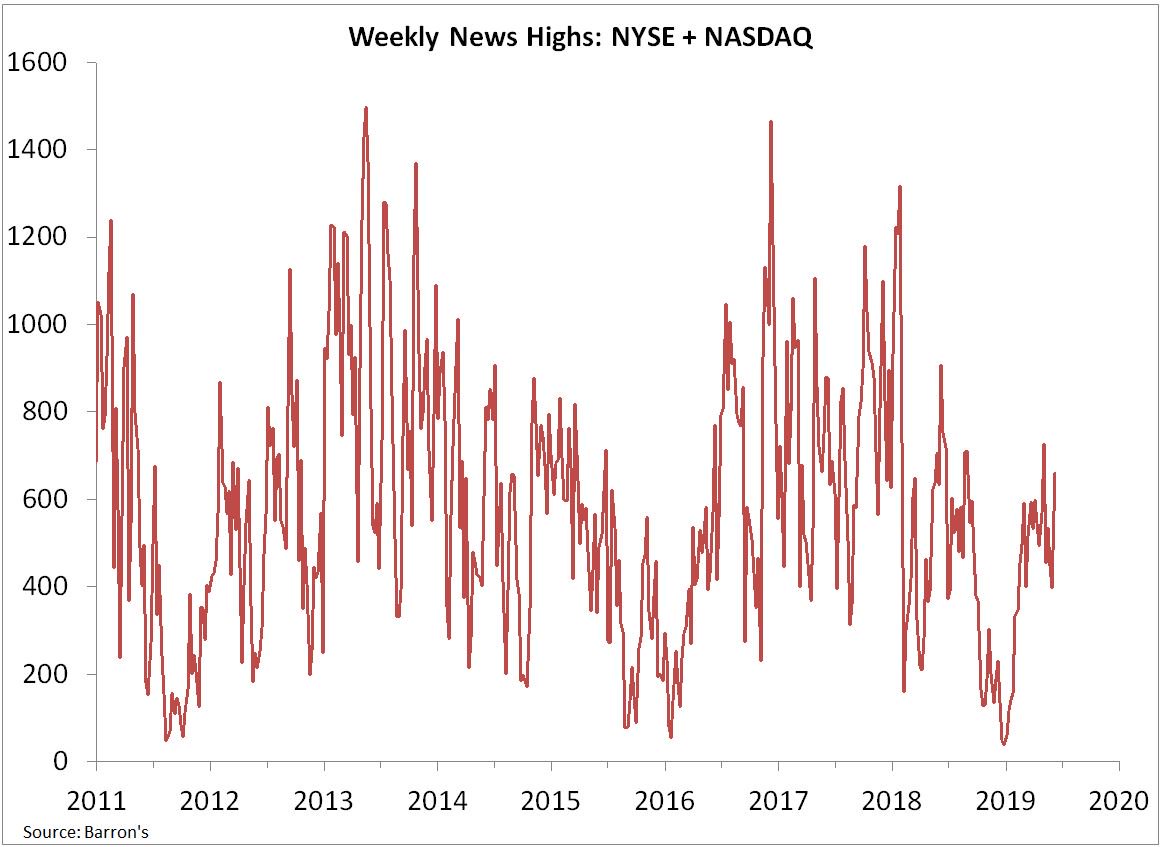
Willie Delwiche also pointed out that if you combine NYSE and NASDAQ 52-week highs, market breadth looks far less impressive.
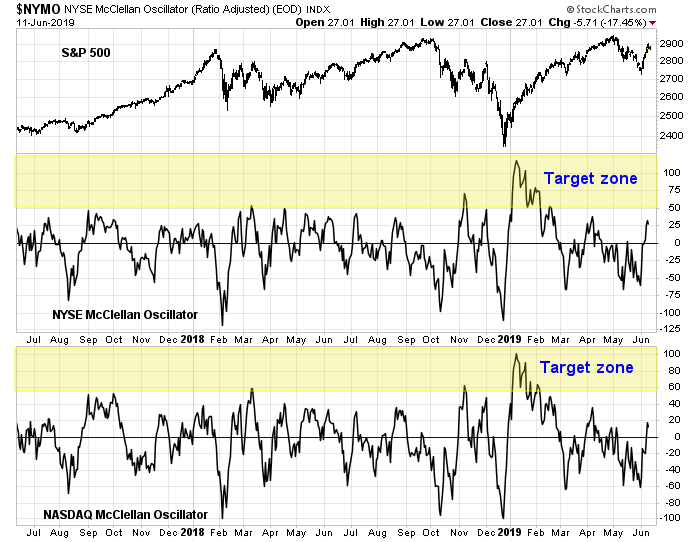
As well, neither the NYSE or NASDAQ McClellan Oscillators (NYMO and NAMO) appear to be less than impressive on the latest rebound.
Cautious near-term
As a consequence, I am cautious near-term. The range-bound scenario remains my base case, and the market is nearing the top of its range.
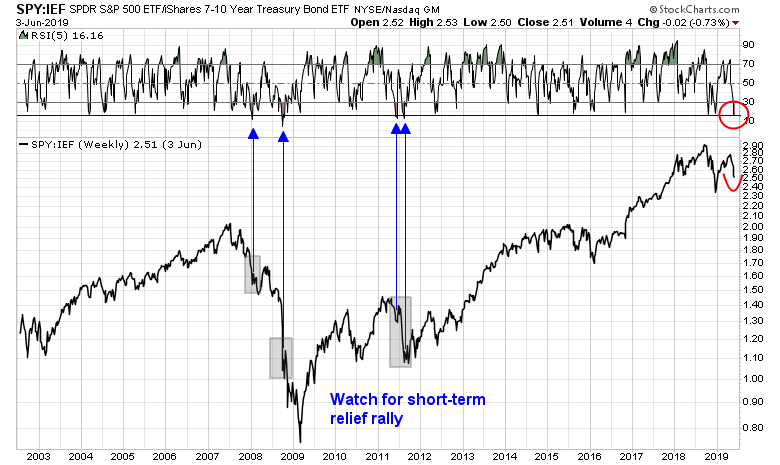
As a reminder, I wrote last week that the panic shown by the stock/bond ratio usually marked a short-term, but not sustainable bottom (see How far can this rally run?). While the stock/bond ratio has improved since last Monday’s low, I stand by the analysis that the odds favor this rally as a short-term rebound, rather than the start of a sustained uptrend.
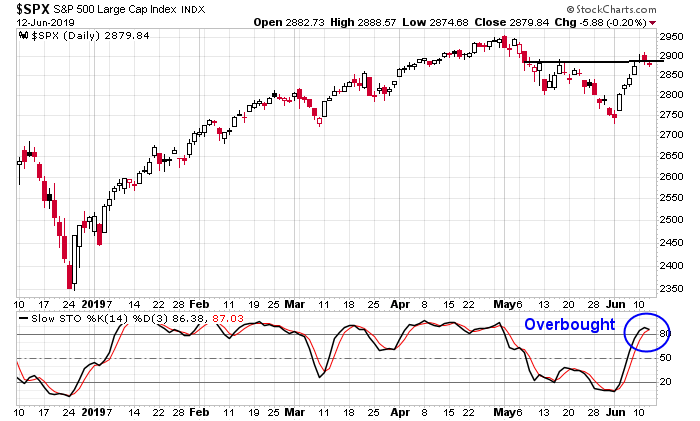
I also said that I am watching the daily stochastic to watch for an overbought signal for the signs of a possible stall. The stochastic rose into overbought territory yesterday. Another telltale sign of impending weakness appeared on Monday when the index formed a graveyard doji, which can indicate a bearish reversal.
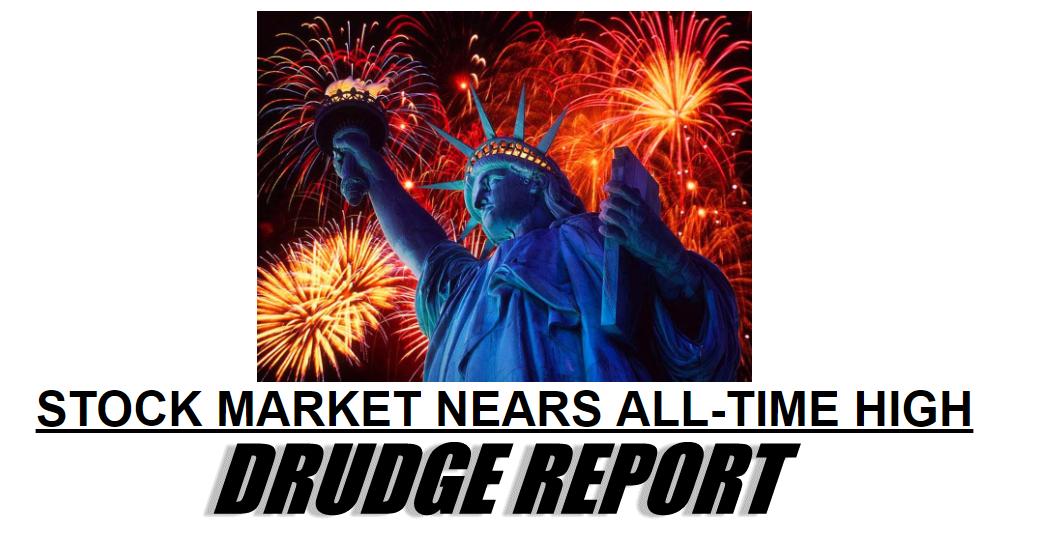
For the ultimate contrarian indicator? This appeared on Drudge Report shortly after yesterday’s market open.
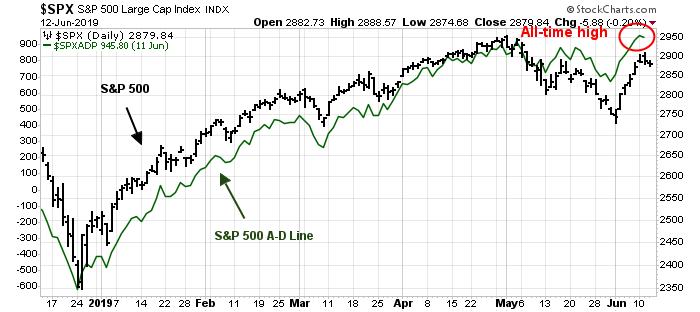
I don’t want to imply that I am bearish because of bad breadth. While short-term breadth momentum may not be supportive of immediate new highs, intermediate-term breadth indicators are supportive of more strength. The SPX Advance-Decline Line flashed a positive divergence by making an all-time high yesterday (Tuesday). I interpret these conditions as the market wants to go up, but short-term uncertainty may impede the advance.
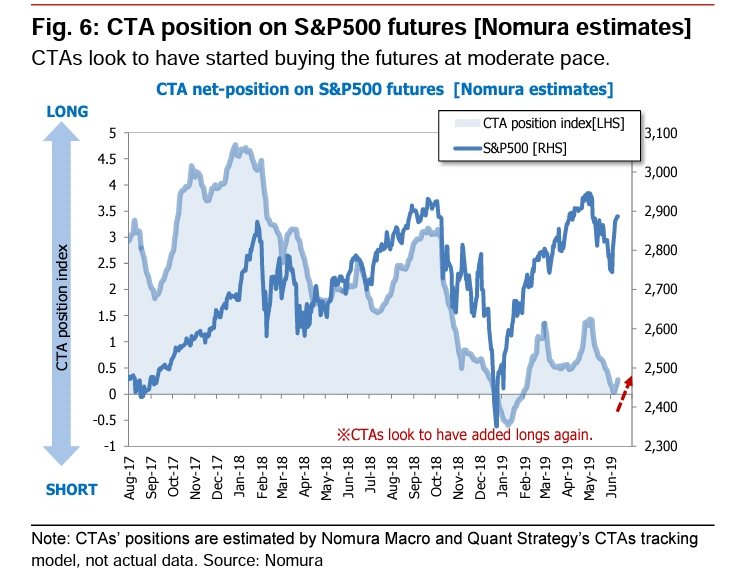
In addition, Nomura estimates trend following CTAs are starting to buy equities again after their recent recovery, which should provide a source of demand should prices remain relatively stable.
My inner investor is maintaining his equity positions at roughly the levels specified by long-term investment policy. He has additionally sold covered calls against existing long positions to harvest the elevated implied volatility levels in the current environment.
Subscribers received an alert yesterday that my inner trader sold all of his long positions and moved to cash and the sidelines. Prudent risk management ahead of next week’s FOMC meeting, and the following week’s Trump-Xi G20 meeting calls for risk reduction. My inner trader will go on holiday and return after the G20 meeting. There is no point trading if you have no edge.