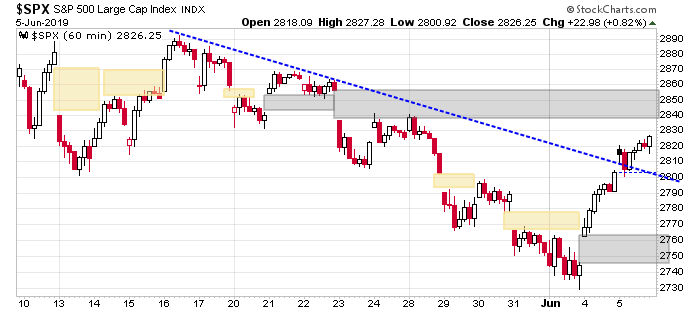
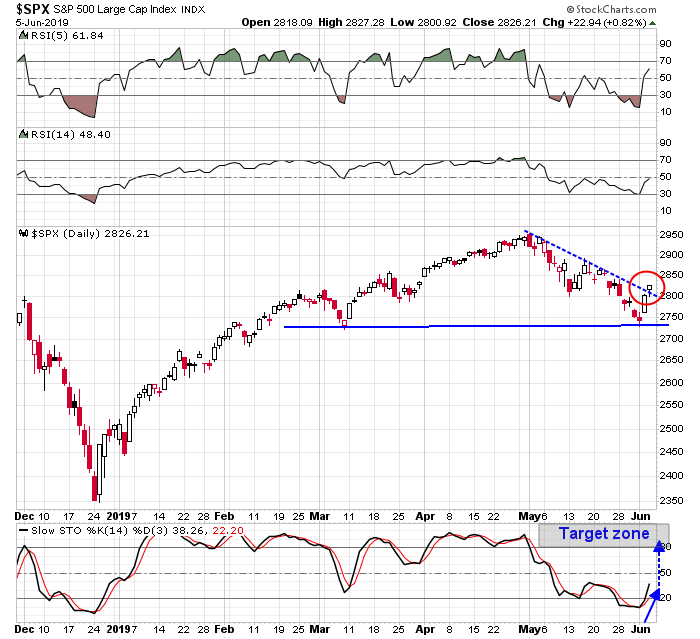
Mid-week market update: I had been making the point for the past week that this market is oversold and ripe for a relief rally, and the rally finally occurred. From a technical perspective, the market rallied through a downtrend line, which is a sign that the bulls have seized control of the tape. However, the bulls shouldn’t overstay their welcome. Until the trade tension overhang is lifted, this market is likely to remain volatile and range-bound. One characteristic of this uncertainty are the numerous gaps that can be found on the hourly chart.
Nevertheless, how long can this rally last, and how far can it run? I considered a number of historical studies to arrive at some estimates, and here is what I found.
The CBI buy signal
I highlighted analysis from Rob Hanna at Quantifiable Edges on Monday (see Panic is in the air) that his CBI indicator had spiked 10 points on Friday, which is almost unheard of because a reading of 10 is considered to be a buy signal. Hanna found that subsequent returns were strongly positive, though the market did not always rally right away.
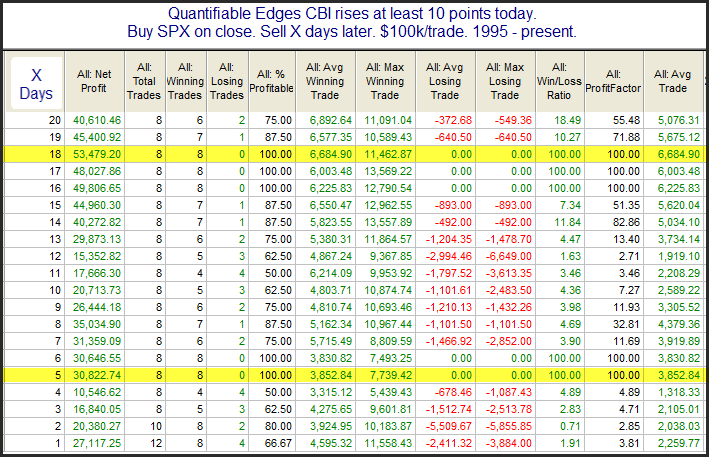
Based on Hanna’s analysis, the rally can last for up to 4 weeks, but there was a strong reaction in the initial week, with average gains of just under 4% in the first week, and total gains of about 6% over 3-4 weeks. However, Hanna’s study is silent as to the durability of the rally?
The SPX ZBT oversold setup
I also wrote on Sunday (see China’s new Long March) that I was seeing tactical oversold setups that happen only once every few years:
I monitor the Zweig Breadth Thrust Indicator for signs that the market might undergo a bullish stampede. The setup for a ZBT is an oversold condition on the ZBT Indicator. While stockcharts reports the ZBT Indicator with a lag, I have developed my own estimate, based on both the NYSE breadth statistics originally used by Marty Zweig, and my own estimates based on solely S&P 500 components (bottom panel). The SPX ZBT Indicator flashed oversold signals last Wednesday and on Friday. While oversold conditions do not guarantee a ZBT buy signal, all of the past instances in the last five years when the SPX ZBT Indicator was oversold, but the official ZBT Indicator was no, have resolved themselves with short-term relief rallies.
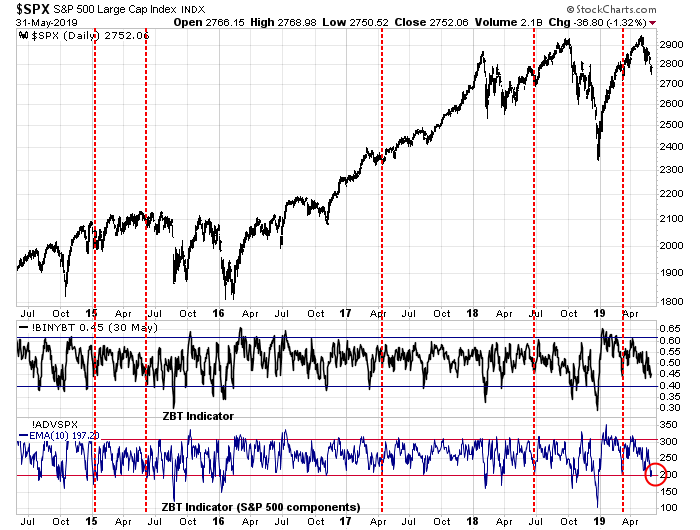
My conclusions from this study were:
- All signals where the SPX ZBT was oversold, but the ZBT was not, saw the market bounce.
- The rally lasted between 4-15 days, with a median of 10 days.
- The magnitude of the short-term rally was about 2-3%.
How oversold was the market?
Another way of estimating the duration and size of the relief rally is to observe how the market behaved during oversold extremes. Here is one indication of how oversold the market became on Monday, which represented the near-term nadir of the pullback. Based on the 5-week RSI, the weekly chart of SPY to IEF (7-10 year Treasury ETF) has only been this oversold four other times in the last 14 years, indicating a stampede out of stocks and into the safety of Treasury paper.
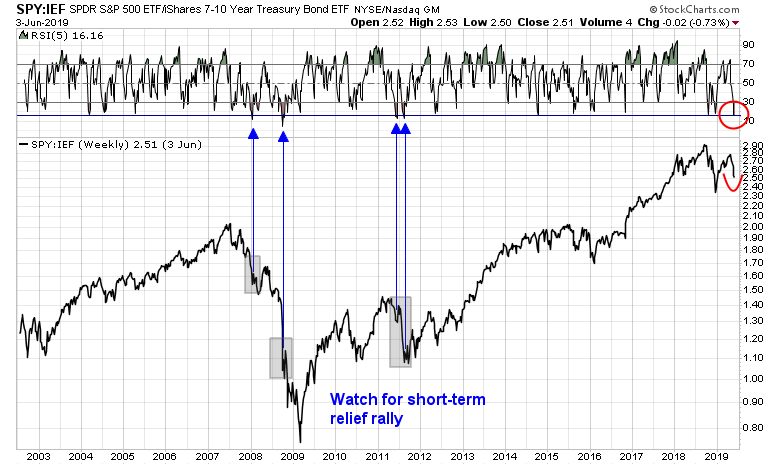
There are several key takeaways from this historical study:
- All of the signals were followed by bounces.
- None of them were durable bottoms. The market continued to fall during well-defined bear markets (2008), or were range-bound (2011).
- The duration of the rallies was 3-5 weeks.
- The magnitude of the rallies were 4-15%.
Trade war anxiety = Range-bound market
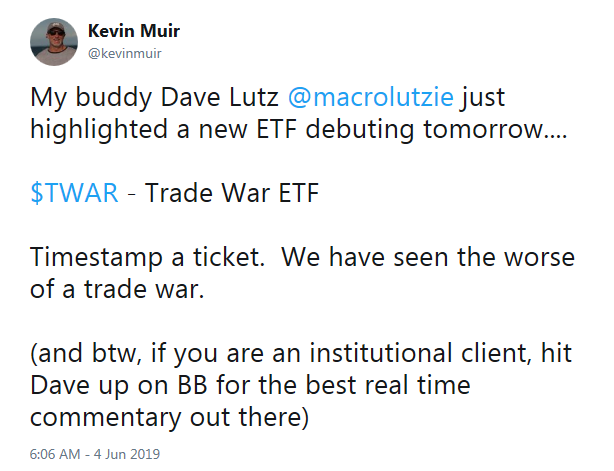
I believe that the presence of trade related risks suggests that the market will remain choppy until the uncertainty is resolved. Arguably, we may be seeing peak tariff anxiety. Kevin Muir pointed out that a new ETF with a trade war theme has been listed, which may mark the high water mark of protectionism fears.
Trade tensions may be starting to ease. Treasury Secretary Steve Mnuchin is expected to meet with PBOC governor Yi Gang this weekend in Japan. China released their white paper which outlined their position last weekend, which helpfully did not offer any new negative surprises. The upcoming weekend meeting may be the start of a thaw that could lead to more dialogue, and hopefully, a future deal.
In addition, the Washington Post reported that Congressional Republicans are so upset with Trump’s initiative to impose tariffs on Mexico that they are plotting block his plan.
Congressional Republicans have begun discussing whether they may have to vote to block President Trump’s planned new tariffs on Mexico, potentially igniting a second standoff this year over Trump’s use of executive powers to circumvent Congress, people familiar with the talks said.
The vote, which would be the GOP’s most dramatic act of defiance since Trump took office, could also have the effect of blocking billions of dollars in border wall funding that the president had announced in February when he declared a national emergency at the southern border, said the people, who spoke on the condition of anonymity because the talks are private.
Unlike the last Congressional resolution opposing the reallocation of funds for the Wall, GOP lawmakers are aiming for a veto-proof majority. Such a development would go a long way to relieve the market’s anxiety about a trade-induced economic slowdown.
Congress passed such a resolution in March after Trump reallocated the border wall funds, but he vetoed it. Now, as frustration on Capitol Hill grows over Trump’s latest tariff threat, a second vote could potentially command a veto-proof majority to nullify the national emergency, which in turn could undercut both the border-wall effort and the new tariffs.
In conclusion, until these trade tensions are resolved, expect the market to remain range-bound and move in reaction to the latest headlines. This suggests that traders should adopt a position of “buy the dips” and “sell the rips”. If history is any guide, I expect the current rally to peter out some time next week, with the most probable peak occurring about mid-week.
As to the magnitude of the move, I cannot provide much specific guidance. However, my former Merrill Lynch colleague Fred Meissner thinks that, as long as the short-term momentum is sustained, the daily stochastic is likely to move from the recent oversold condition to an overbought reading. Watch this indicator.
Disclosure: Long SPXL, TQQQ
Thank you
The narrative of this current bounce seems to be that there are a) a Trump put (where the president will become Dow Man again should the economy weaken) and b) a Fed Put, relying on central banks becoming more accomodative in light of the downturn in growth expectations. There are reasons to believe that market participants are too complacent regarding those two concepts, but investors will probably have time until after the June Fed meeting before the next wave of selling emerges. The Fed meeting ends on June 19th, Flash PMI numbers will be released on June 21st – by early July, at the latest, one would expect to get negative pre-announcements from corporations should the trade issues not be resolved in some way until then. Before the next Fed meeting shorts are at risk of being hit by surprisingly dovish central banks, with today’s ECB meeting being an early yet important indicator.
Cam–as you emphasized, the real question is what happens after this bullish episode runs out of steam. The market ignored the terrible new jobs report. Most of the data supports the idea of a slowing of the economy. The Fed will lower rates from weakness and fear. Count this person as very doubtful that Trump will become Dow Man. A lot of what happens with the tariffs is no longer in his hands. Robert Millman