Preface: Explaining our market timing models
We maintain several market timing models, each with differing time horizons. The “Ultimate Market Timing Model” is a long-term market timing model based on the research outlined in our post, Building the ultimate market timing model. This model tends to generate only a handful of signals each decade.
The Trend Model is an asset allocation model which applies trend following principles based on the inputs of global stock and commodity price. This model has a shorter time horizon and tends to turn over about 4-6 times a year. In essence, it seeks to answer the question, “Is the trend in the global economy expansion (bullish) or contraction (bearish)?”
My inner trader uses a trading model, which is a blend of price momentum (is the Trend Model becoming more bullish, or bearish?) and overbought/oversold extremes (don’t buy if the trend is overbought, and vice versa). Subscribers receive real-time alerts of model changes, and a hypothetical trading record of the those email alerts are updated weekly here. The hypothetical trading record of the trading model of the real-time alerts that began in March 2016 is shown below.
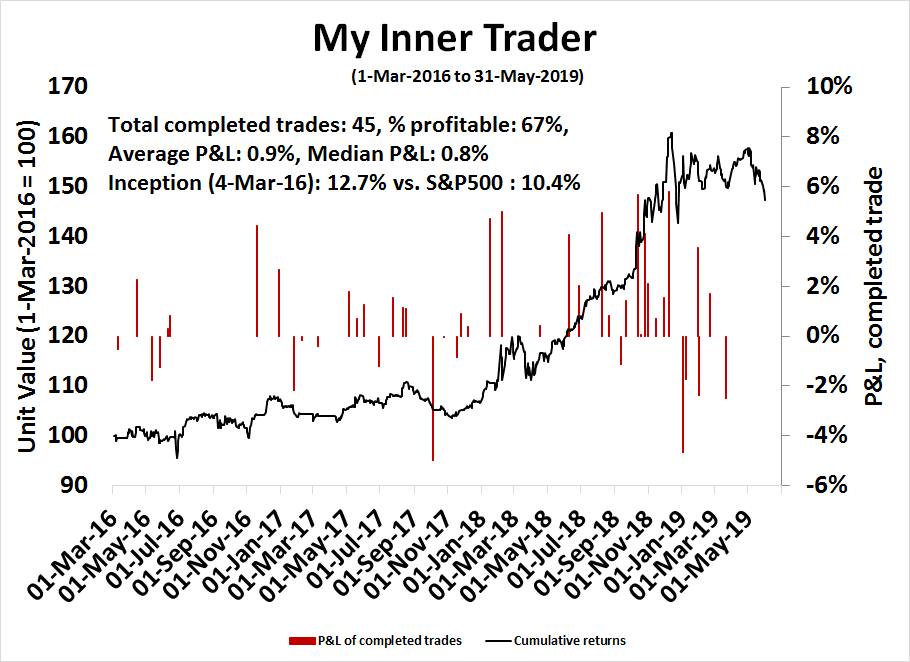
The latest signals of each model are as follows:
- Ultimate market timing model: Buy equities
- Trend Model signal: Neutral
- Trading model: Bullish
Update schedule: I generally update model readings on my site on weekends and tweet mid-week observations at @humblestudent. Subscribers receive real-time alerts of trading model changes, and a hypothetical trading record of the those email alerts is shown here.
The new Long March
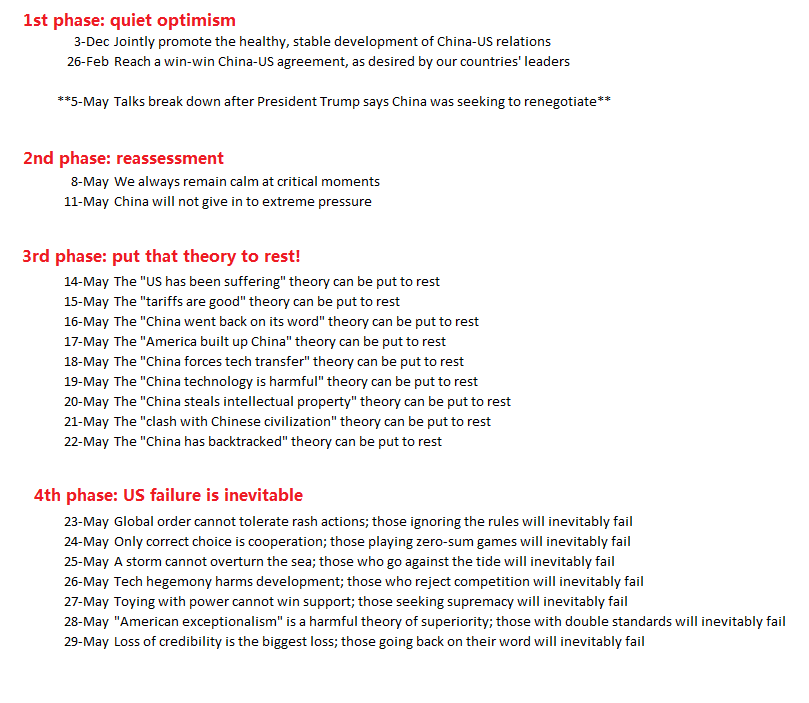
The belligerent tone of the rhetoric has been heating up on both sides of the Sino-American trade dispute. Simon Rabinovitch of The Economist recently documented the different phases and rising stridency of the Chinese response in state-controlled media.
Xi Jinping characterized the dispute as another Long March. For the uninitiated, the Long March is as important to the Chinese Communist Party’s founding myth as the events at Lexington Green was to America’s revolutionary founding myth. Here is the description from Wikipedia:
The Long March (October 1934 – October 1935) was a military retreat undertaken by the Red Army of the Communist Party of China, the forerunner of the People’s Liberation Army, to evade the pursuit of the Kuomintang (KMT or Chinese Nationalist Party) army. There was not one Long March, but a series of marches, as various Communist armies in the south escaped to the north and west. The best known is the march from Jiangxi province which began in October 1934. The First Front Army of the Chinese Soviet Republic, led by an inexperienced military commission, was on the brink of annihilation by Generalissimo Chiang Kai-shek’s troops in their stronghold in Jiangxi province. The Communists, under the eventual command of Mao Zedong and Zhou Enlai, escaped in a circling retreat to the west and north, which reportedly traversed over 9,000 kilometers (5600 miles) over 370 days.[1] The route passed through some of the most difficult terrain of western China by traveling west, then north, to Shaanxi.
The Long March began Mao Zedong’s ascent to power, whose leadership during the retreat gained him the support of the members of the party. The bitter struggles of the Long March, which was completed by only about one-tenth of the force that left Jiangxi, would come to represent a significant episode in the history of the Communist Party of China, and would seal the personal prestige of Mao Zedong and his supporters as the new leaders of the party in the following decades.
The Wikipedia article went on to document that only about 8,000 of 100,000 soldiers survived the Long March to Yunan. Xi`s Long March imagery was a signal that Chins should be willing to endure enormous deprivations in its economic war with the US.
How is China performing on the new Long March? How much deprivation is it suffering, and what weapons do Beijing have to fight this new war?
China is slowing
There are numerous signs that China is slowing. CNBC reported that April industrial profits are down -3.7% year/year, compared to March’s +13.9% print.
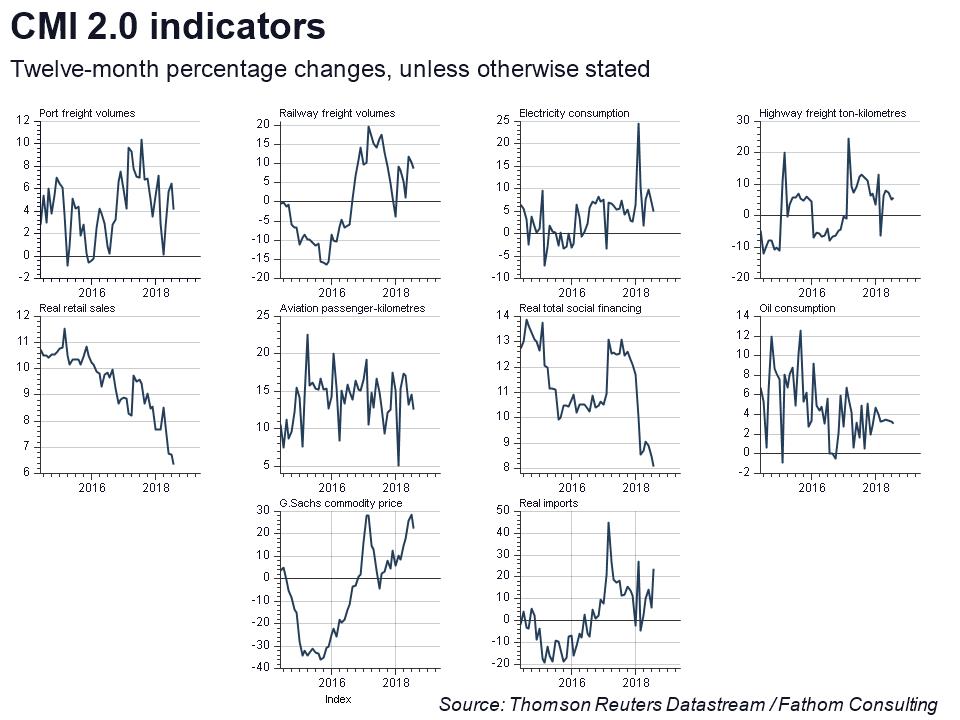
As well, of the 10 Fathom Consulting indicators of China’s economy, nine are falling and only one, real imports, is pointing upwards. Even the rise in imports may be an anomaly, as they may be front-loaded to escape rising tariff rates.
CNBC recently reported that China’s diesel demand is falling off a cliff:
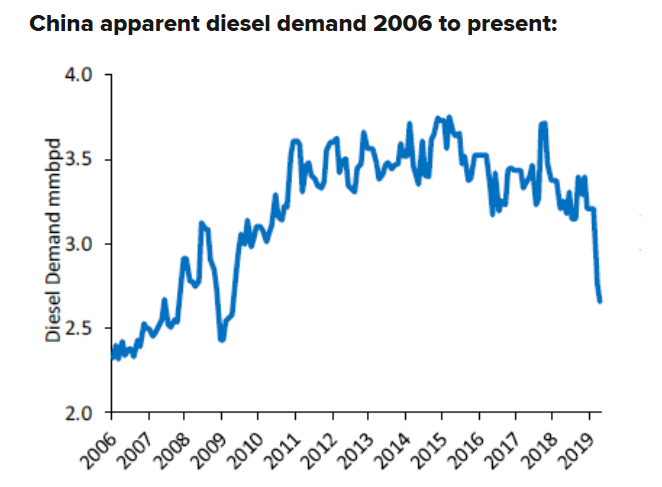
Fathom Consulting’s models estimate that actual GDP growth has slowed to 5.1%.

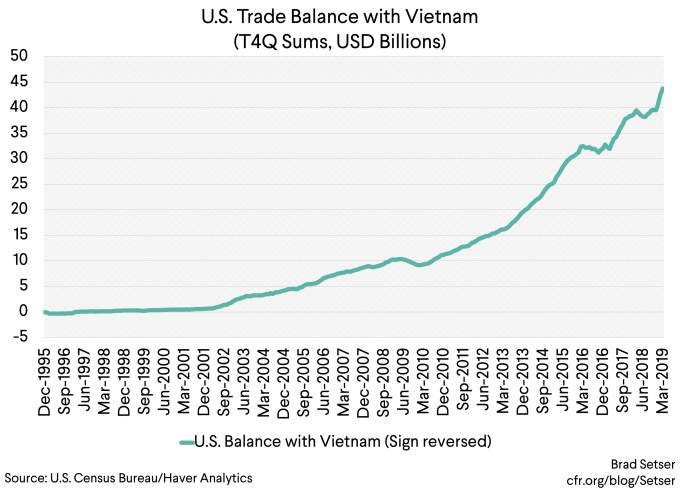
To add insult to injury, Brad Setser observed that the winner of the US-China trade war is Vietnam, as companies reconfigure their supply chains away from China into other low-wage countries.
The challenges of stimulus
What about the Chinese government’s stimulus program? What’s its status, and how sustainable is the stimulus?
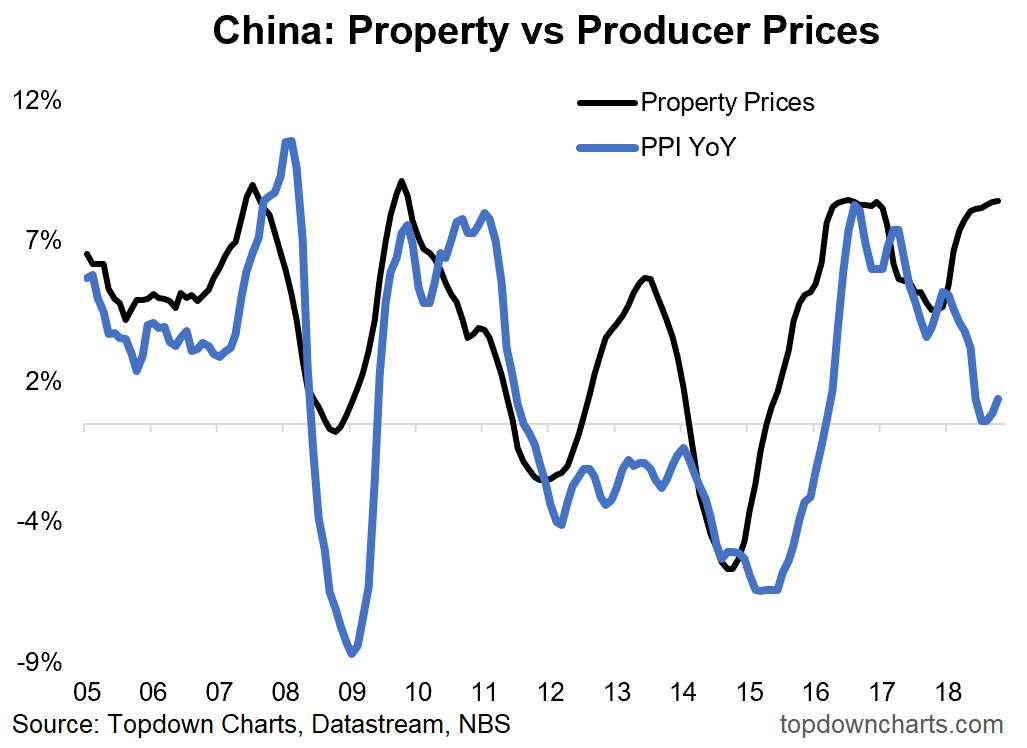
Callum Thomas of Topdown Charts revealed a divergence between China’s property and producer prices. I attribute the strength in property prices to the effects of the stimulus program because real estate is so leveraged and cyclically sensitive. In addition, the nascent uptick in producer prices may also be a hint of a cyclical upturn.
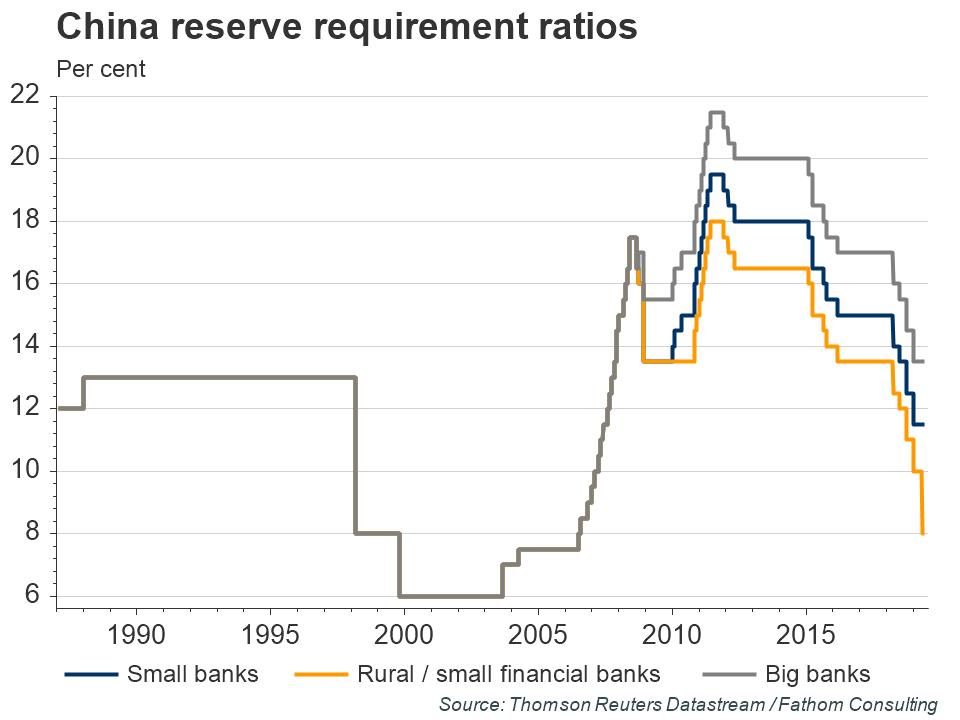
On the surface, China has plenty of stimulus ammunition left. Reserve requirement ratios (RRR) is still relatively high, and there is more room for them to fall.
However, there are challenges to the continuation of the pedal-to-the-metal stimulus program that began in Q4 2018. Central bankers call it the “transmission mechanism”, which in plain English means getting the help into the hands of people who really need it.
The first challenge is credit quality. The authorities recently made a surprise seizure of Baosheng Bank, which had the potential to spook markets. Simply put, investors don’t like to lend money to borrowers to don’t pay it back, and Baosheng’s failure underlines rising credit risk.
In addition, funding costs have recently risen. China’s 1-year yield started falling in Q4 when it began its stimulus program, but it has recently spiked. The rise in the risk-free rate will put pressure on funding costs. While the PBOC could artificially depress costs further, it cannot do so without putting downward pressure on the exchange rate. The only way out of this conundrum would be to begin subsidizing the interest rate expense of borrowers.

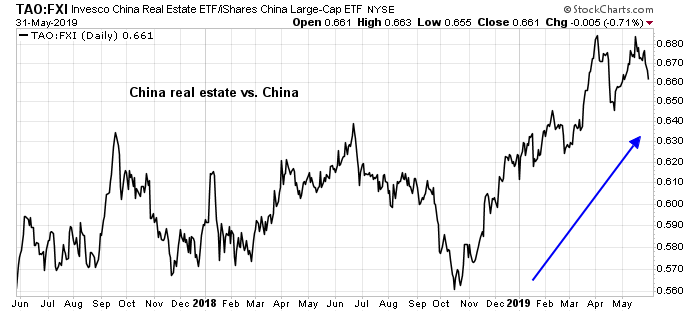
While we have no way of knowing the decisions that affect stimulus policy, we can monitor a real-time indicator of Chinese stimulus by watching the relative performance of Chinese property developers. At a minimum, expect stimulus to continue until the October 70th anniversary celebration of Mao’s founding of the PRC.
A paper tiger with Chinese characteristics
As a response to the Huawei blacklist, Chinese official media has strongly hinted that Beijing would retaliate by restricting rare earth exports. While the value of rare earth exports from China at about $150 million per year is minuscule compared to the size of its overall trade, rare earths comprise an essential element in electronics, and China produce roughly 80% of global output. A total embargo has the potential of to bring the global economy to a screeching halt.
Mao once dismissed America as a paper tiger during the Vietnam War, and he characterized his own revolution as Communism with Chinese characteristics. The rare earths threat is nothing more than a paper tiger with Chinese characteristics. It can only be used once, and it would have devastating blowback for China.
First, the implementation of export restrictions or embargo is difficult. Since rare earths are embedded in many electronic components, do you also ban chip export and the products that contain chips, which would tank the Chinese and global economy? In addition, rare earths are not that rare. There are mines all over the world, all ready to start production.
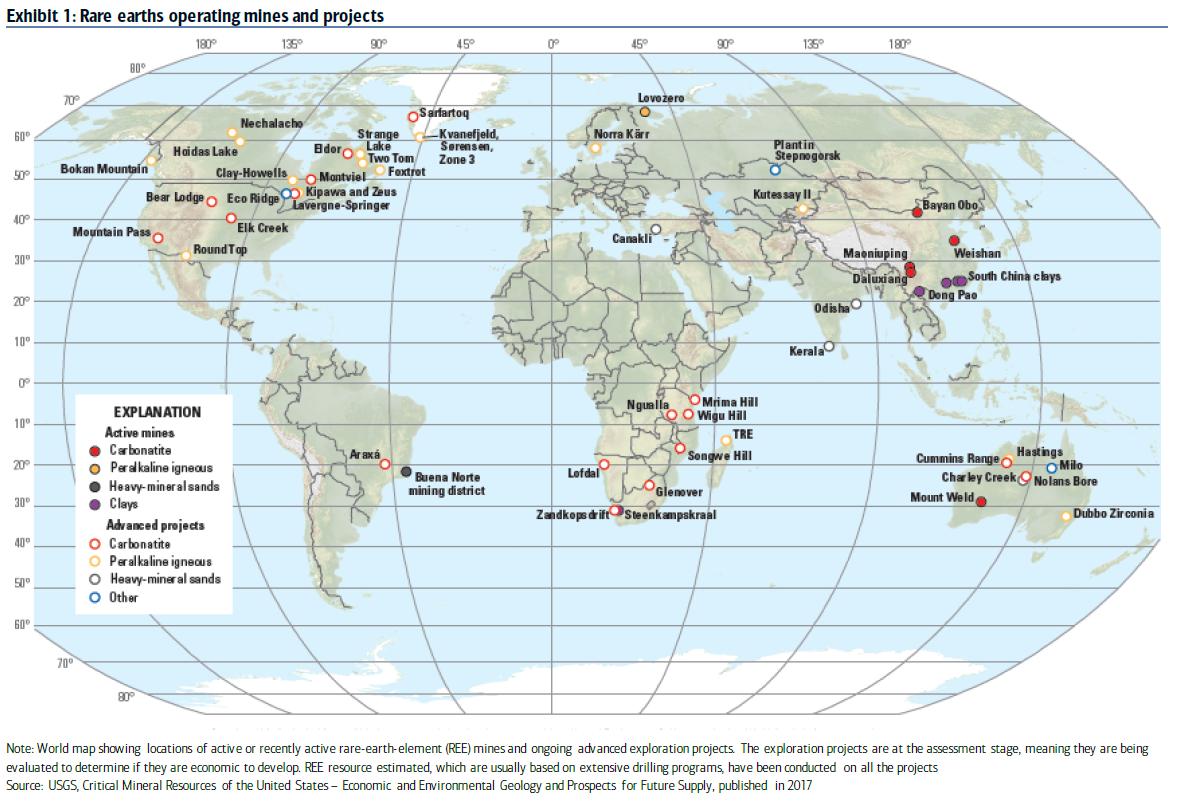
What is “rare” is the environmental costs associated with their extraction process, as described by an article in The Verge:
A group of 17 elements, rare earths are what the USGS (United States Geological Survey) describe as “moderately abundant.” That means they’re not as common as oxygen, silicon, and iron, which make up the vast majority of the Earth’s crust, but some are on a par with elements like copper and lead, which we don’t consider exotic or scarce. Significant deposits exist in China, but also Brazil, Canada, Australia, India, and the United States.
The challenge with producing rare earths (and the reason they were given their name) is that they’re rarely found in concentrated lumps. These are chemically sociable elements, happy to bond with other compounds and minerals and tumble about in the dirt. This makes extracting rare earths from common earth like convincing a drunk friend to leave a raucous party: a lengthy and harrowing procedure.
As Eugene Gholz, a rare earth expert and associate professor of political science at the University of Notre Dame puts it: “Once you take it out of the ground, the big challenge is chemistry not mining; converting the rare earths from rock to separated elements.”
Unlike convincing that drunk friend, though, this process involves a series of acid baths and unhealthy doses of radiation. This is one of the reasons that countries like the US have been more or less happy to cede production of rare earths to China. It’s a messy, dangerous business, so why not let someone else do it? Other factors also helped, including lower labor costs and the existence of Chinese mines that produce rare earths as a byproduct.
China cut off rare earth exports to Japan in 2010, but supply chains readjusted quickly and the embargo was largely ineffectual:
Back in 2010, China stopped exports of rare earths to Japan following a diplomatic incident involving a fishing trawler and the disputed Senkaku Islands. Gholz wrote a report of the fallout from this incident in 2014, and found that despite China’s intentions, its ban actually had little effect.
Chinese smugglers continued to export rare earths off the books; manufacturers in Japan found ways to use less of the materials; and production in other parts of the world ramped up to compensate. “The world is flexible,” says Gholz. “When you try to restrict supplies to politically influence another country, people don’t give up, they adapt.”
He says that although his report examined the rare earth industry as it was in 2010, the “conclusions are pretty much the same” in 2019.
If China did turn off the rare earth tap, there would be enough private and public stockpiles to supply essential sectors like the military in the short term. And while an embargo could lead to price rises for high-tech goods and dependent materials like oil (rare earths are essential in many refining processes), Gholz says it’s highly unlikely that you would be unable to buy your next smartphone because of a few missing micrograms of yttrium. “I don’t think that’s ever going to happen. It just doesn’t seem plausible,” he says.
The rare earths export ban is a paper tiger with Chinese characteristics. It can only be used once. While it may create short-term shocks, global supply chains adjust relatively quickly, and it would only serve to isolate China’s economy from the rest of the world.
Hold the victory dance
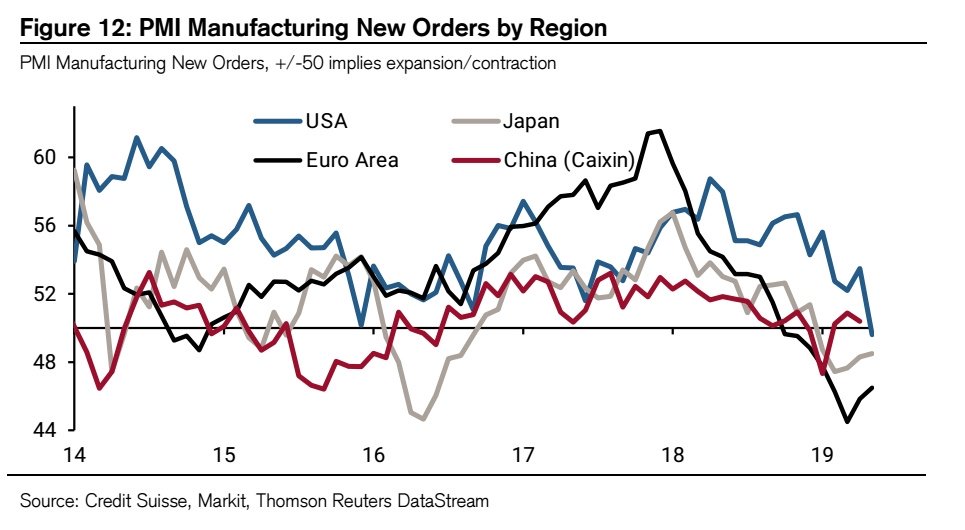
Before Trump et al does the victory dance, I would point out that everyone is hurting from the trade war. Global PMI new orders are falling all around the world, the US included.
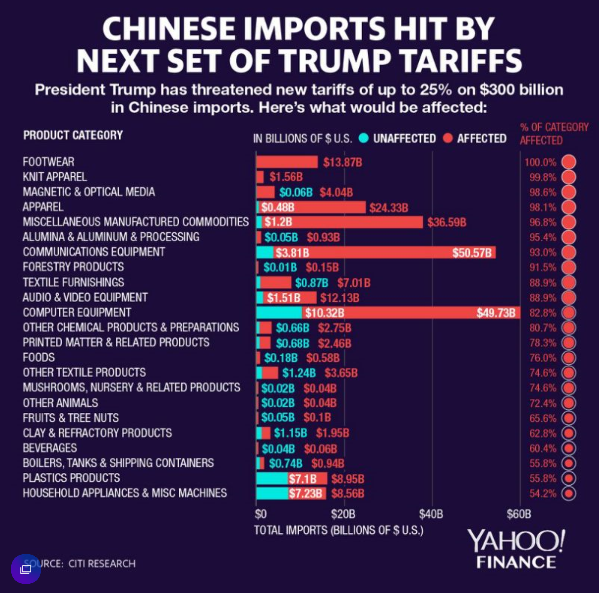
The next round of 25% tariffs on $300 billion of Chinese goods threatened by Trump is going to hit American consumers in the pocketbook. They will also hurt US manufacturers, as many of the tariffs will be on intermediate goods, or inputs, into American made products. This will either raise prices, squeeze margins, or both, and it cannot be a positive step to encourage American manufacturing.
In addition, NBC News reported that Trump’s Huawei ban cause blowback in rural America, which forms the backbone of his political support. Rural telecom providers will have to rip out Huawei equipment and replace it with much more expensive alternatives.
The Trump administration’s ban on goods produced by a Chinese tech giant would seem to have little to do with rural America. But rural cell service providers across the U.S. are almost entirely dependent on the company, Huawei, which produces inexpensive wireless communications equipment.
These small telecom companies now face billions of dollars in costs or the end of their businesses entirely after the Trump administration effectively banned the Chinese company last week over spying accusations.
It is a prospect that could leave vast swaths of rural America with no cell service.
Some senators have proposed relief legislation with funding of up to $700 million, but it won’t be enough:
“We estimated that we needed $800 million to $1 billion for our carriers, but that only covers about a dozen companies,” Carrie Bennet, general counsel for the Rural Wireless Association, told NBC News.
To make a long story short, China is hurting, but it has more room to stimulate. The rare earths threat is overblown, and the equivalent of a last-ditch desperate bluff to blow everyone in the room up with a grenade.
If Trump and Xi are determined to continue the trade war, it will be a contest of who can endure the most pain. Is Xi serious about putting the country through a Long March like deprivation that saw 8,000 of 100,000 troops survive the ordeal? At least he has the advantage of an autocratic regime. As for Trump, he is pressured by his conviction to unwind what he believes to be unfair trading relationships against the re-election imperative in 2020, which will be measured by the stock market and the economy.
I reiterate my assessment in Tariff Man vs. Dow Man:
In the absence of tail-risk, expect Trump to adopt the Tariff Man persona and act tough on China, as well as other trading partners. Should tail-risk appear, either in the form of deteriorating economic conditions, or a market slide, Dow Man will become the dominant persona.
Logic dictates that both sides will eventually come to some kind of face-saving deal. The biggest challenge today will be how each climbs down from the belligerent rhetoric without losing face.
Ironically, Trump’s latest threat to impose an escalating tariff on Mexican imports until illegal migrant crossings are stopped has both bullish and bearish overtones for negotiations. On one hand, it is a detriment a trade deal as no one can be assured that the US would not act arbitrarily in spite of any agreement arrived at in good faith. On the other hand, it could give the Chinese a face-saving way to arrive at a deal. China could not have walked back the last minute changes to the proposed agreement text. The latest Mexican tariff episode will portray Trump as unreasonable. If Xi can craft an agreement with Trump and make him stick to it, Xi will have positioned himself as the strong negotiator and leader.
The week ahead
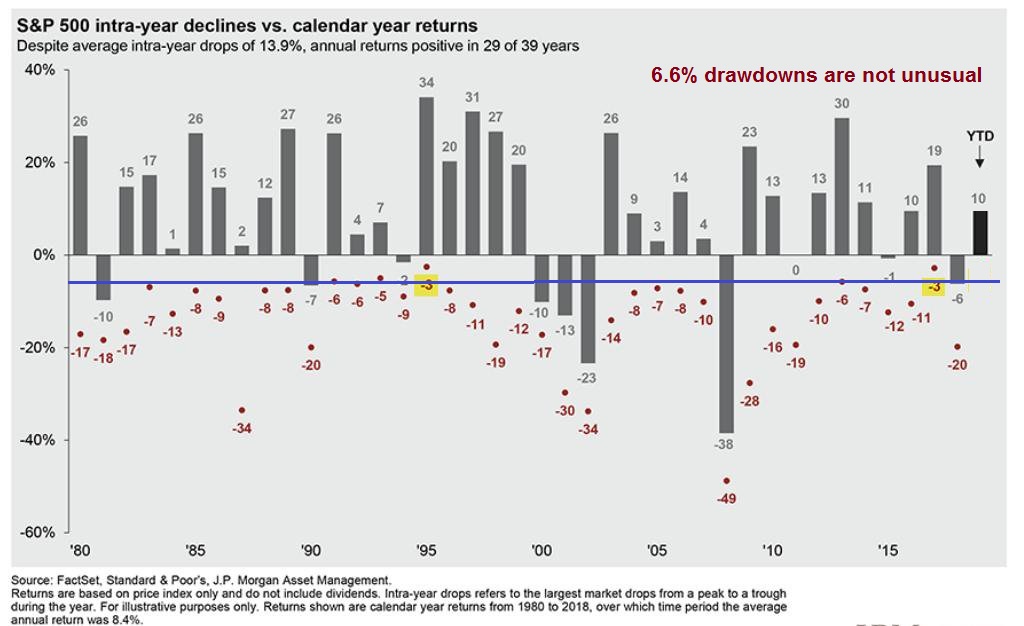
Looking to the week ahead, investors need to take a deep breath and consider the big picture as May was a tumultuous month. The S&P 500 is up 9.8% on a price-only basis for 2019, but down -6.6% from its highs. While drawdowns are always painful and may appear Apocalyptic when you are in the middle of one, 6% losses are not unusual at all from a historical perspective. The market is now oversold, and sentiment is at a crowded short.
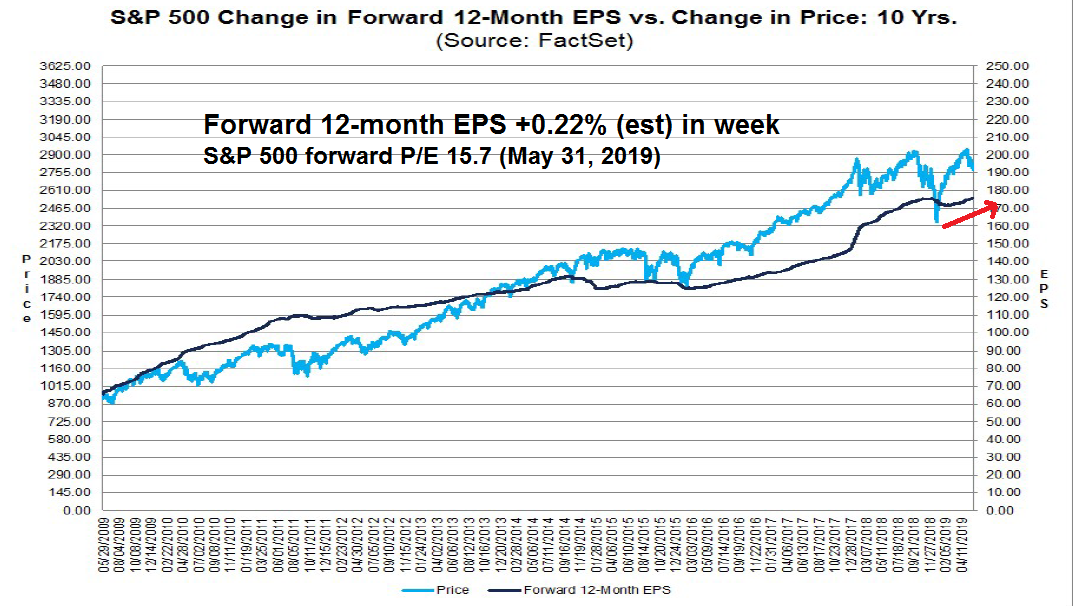
From a fundamental perspective, momentum and valuation are supportive of gains. FactSet reports that the Street is still revising EPS estimates upwards, and valuations are becoming more and more reasonable with the forward P/E at 15.7, which is below its 5-year average of 16.5 and above its 10-year average of 14.8.
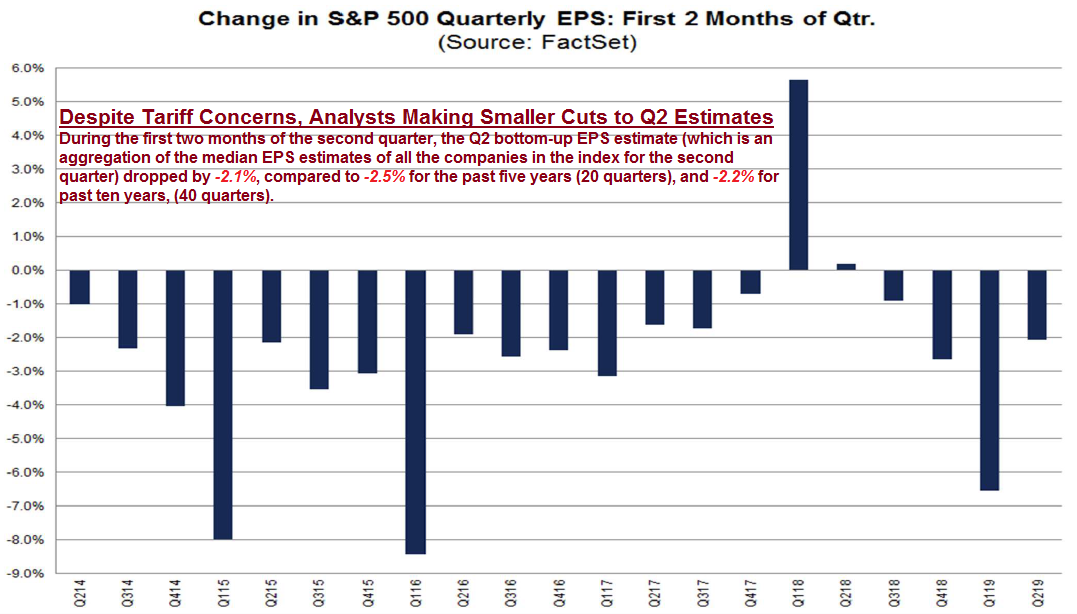
Despite the trade jitters, Q2 estimate revisions are slightly better than the historical averages. To be sure, the bears can validly argue that company analysts will not downgrade their forecasts until they can actually measure the effects of the trade war and quantify them. Strategists using top-down analysis have reduced S&P 500 earnings by about 5% should the next round of 25% tariffs on the remaining $300 billion of Chinese imports.
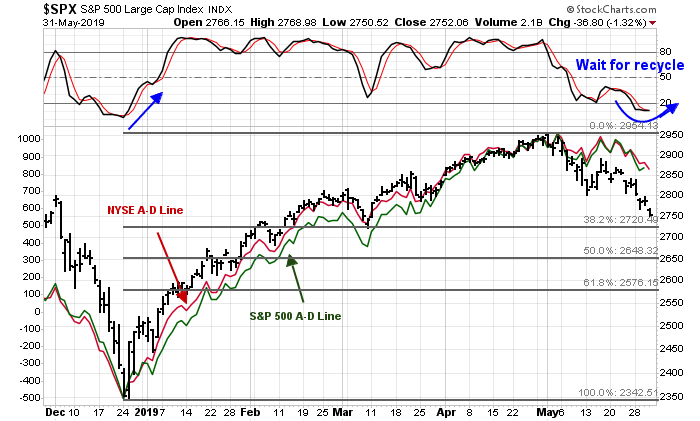
I can see a number of hopeful technical signs for the bulls. The latest decline was not precede by a negative Advance-Decline Line divergence. While this does not mean that the market has no problems, but the lack of a breadth divergence suggests that the current pullback is less likely to develop into a deeper 15-20% loss. The index is oversold, but need to see the stochastics recycle back into the neutral zone before the bulls can confidently jump in. Initial downside support can be found at the first Fibonacci retracement level of 2720, which is about 1% below Friday’s levels.
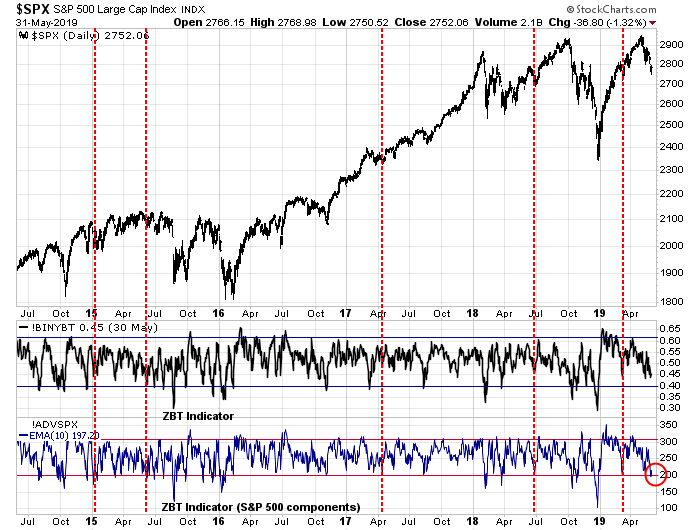
There are numerous signs that the market is oversold. I monitor the Zweig Breadth Thrust Indicator for signs that the market might undergo a bullish stampede. The setup for a ZBT is an oversold condition on the ZBT Indicator. While stockcharts reports the ZBT Indicator with a lag, I have developed my own estimate, based on both the NYSE breadth statistics originally used by Marty Zweig, and my own estimates based on solely S&P 500 components (bottom panel). The SPX ZBT Indicator flashed oversold signals last Wednesday and on Friday. While oversold conditions do not guarantee a ZBT buy signal, all of the past instances in the last five years when the SPX ZBT Indicator was oversold, but the official ZBT Indicator was no, have resolved themselves with short-term relief rallies.
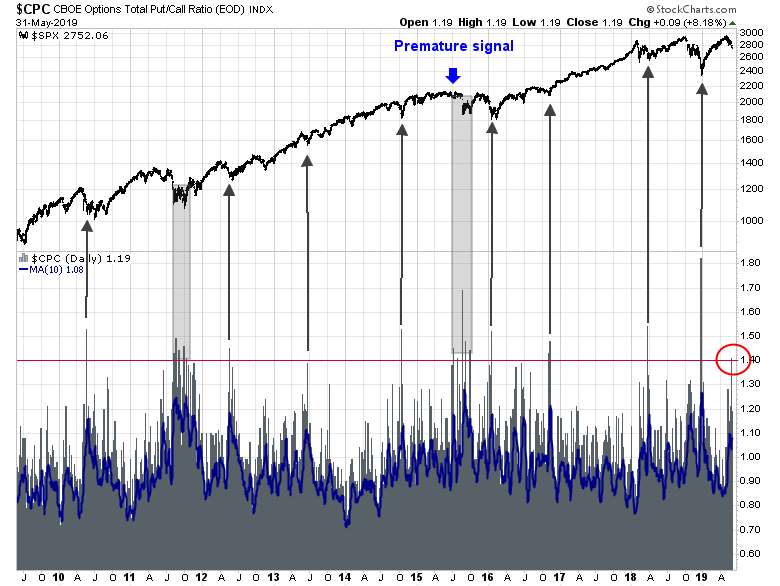
Panic is in the air. The CBOE put/call ratio reached an extreme of 1.40 last week. With only one exception in the last 10 years, all have seen little downside risk and a short-term rally shortly after the signal.
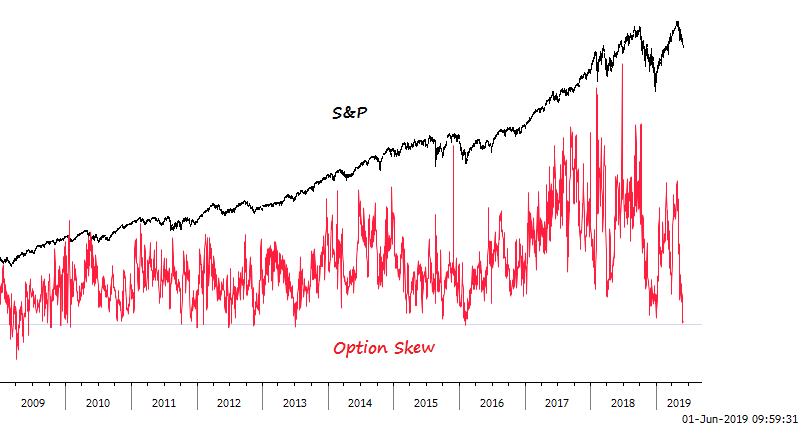
Another example of rising fear can be seen in the S&P 500 option skew. Macro Charts pointed out that this indicator fell to levels just above the readings seen at the 2009 market bottom.
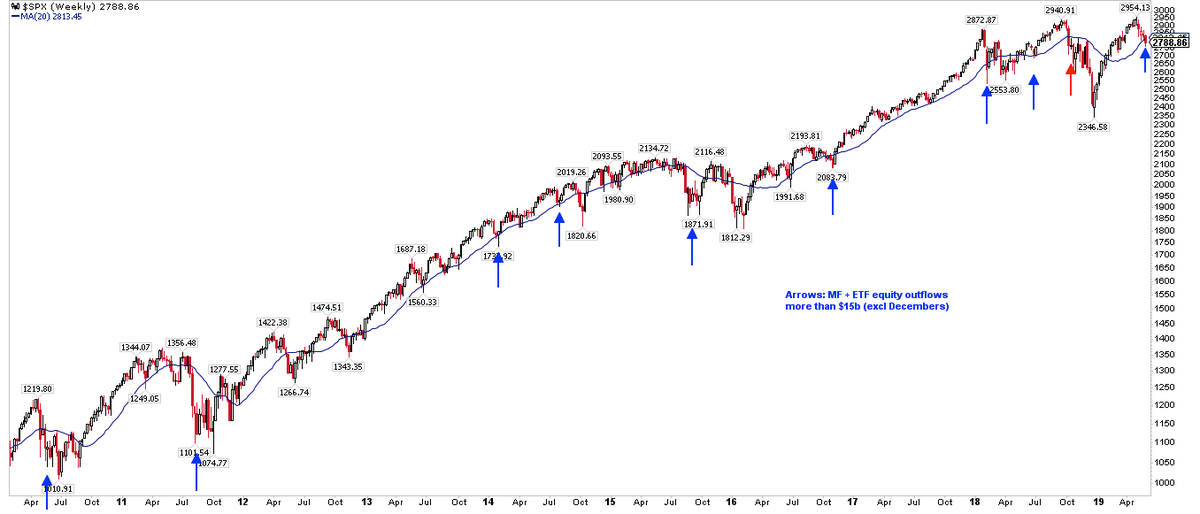
Urban Carmel observed that there was a massive $22 billion outflow from equity mutual funds and ETFs last week. Such events have resolved themselves with a short-term rally of 4% or more, even if the market rolled over afterwards.
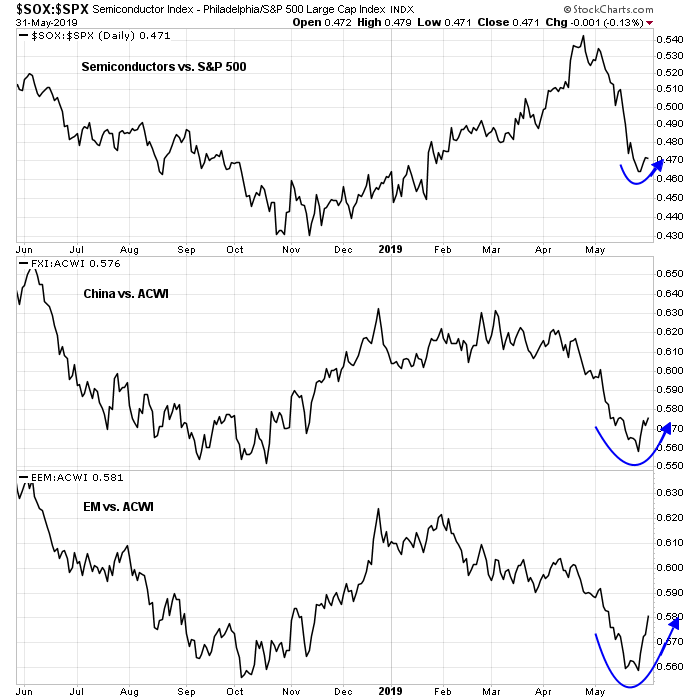
We are also seeing signs of seller exhaustion from market internals. Look at what has been outperforming in the last few days: semiconductors, China, and emerging market equities. These are all parts of the market that are sources of the recent market anxiety. Why are they showing a turnaround in relative strength?
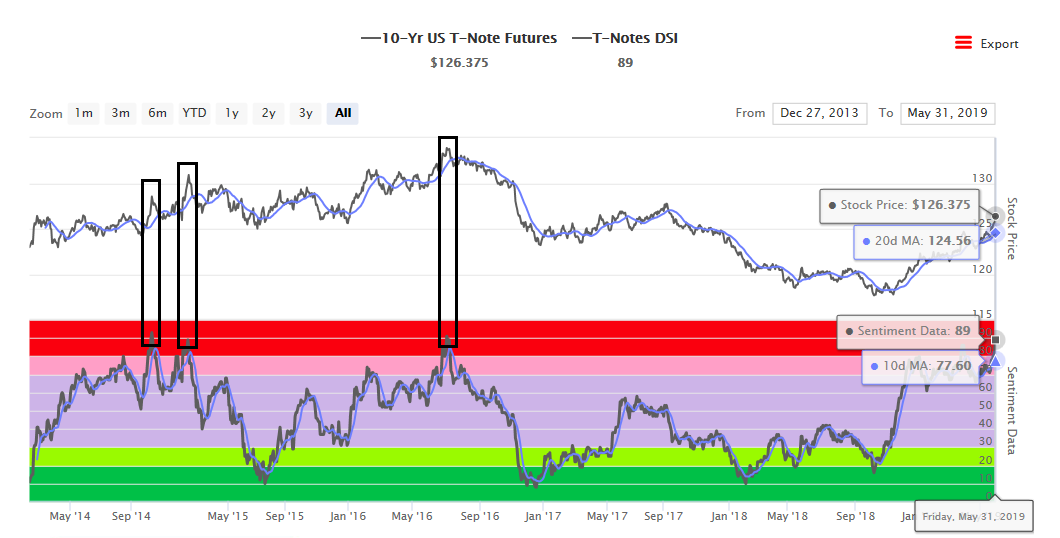
The market stampede into safe havens has been evident. DSI on the 10-year T-Note stands at 92, which is an overbought position that has been resolved with rising rates and price pullbacks.
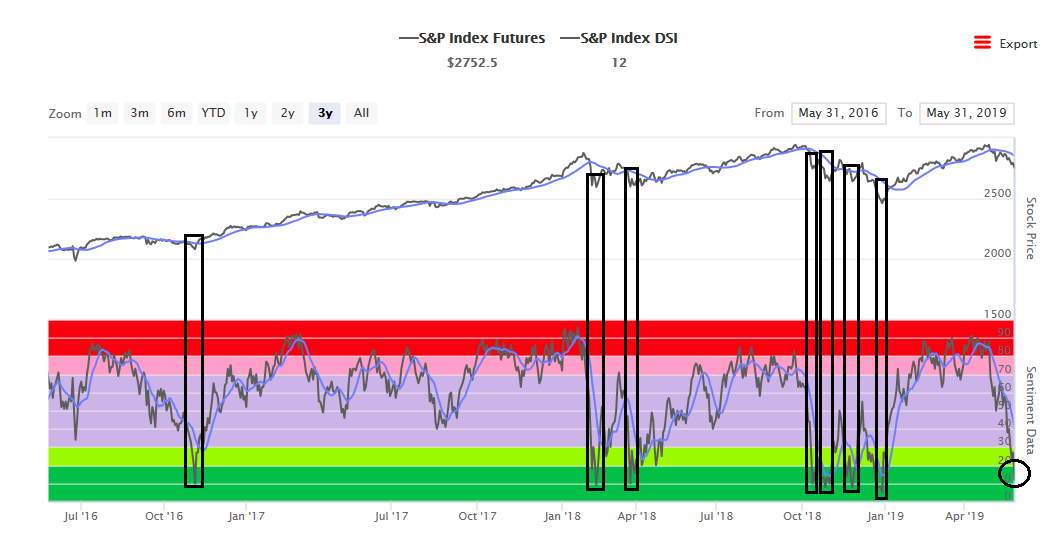
To be sure, oversold markets can become more oversold. The DSI on the S&P 500 is 12, which is oversold, but past bottoms have seen the reading at lower levels.
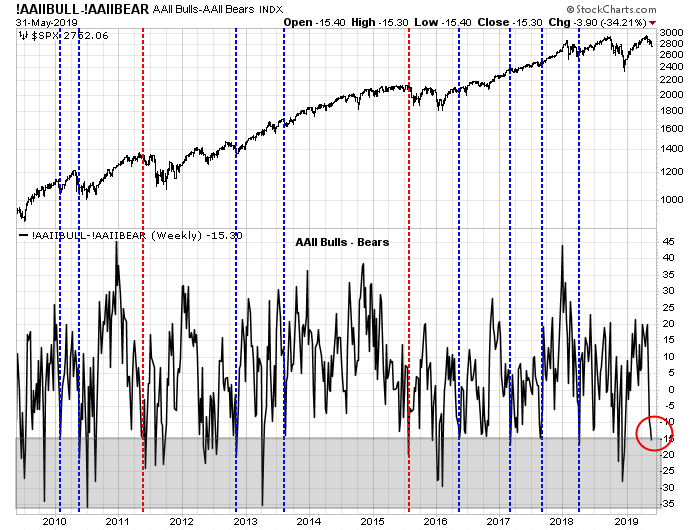
Similarly, the AAII Bull-Bear spread is -15, which is a level where the market has bounced in the past, but sentiment can become even more washed-out. The blue vertical lines mark past episodes which have seen little downside risk and relief rallies, while the red lines mark instances when prices have continued to weaken. In the short run, risk and reward favor the bulls.
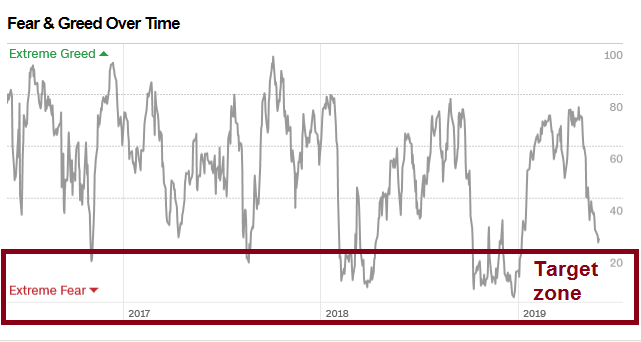
The Fear and Greed Index closed at 24 on Friday, which is above the sub-20 target zone found at past intermediate term bottoms, indicating the market may have some unfinished business to the downside.
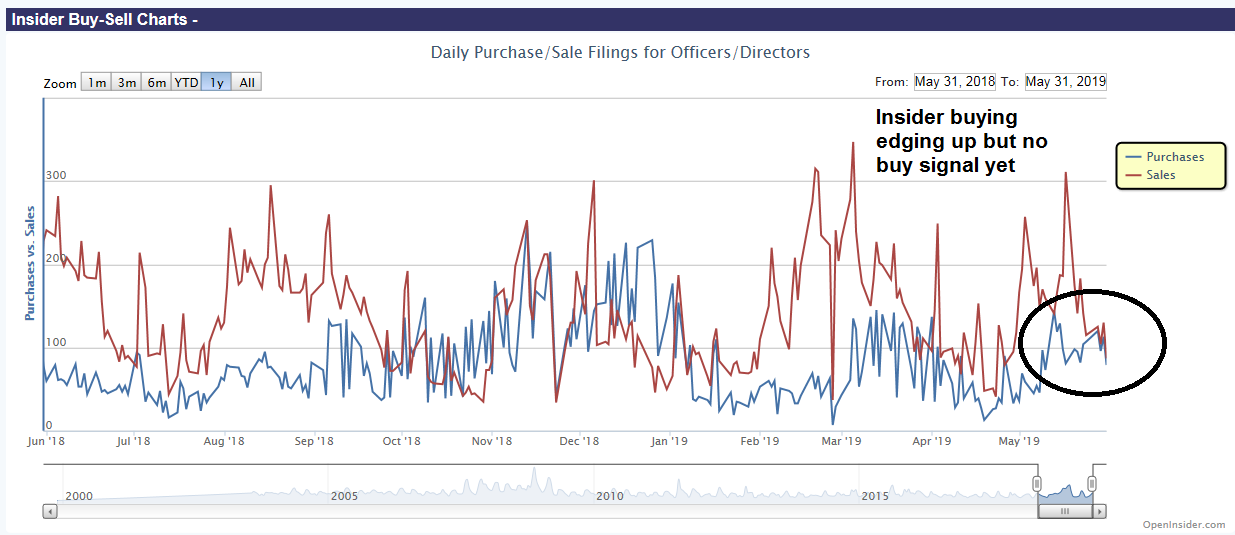
Insider buying is edging up, but readings are neither high enough nor long enough to flash a buy signal.
I interpret these conditions as the market poised for an oversold relief rally, but it may need more time to chop around for a few more weeks before a durable bottom is made. From a technical standpoint, the market appeared to be poised for short-term strength Thursday until the Trump Mexican tariffs derailed the rally. At a minimum, traders should not be initiating new short positions at these levels. Even if you are bearish, wait for a bounce first.
My inner investor is neutrally positioned at his target asset allocation weights specified by his investment policy. My inner trader got caught long in the downdraft, and he is positioned for the relief rally.
Disclosure: Long SPXL, TQQQ
On a more intermediate basis, here is what I’m watching in the factor world to signal the final correction low, Low Volatility and High Beta Indexes. Here is the chart I’ve made.
https://tmsnrt.rs/2XnWtOI
As always with my charts, one can keep the link and it will update every day.
This chart calculates the percentage drawdown from a 90 day high of Low Vol and High Beta.
What I’ve seen in important lows like 2015, 2016 and last December is that the Low Volatility Index does not fall meaningfully along with the High Beta until the final race to the bottom. To me this makes sense. As the market rolls over and starts down, professional money management shifts to the Low Vol stocks like Utilities pushing them up. But when the shit is finally hitting the fan, they fall too. The panicky sentiment consumes everything. You can see that it was until December that Low Vol finally fell 10% in that month.
In the two big down swings in 2015 and 2016, Low Vol fell less in the second. I expect the same here with a lesser fall than the December one. My guess is 5 or 6% in a quick decline.. At the moment it’s down very little.
As Cam is outlining, sentiment indicators are at levels of pessimism associated with market lows. If all was normal things would unfold normally. There is a not insignificant chance that we could experience the first massive ETF washout. If ETF investors decide enmass to sell, it could overwhelm the market systems. Lately there has been high selling of mutual funds and ETFs. It is so easy to decide to sell an ETF. If masses of people all act the same way, the ship can tip over.
Just a thought to keep you up at night. Sorry.
Hi Ken, do you still keep your bullish view for 2019? Appreciate your opinion!
Yes, the Presidential Cycle is always in play. That ends January first 2020 with the S&P 500 above where it was last October first. On the SPY ETF, that is above 293. I bought the SPY January 295 calls on December 24th (cross my heart) but sold them way too soon (with a good profit). They are on my radar again.
My experience is that politicians get the bad things out early (witness current troubles) so that all looks good heading into the election year.
Thanks very much Ken! Hopefully the bottom will be in soon.
Please share your trades, as you see them coming. Thanks.