Preface: Explaining our market timing models
We maintain several market timing models, each with differing time horizons. The “Ultimate Market Timing Model” is a long-term market timing model based on the research outlined in our post, Building the ultimate market timing model. This model tends to generate only a handful of signals each decade.
The Trend Model is an asset allocation model which applies trend following principles based on the inputs of global stock and commodity price. This model has a shorter time horizon and tends to turn over about 4-6 times a year. In essence, it seeks to answer the question, “Is the trend in the global economy expansion (bullish) or contraction (bearish)?”
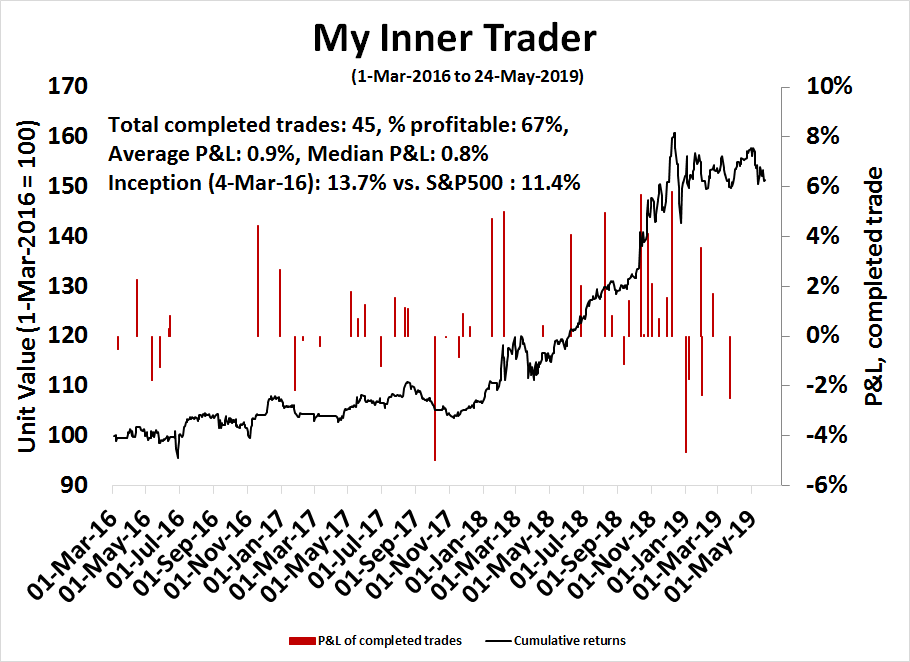
My inner trader uses a trading model, which is a blend of price momentum (is the Trend Model becoming more bullish, or bearish?) and overbought/oversold extremes (don’t buy if the trend is overbought, and vice versa). Subscribers receive real-time alerts of model changes, and a hypothetical trading record of the those email alerts are updated weekly here. The hypothetical trading record of the trading model of the real-time alerts that began in March 2016 is shown below.
The latest signals of each model are as follows:
- Ultimate market timing model: Buy equities
- Trend Model signal: Neutral
- Trading model: Bullish
Update schedule: I generally update model readings on my site on weekends and tweet mid-week observations at @humblestudent. Subscribers receive real-time alerts of trading model changes, and a hypothetical trading record of the those email alerts is shown here.
An unusual market
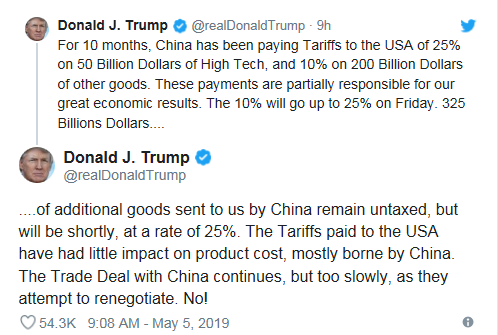
Ever since Trump’s weekend tweet cratered the trade talks three weeks ago, the stock market has behaved in an unusual way.
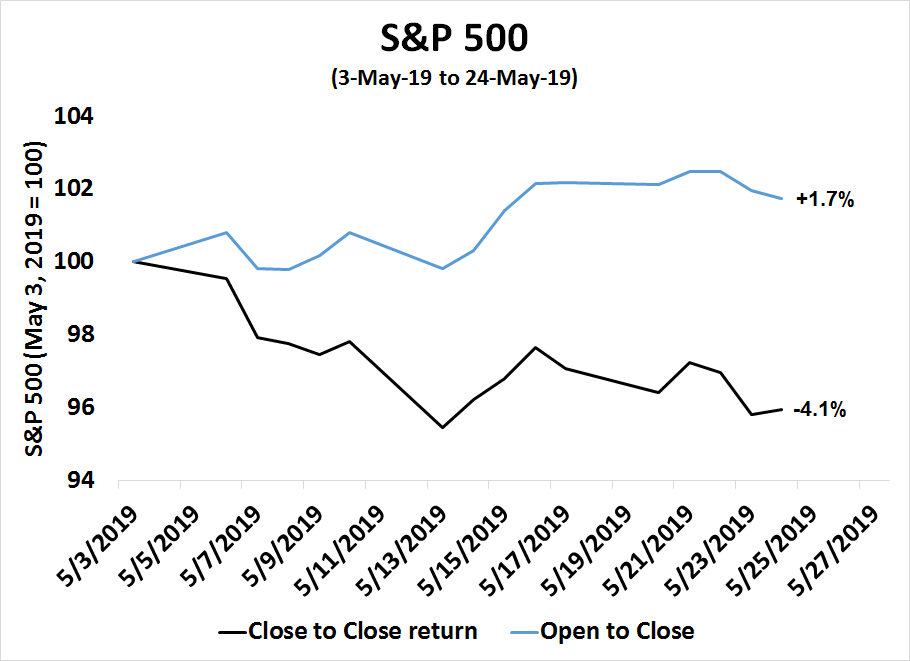
First, it is unusual in that this trade tension induced pullback has been very shallow. Stock prices are less than 5% from their all-time highs despite the heightened trade tension. In addition, the market has been trading in an unusual way. The chart below depicts the returns of the market since the above Trump tweets. While the index (black line) is down -4.1% since that day, the open-to-close return, which shows the returns during the day (blue line), was actually a positive 1.7% during this period. The spread is an astounding -5.8%. During this period, the market had reacted negatively to overnight and weekend news, while strengthening during daytime trading hours.
This is the part one of a two part publication, designed to address the following questions:
- What are the fundamental, macro, and technical factors that are supporting market prices during normal market hours?
- How do we talk about the elephant in the room, namely the risk of a trade war, and how it might turn into Cold War 2.0?
Here is the risk/reward valuation assessment. The market trades at a forward P/E ratio of 16.1, which is below the 5-year average of 16.5 but above the 10-year average of 14.7. Assuming a trade truce, the relief rally would shrink risk premiums and expand P/E to raise prices by up to 5%. Then pencil in a modest 3-4% forward EPS growth rate to year-end, and the total upside price potential to year-end is 8-9%. By contrast, downside risk is 4-8% if trade talks fail, Trump imposes a 25% tariff on remaining Chinese imports, and the tariffs last a year or more. This makes valuations moderately undemanding.
No signs of recession
Let us start with the good news. There are no signs of a bear market inducing recession on the horizon. The Fed has signaled it is prepared to be patient. The latest FOMC minutes revealed that it will view any tariff induced price surges as “transitory”, which reduces the odds of a rate hike in the near future.
The credit markets are showing few signs of stress. Interest rate spreads, from investment grade, to high yield, and emerging market bonds, remain tame.

New Deal democrat monitors high frequency economic indicators by categorizing into coincident, short leading, and long leading indicators. His assessment last week indicates low recession risk, though he added a caveat about policy uncertainty:
Although most measures of the yield curve are screaming “recession,” the overall long-term forecast continues to improve. There’s a contradiction between the increasingly inverted yield curve and the revival in housing due to lower mortgage rates. The short-term forecast deteriorated to slightly negative this week. The nowcast stayed positive.
I continue to suspect that governmental decisions, especially mercurial tariff practices, are blindsiding a significant portion of the economy. Put another way, while I have confidence in forecasting what the economy will do if left to its own devices, it’s far from being left to its own devices at present.
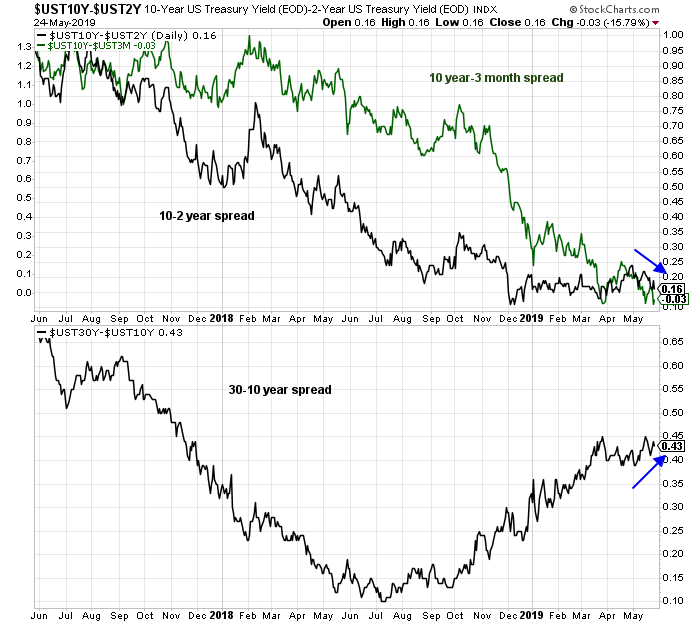
I agree. The yield curve is giving an inconsistent signal. While the 10 year to 3 month spread has inverted, the 2s10s is not inverted though flattening, but the 10s30s is strongly positive and steepening.
The American economy is continuing to grow.
Undemanding valuations
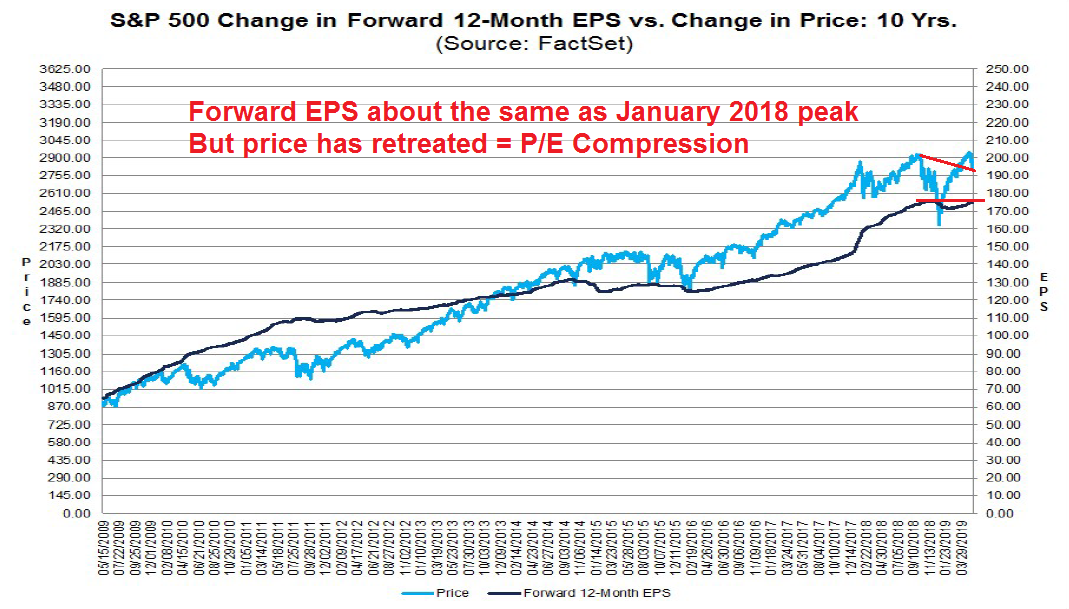
Brian Gilmartin of Trinity Asset Management recently pointed out that the stock market is experiencing P/E compression. Forward 12-month EPS is at roughly the same level as the January 2018 peak, but prices have fallen since then.
Valuations are not particularly demanding. The market trades at a forward P/E ratio of 16.1, which is below its 5-year average of 16.5 but above its 10-year average of 14.7.
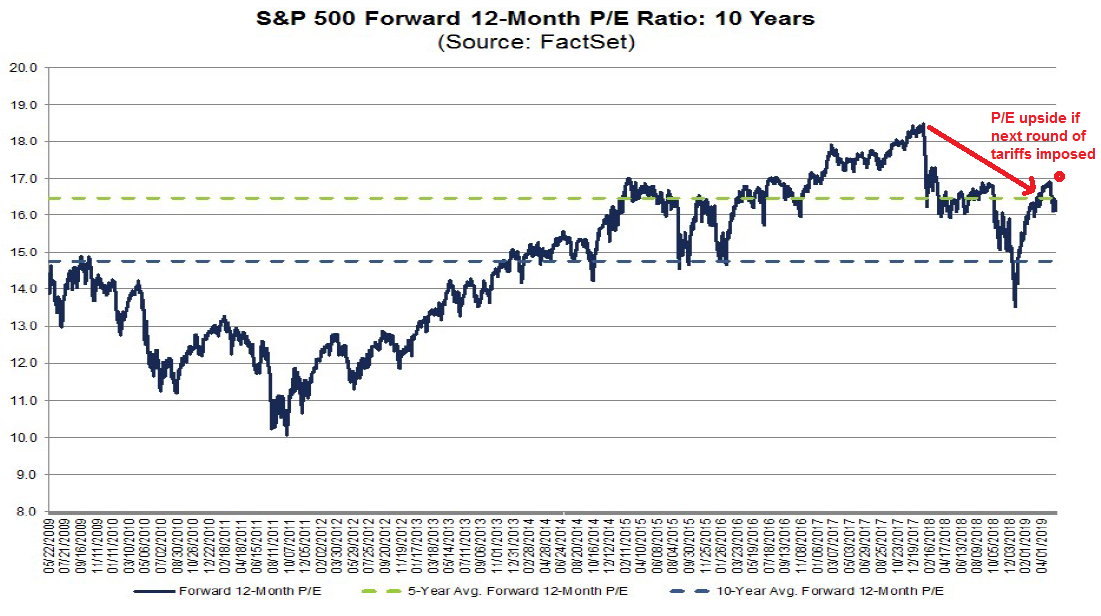
That said, FT Alphaville reported that David Kostin at Goldman Sachs estimates that earnings could decline by up to 6% if a 25% tariff were imposed on all Chinese imports. Based on that estimate, the forward P/E ratio could rise to as much as 17.1, which makes stock prices moderately overvalued, but downside risk is not catastrophic. Assuming forward P/E falls to the 5-year average of 16.5, that puts downside risk at 4%, or 6% if it declines to the current level of 16.1.
Using event study analysis, Neil Dutta at Renaissance Macro separately arrived at a similar answer. He estimates downside risk on the S&P 500 to be about 2600, or 7-8%, if Trump were to impose a 25% tariff on remaining Chinese imports.
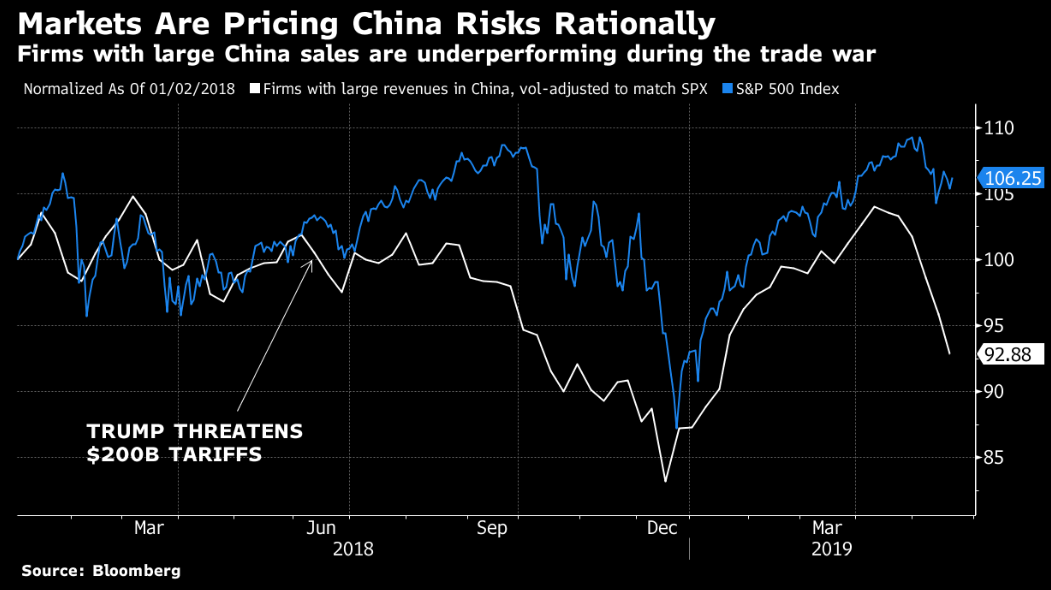
The real question is how much of these trade fears are already in the market. For now, the first-order effects of a trade war seems to be relatively localized. Cameron Crise of Bloomberg News constructed a beta-weighted basket of China sensitive stocks, and found that they underperformed and responded rationally to trade news.
Here is the risk/reward assessment. Assuming a trade truce, P/E expansion could raise prices by up to 5%, assuming that a relief rally normalizes the forward P/E ratio to September 2018 pre-decline level of 17x earnings. The January 2018 peak saw forward P/E of 18.5, which represents even more price gains, but that is not my forecast. Then pencil in a modest 3-4% forward EPS growth rate to year-end, and the total upside potential to year-end is 8-9%. By contrast, downside risk is 4-8% if trade talks fail, Trump imposes a 25% tariff on remaining Chinese imports, and the tariffs last a year or more. This makes valuations moderately undemanding.
A panic attack?
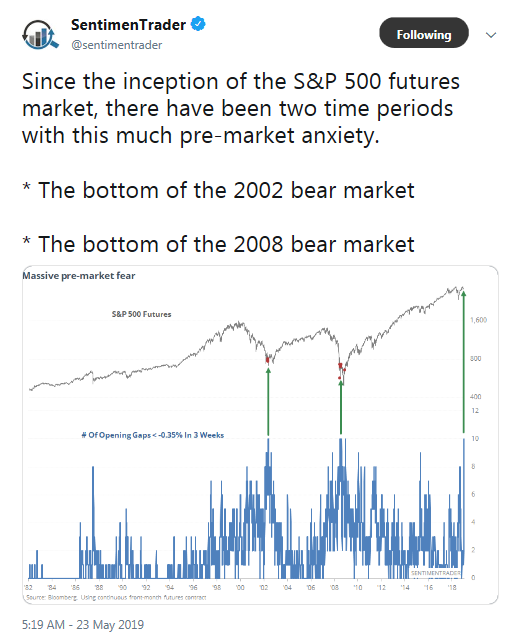
The stock market may just be undergoing one of its period panic attacks that could prove to be a buying opportunity. SentimenTrader observed that the number of overnight downside drops are consistent with conditions seen at the 2002 and 2008 market bottoms.
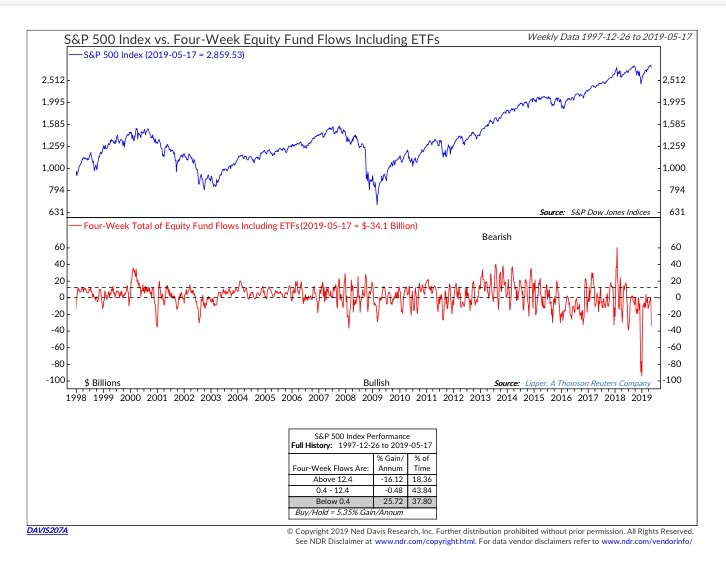
Other sentiment models are flashing bullish signals. Fund flows out of equity mutual funds and ETFs are at an extreme, which has historically been contrarian bullish.
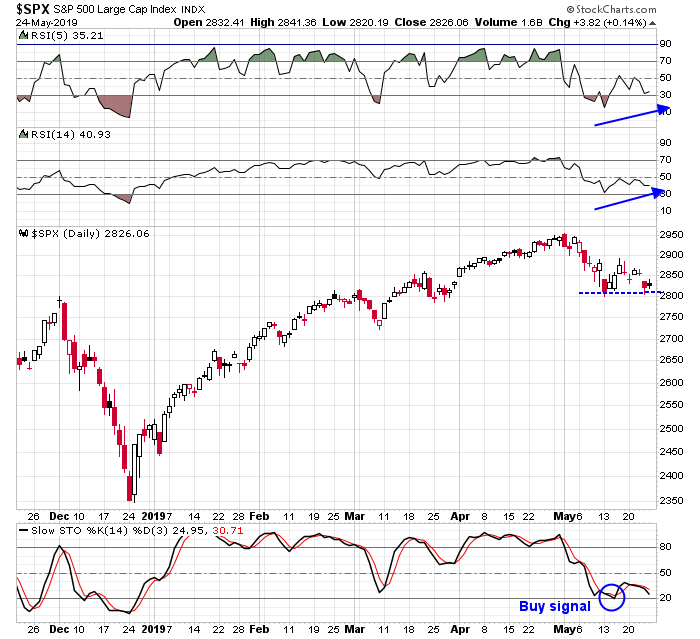
Is this a panic attack to be bought? My former Merrill Lynch colleague Fred Meissner pointed out two contradictory signals in the charts. On one hand, the daily chart shows the stochastics to have recycled to a buy signal. As well, the market is exhibiting positive RSI divergences as it tests the lower end of the range, which should provide some downside support.
On the other hand, the weekly chart is on a sell signal.
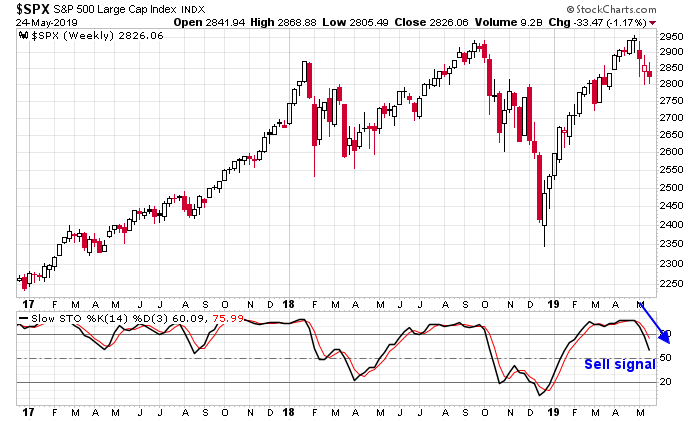
He interprets these conditions as a range-bound market, bounded by 2800 below and about 2900 above. We will not see much clarity on market direction until a decisive breakout either way. In all likelihood, stock prices will remain choppy until the late June Trump-Xi meeting in Japan.
In conclusion, in the absence of trade tensions, the future looks bright for US equities. Macro, fundamental, sentiment, and technical models are supportive of the bull case.
Then there is the elephant in the room. What happens if the Sino-American relationship deteriorate into a full-blown trade war, or worse still, a Cold War 2.0? That will be a topic that I will address in Part II tomorrow.
The week ahead
I will have an assessment of the tactical market outlook in tomorrow’s report. Stay tuned.