Mid-week market update: It appears that the stock market is may be range-bound until Trump and Xi meet in Japan in late June. A high level of uncertainty is the order of the day, with short-term direction will be determined by the latest news or tweet.
As the chart below shows, the range is defined by a level of 2800 on the downside, and 2895-2900 on the upside. From a technical perspective, direction cannot be determined until either an upside or downside breakout is achieved.
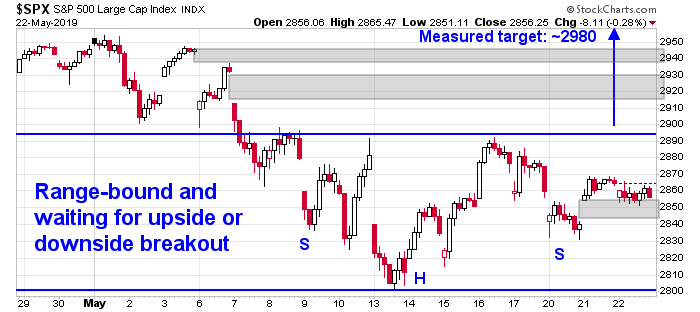
There is some hope for the bulls. The market is forming a nascent inverse head and shoulders formation, with a measured target of 2980 on an upside breakout. As good technicians know, head and shoulders formations are not complete until the neckline breaks. The current pattern can only be interpreted as a setup that may fail.
The presence of unfilled gaps both above and below current levels do not give any hint on likely direction. However, the market is giving a number of bullish clues from a technical perspective.
Breadth and sentiment support
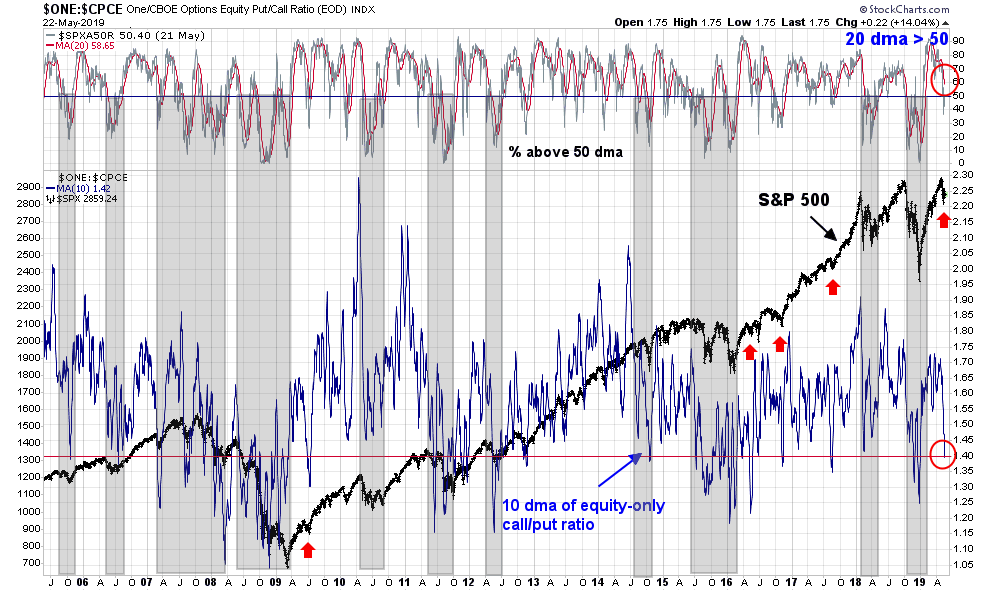
The combination of breadth and sentiment are supportive of a bullish resolution. The top panel of the chart below depicts the % of stocks above their 200 day moving average (dma). I have drawn the line at 50% as a way of delineating major bull and bear phases for the last 15 years. The bottom panel shows the 10 dma of the equity-only call/put ratio (CPCE), or the inverted put/call ratio for easier analysis. The 10 dma of CPCE fell below 1.40, which is an indication of high fear. Past instances of low CPCE that were not in bear phases (shaded regions) were always resolved with a V-shaped rebound.

Here is the same analysis, but using the % above the 50 dma as a way of defining more minor pullbacks. As this indicator tends to be more noisy, I applied a 20 dma filter on that indicator (red line) to define bull and bear phases. Even though the daily % above 50 dma did briefly fall below the 50% line, both the current reading and the 20 dma are above 50%, indicating the lack of a broadly based breadth support for even minor weakness.
Here are the conclusions from both of these studies:
- The market is not in a bear phase, regardless of how it is measured
- Non-bear high fear episodes have seen quick market rebounds
There are several caveats to this analysis. First, never say “never” in any historical study because the real-time resolution can surprise you. The current macro backdrop carries a high level of event risk, and a breakdown in trade negotiations could result in a full-blown trade war that could crater the global economy and stock prices. That said, I cautiously interpret these results as the risk/reward is tilted to the upside, based purely on technical and sentiment analysis.
There is also some short-term support for the bull case. I wrote on the weekend (see Tariff Man vs. Dow Man) that one of the challenges for the bulls was to break the pattern of lower lows and lower highs on short and medium term breadth indicators. Tuesday’s market rally managed to break this pattern.
These is the short (3-5 day) breadth pattern from Index Indicators as of Tuesday’s close. Based on today’s market action, readings are likely to experience some deterioration, but they should not be serious.
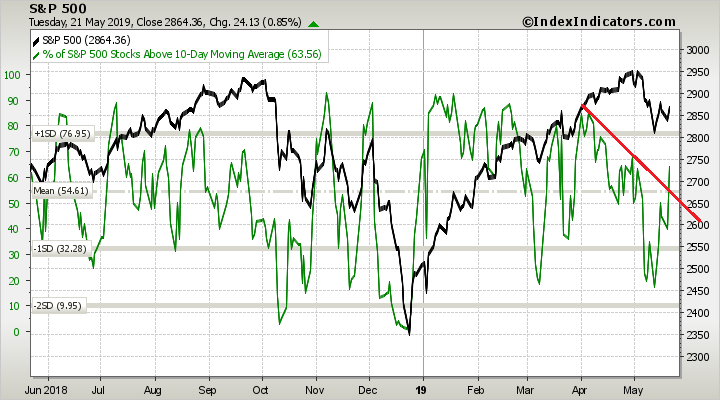
The longer term (1-2 week) breadth pattern tells a similar story.

My inner trader is keeping an open mind on how the market may break, but he is maintaining his bullish lean on the market.
Disclosure: Long SPXL, TQQQ
Bottoming? Does this signal have any prediction value?
https://twitter.com/sentimentrader/status/1131535024052985861
Cup and Handle in $USDCNH projects to 7.5+.
https://twitter.com/PeterLBrandt/status/1131357976822861824