Preface: Explaining our market timing models
We maintain several market timing models, each with differing time horizons. The “Ultimate Market Timing Model” is a long-term market timing model based on the research outlined in our post, Building the ultimate market timing model. This model tends to generate only a handful of signals each decade.
The Trend Model is an asset allocation model which applies trend following principles based on the inputs of global stock and commodity price. This model has a shorter time horizon and tends to turn over about 4-6 times a year. In essence, it seeks to answer the question, “Is the trend in the global economy expansion (bullish) or contraction (bearish)?”
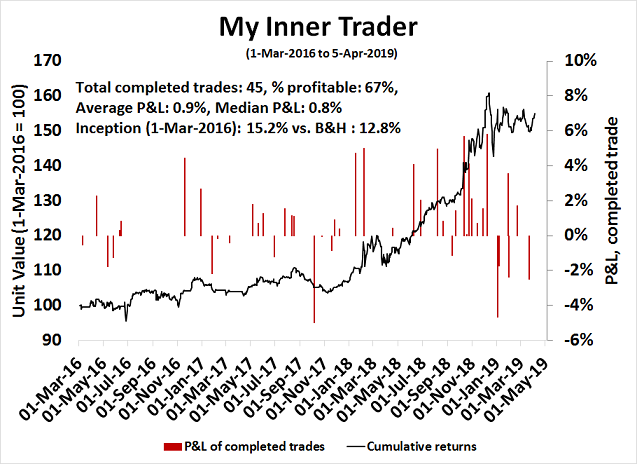
My inner trader uses a trading model, which is a blend of price momentum (is the Trend Model becoming more bullish, or bearish?) and overbought/oversold extremes (don’t buy if the trend is overbought, and vice versa). Subscribers receive real-time alerts of model changes, and a hypothetical trading record of the those email alerts are updated weekly here. The hypothetical trading record of the trading model of the real-time alerts that began in March 2016 is shown below.
The latest signals of each model are as follows:
- Ultimate market timing model: Buy equities
- Trend Model signal: Bullish
- Trading model: Bullish
Update schedule: I generally update model readings on my site on weekends and tweet mid-week observations at @humblestudent. Subscribers receive real-time alerts of trading model changes, and a hypothetical trading record of the those email alerts is shown here.
Opportunities from uncertainty
Now that stock prices have recovered to within 2% of their all-time highs, what’s next for the stock market? To be sure, stock prices are no longer cheap. FactSet reports that the market is trading at a forward P/E ratio of 16.7, which is just above its 5-year average of 16.3 and well above its 10-year average of 14.7.

Should investors throw in the towel? Not yet. While valuations are not compelling, equities remain in a sweet spot as cautious long-term sentiment readings can drive prices higher.
Strategas published a terrific analysis showing how forward US equity returns have historically been higher when global policy uncertainty is high. While the sample size for this study is small, it is consistent with the contrarian principle of buying when blood is running in the streets.
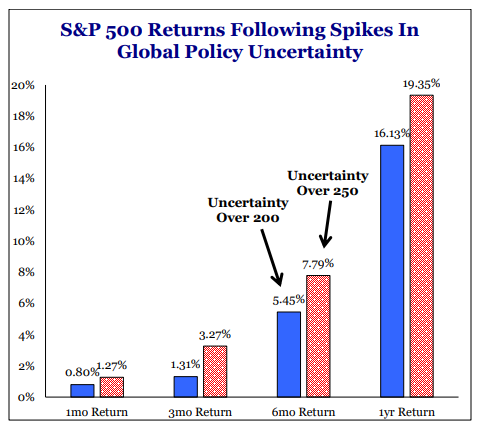
Indeed, the latest reading of global policy uncertainty shows that it remains at an elevated level.
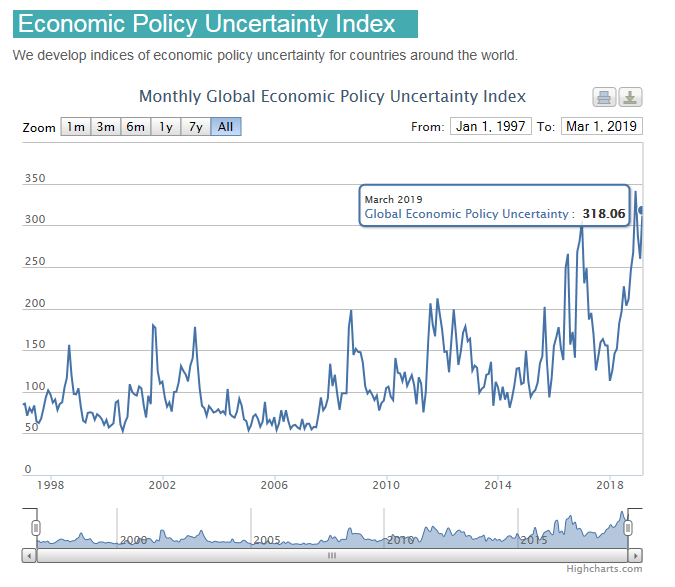
Despite the elevated valuation, equities find themselves in an unexpected sweet spot. There is still room for stock prices to rise as tensions and risk levels fade.
The Mexico border climb-down
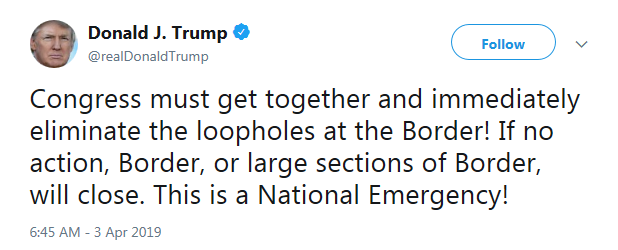
The good news is, risk levels are fading. President Trump threatened to immediately close the border with Mexico if the Mexican government didn’t act, or if Congress didn’t act to control illegal border crossings. This week, he climbed down from his threat to close the border right away by giving Mexico a year to mitigate border crossings, or he would either close the border or put tariffs on autos crossing the border.
Fed nomination controversies
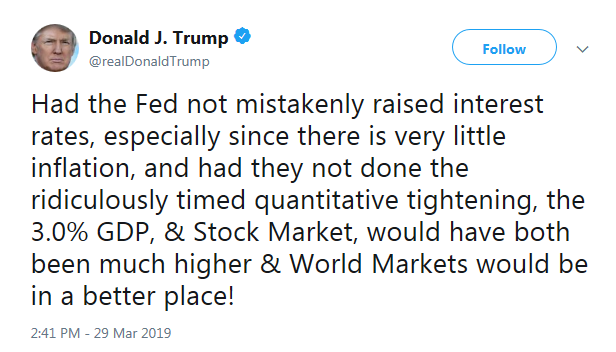
At the same time, Trump had been pressuring the Fed to pursue an easier monetary policy and cut rates.
That tweet was followed by a CNBC interview with economic advisor Larry Kudlow, who called for the Fed to immediately cut by 50bp.
Top White House economic advisor Larry Kudlow wants the Federal Reserve to “immediately” cut interest rates by 50 basis points.
“I am echoing the president’s view — he’s not been bashful about that view — he would also like the Fed to cease shrinking its balance sheet. And I concur with that view,” Kudlow told CNBC on Friday.
“Looking at some of the indicators — I mean the economy looks fundamentally quite healthy, we just don’t want that threat,” he added. “There’s no inflation out there, so I think the Fed’s actions were probably overdone.”
After Friday’s better than expected March Jobs Report, Trump repeated his call for the Fed to cut interest rates. He went further and said the Fed should stop its quantitative tightening program and begin quantitative easing.
Trump nominated Stephen Moore and Herman Cain to fill the two open seats on the Board of Governors of the Federal Reserve. The only common element between the two candidates is they have been strong supporters of Trump policies in the past, as well as past hard money advocates.
Moore penned a recent WSJ Op-Ed entitled “The Fed Is a Threat to Growth”, subtitled “The real economy is ready to reignite, but Powell’s tight-money policy is acting like a wet blanket”, which summarizes his views well, However, his views on low interest rates appears to be a function of what year it is (and presumably the party in control of the White House at the time).
From the New York Sun, April 24, 2016: “A second reason for the business investment slump is monetary policy. While this may not be the right time for rate hikes, ultra-low interest rates have led to financial engineering rather than the deployment of excess corporate cash for productivity enhancing investments.”
From an interview with Brian Lehrer, April 3, 2019: “On balance I think low interest rates are a good thing. They mean that businesses can invest and borrow at low prices. It means that if you want to buy a home – I always tell people my gosh this is the golden age to buy a home, Brian…So I don’t have a problem with low interest rates”.
Establishment economists have been aghast at Moore’s nomination. He was not trained as an economist, Instead, he spent most of his professional life as an economic commentator on tax policy. Even Greg Mankiw, who was Bush 43’s CEA chair, took the unusual position of publicly opposing Moore’s confirmation due to his lack of qualification and partisanship.
A couple of weeks ago, I gave a talk at the Federal Reserve Bank of Dallas. I said that, although I am not a fan of President Trump, I have to give him credit for making good appointments to the Fed. I was thinking about people like Jay Powell, Rich Clarida, and Randy Quarles.
Then today the president nominates Stephen Moore to be a Fed governor. Steve is a perfectly amiable guy, but he does not have the intellectual gravitas for this important job. If you doubt it, read his latest book Trumponomics (or my review of it).
It is time for Senators to do their job. Mr. Moore should not be confirmed.
In an interview with Bloomberg TV, Moore was asked about his view on the correct size of the Fed’s balance sheet (starts at about 11:00). Moore replied, “To be honest, I’m going to have to study up on this one”. In reality, he had authored a 2014 Heritage Foundation paper, Quantitative Easing, The Fed’s Balance Sheet, and Central Bank Insolvency addressing this very issue.
Another common element between Moore and Cain is both are hard money advocates. In September 2015, Moore voiced his support for getting rid of the Federal Reserve and returning to a gold standard (click this link if the video is not visible).
Herman Moore’s credentials are a little bit more mainstream. He was on the board of directors of the Kansas City Fed from 1992 to 1996, eventually becoming the chair, though his role had little to do with monetary policy. Like Moore, Cain is a strong Trump supporter. He co-founded the America Fighting Back PAC. The home page tells the story of the PAC’s political leanings.

It is puzzling that Trump would choose to nominate Herman Cain to be a Fed governor, because the entire history of Cain’s approach is contrary to Trump’s favor of low interest rates. Cain has always been a hard money advocate, and he has strongly believed in a gold standard. He penned a WSJ Op-Ed in 2012 calling for its adoption:
Article I, Section 8 of the Constitution grants power to Congress “to coin Money, [and] regulate the Value thereof.” But for the last 40 years in Washington, regulate has meant manipulate, with the Federal Reserve raising and lowering interest rates and buying and selling assets at its own discretion. All of this manipulates the value of the dollar. We regulate time by making sure an hour is always a fixed quantity of minutes and a foot is always a fixed quantity of inches. The more complex a society, the more it depends on fixed and rigorously reliable standards. A dollar should be defined—as it was prior to 1971 under the postwar Bretton Woods system—as a fixed quantity of gold.
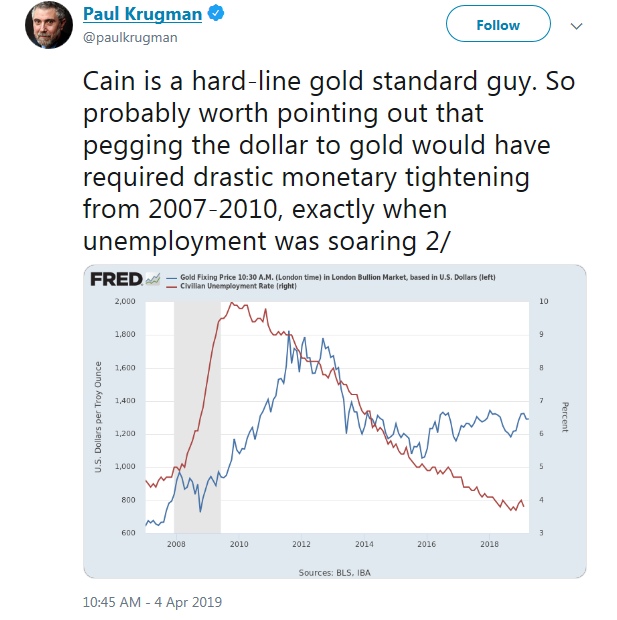
Paul Krugman cited just one recent example of the dire effects of a gold standard straitjacket.
To be sure, Herman Cain was never the sort of “low interest guy” that Trump favors. In a recent editorial, while Cain was supportive of Trump’s policies, he also justified rising rates that accompanies higher economic growth as “a good thing”.
The main thing to understand is that economic activity is picking up, and that’s what’s driving the rise in interest rates. Retail activity has turned out much stronger this holiday season than economists were predicting. Jobless claims are down. Business investment is up. And a tax cut is coming within days.
The first year of the Trump Administration has not produced everything we wanted, but the overall economic performance has been triumphant, and we’re just getting started. That’s why interest rates are rising, and that’s why you should understand it’s very good news.
While many market participants may find Trump’s attempt to politicize the Fed to be disturbing, the purpose of these pages is not to discuss what should happen, but the market implications of likely events and policies. While Trump may believe that Moore and Cain could act as counterweights to Powell’s hawkishness, Moore will likely become a conditional dove (when a Republican occupies the White House) and Cain is an uber-hawk and anti-inflation fighter. If both are confirmed, their views will offset each other.
Reflationary surprise ahead?
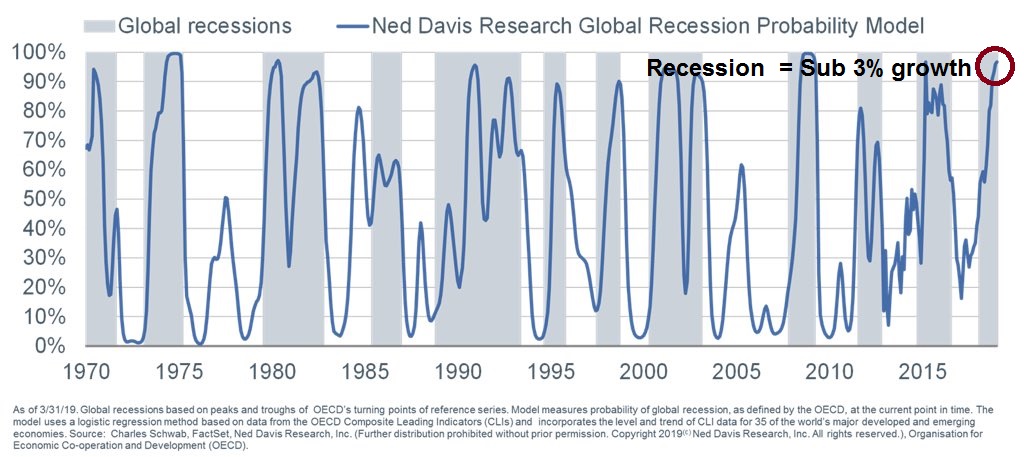
In the meantime, global central bankers have all gone on pause as the risk of a global slowdown is rising. The Fed has turn to “patience” as a mantra, citing the combination of slower growth and uncertainties from abroad. The NDR Global Recession Model shows a high likelihood of recession, which is defined as sub-3% growth, and not the same way as US recessions.
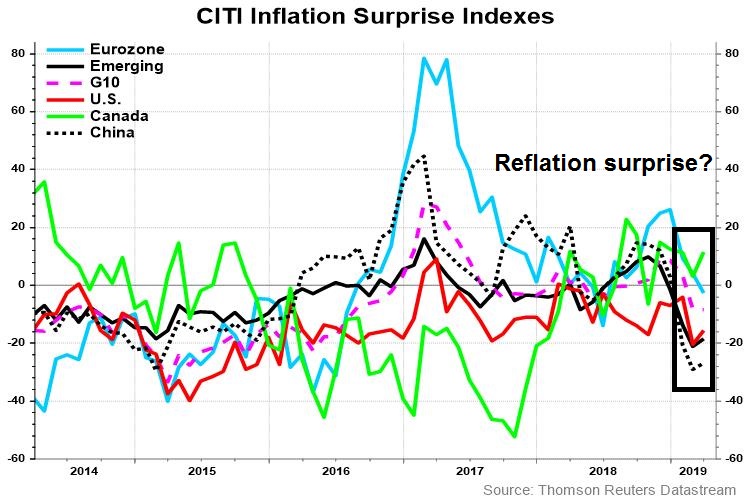
However, the world may be in for a rebound. The better than expected PMI from China, upbeat ISM, and better than expected March Employment Report, which I forecasted (see A March Jobs Report preview) are foreshadowing a possible global reflationary surprise.
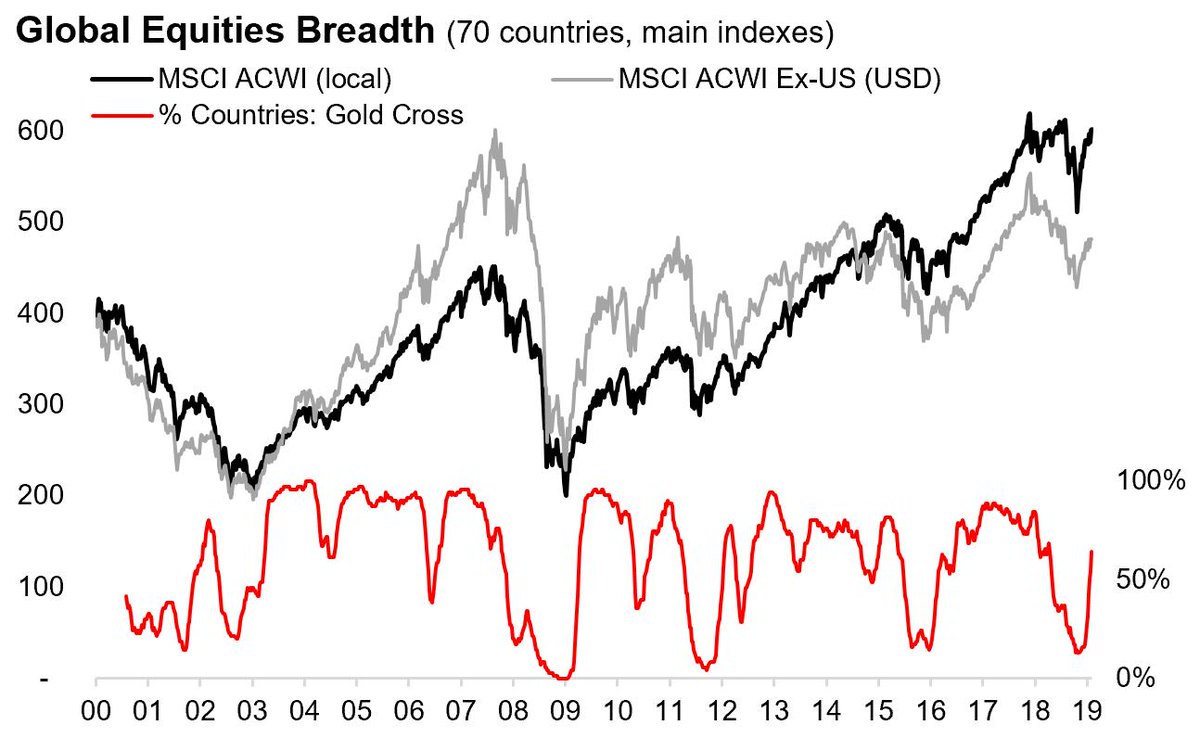
The behavior of global stock prices is supportive of the global reflationary thesis. Callum Thomas recently observed that the incidence of “golden crosses”, a condition where the 50 dma rises above the 200 dma as signals of improving stock indices trends, is rising all around the world.
As well, analysis from Yardeni Research indicates that forward 12-month estimates have bottomed and they are rising across all market cap bands, indicating positive fundamental momentum.

Even the Atlanta Fed’s GDPNow nowcast of Q1 GDP growth has recovered to 2.1% from a near zero reading in March.
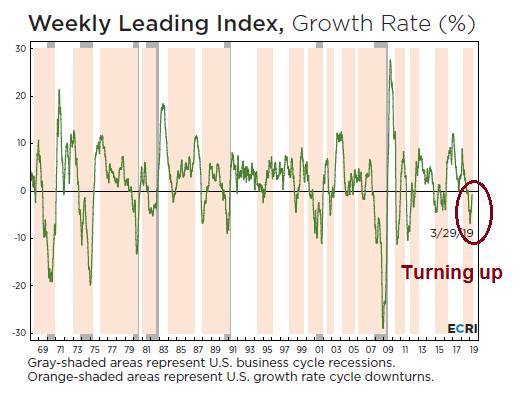
The ECRI’s Weekly Leading Index is also turning up, though readings remain in negative territory.
Investment implications
I have written before about the excessively defensive posture of institutional managers. State Street sentiment, which is derived from the actual holdings of US managers and what they do with their money, shows a high degree of cautiousness.

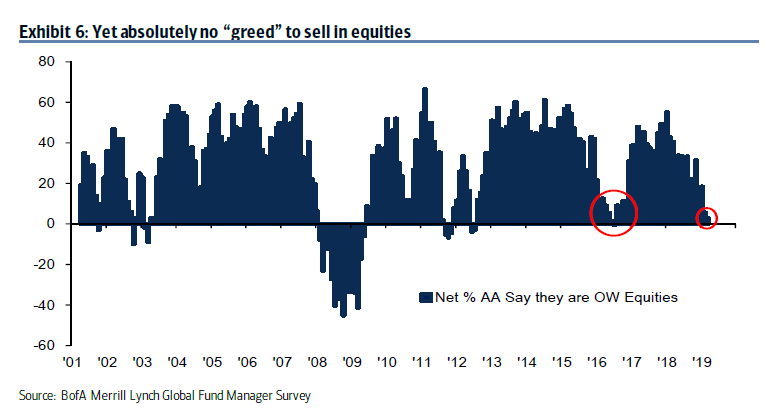
The BAML Fund Manager Survey of global institutional managers also indicate a historically low weighting in equities.
There are other indicators of sentiment, each measuring a different constituency. The Commitment of Traders measures futures traders and fast money hedge funds, NAAIM measures RIAs serving retail investors, and AAII weekly sentiment measures mostly individual day and swing traders. What matters the most to long-term sentiment is institutional investor positioning. While these behemoths move at a glacial pace, their big money flows, once started, can persist for months and quarters, and therefore they are best when forecasting the long-term outlook. Right now, institutions are very cautious. At a minimum, that should put a floor on any corrections as the breadth of any selling should be limited.
In short, the combination of overly defensive institutions in an environment that is coming out of a growth scare, and falling policy uncertainty puts equities in an unusual sweet spot. A turnaround after a period of excessive pessimism creates the conditions for a FOMO rally of risky assets. I expect equity prices will be considerably higher by year-end.
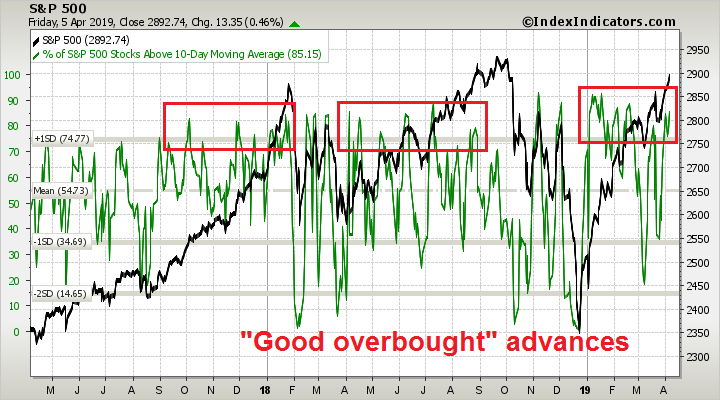
The week ahead: “Good overbought” advances
Looking to the week ahead, the stock market appears to be repeating the pattern of grinding up while flashing a series of “good overbought” readings on RSI-5, only to see the advance stall when RSI-14 reaches the overbought level of 70. The Index is now testing the upper end of a rising channel, while RSI-14 is overbought, indicating a high likelihood of a minor pullback early in the week.

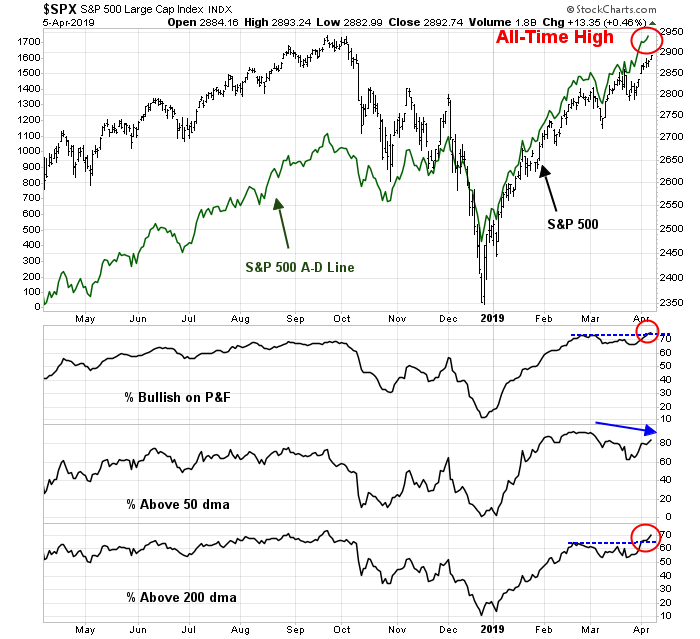
Breadth indicators are generally constructive for the bull case. The S&P 500 Advance-Decline Line made another all-time high Friday, which is a positive sign of bullish breadth. Two of the other three breadth indicators are bullish, with % bullish and % above the 200 dma advancing to fresh recovery highs as stock prices rallied. Only the % above the 50 dma flashed a negative divergence. I interpret these conditions as long-term bullish, but a pullback can happen at any time.
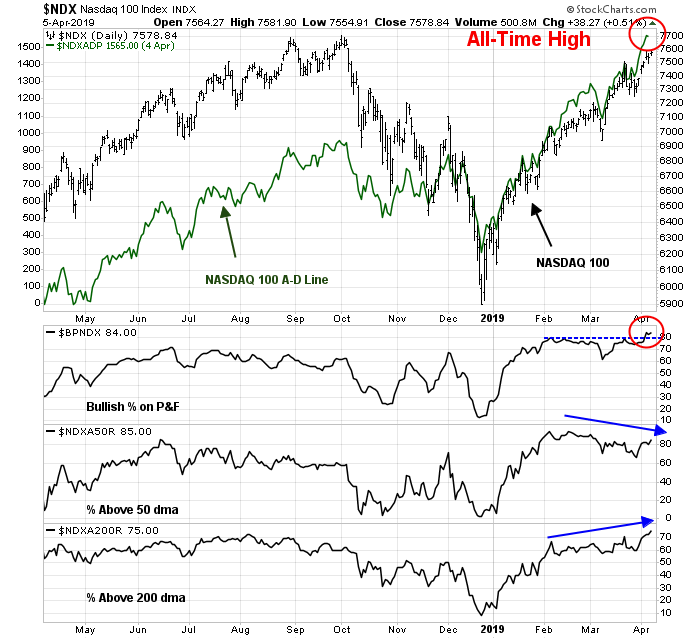
The breadth indicators for the NASDAQ 100 are also exhibiting a similar constructive pattern. The NASDAQ 100 Advance-Decline Line made a fresh all-time high, and both the % bullish and % above the 200 dma rose to new highs as the index rose.
An analysis of market cap leadership is also constructive for the bull case. The performance of both mid and small cap stocks made double bottoms relative to large caps (troops leading the generals). As well, NASDAQ 100 stocks remain in a constructive relative uptrend.

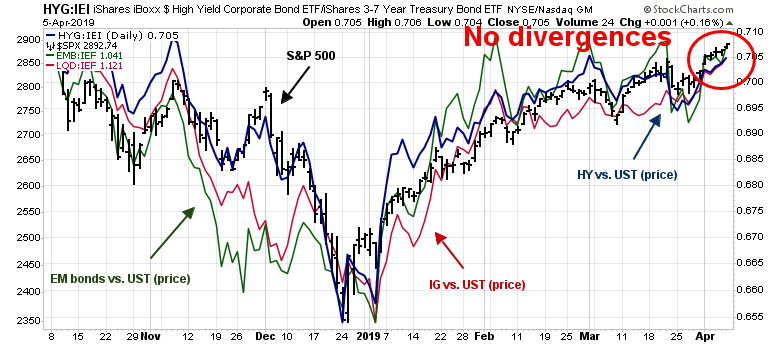
Credit markets are also confirming the equity market advance. The price performance of high yield (junk), investment grade, and EM bonds relative to their duration-adjusted Treasury benchmarks are not diverging from stock prices.
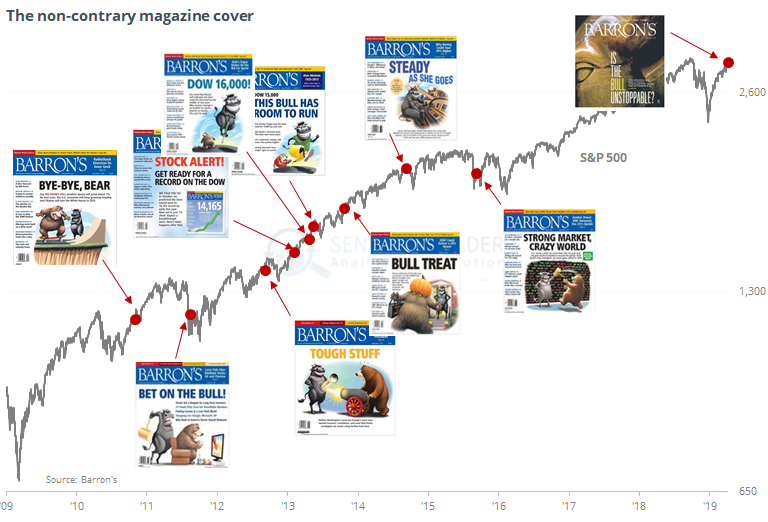
Although the weekend Barron’s cover did flash a “magazine cover” contrarian cautionary signal.
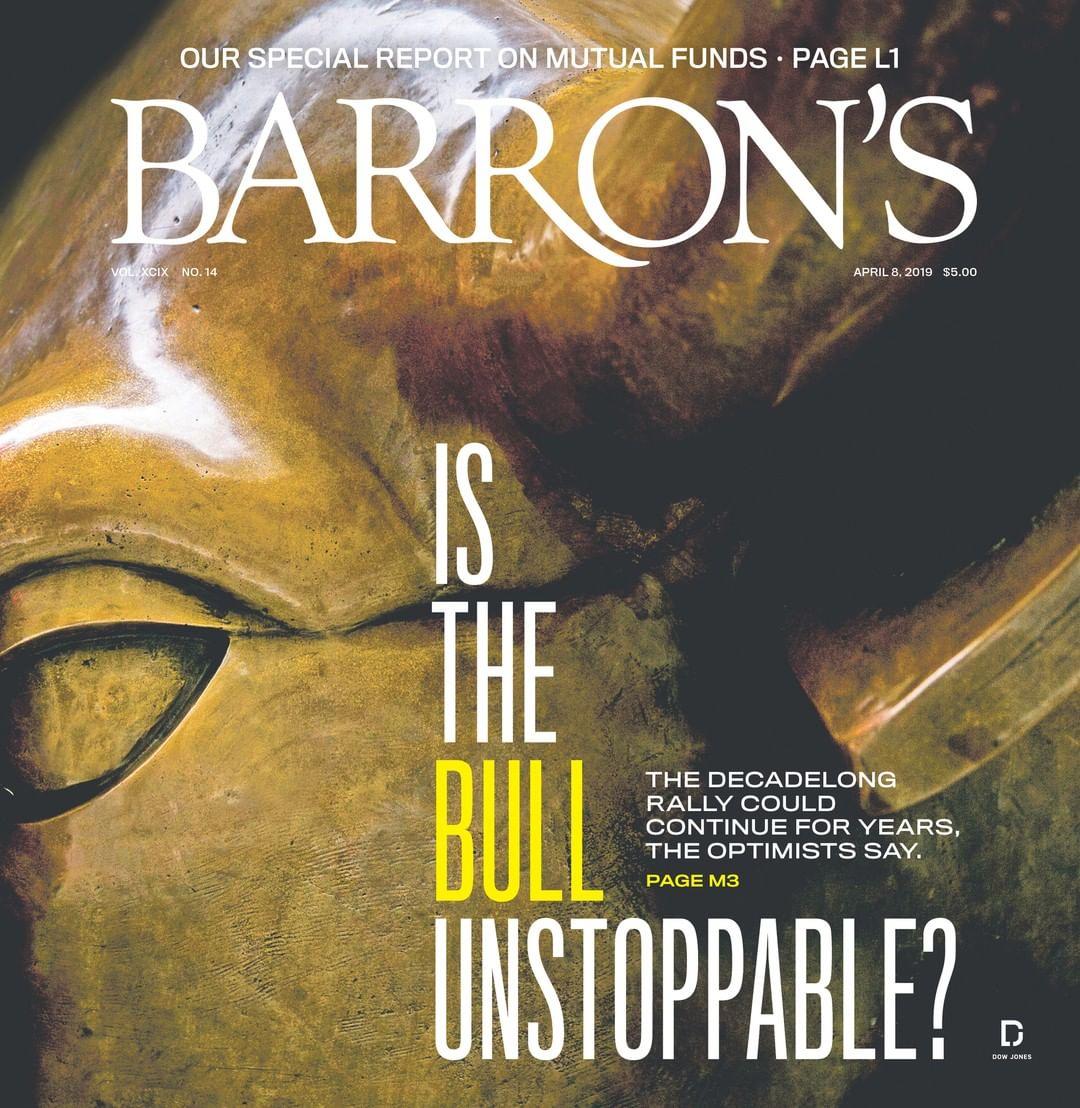
However, SentimenTrader pointed out that Barron’s does not function well as a good contrarian magazine cover indicator.
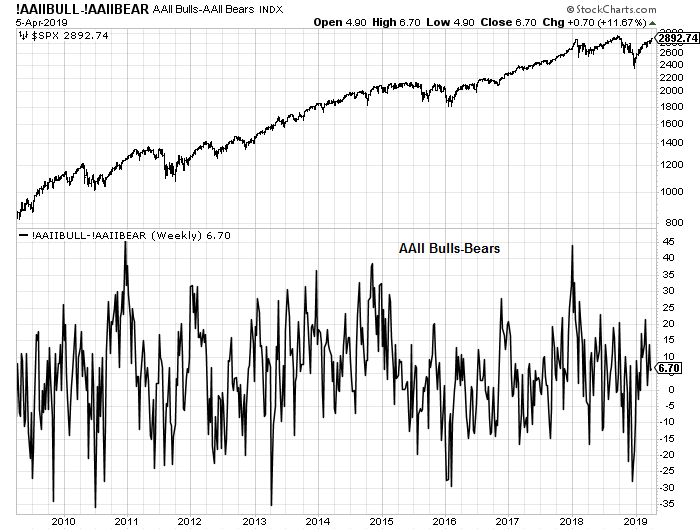
A survey of sentiment indicators are not at extreme levels, which gives room for the market to rise further. AAII weekly sentiment is neutral, despite the recent market rally.
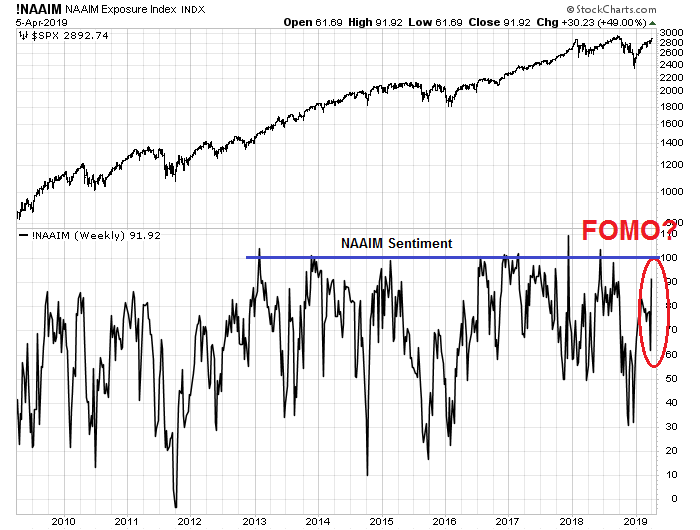
The NAAIM Exposure Index, which measures the sentiment of RIAs managing individual investors’ funds, spiked last week. Readings are not yet at bullish extremes, and the spike could be indicative of a FOMO rally as advisors pile into stocks.
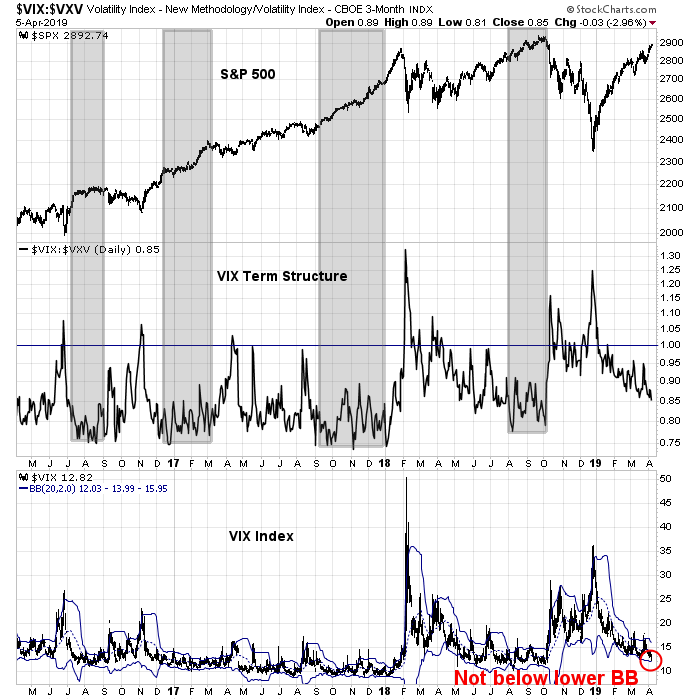
Option market sentiment is not at a crowded long either. The term structure of the VIX Index (middle panel) is below average, but readings cannot be considered to be a crowded long. The VIX Index (bottom panel) has also not breached below its Bollinger Band, which is a signal of an overbought stock market.
The 30 day moving average of the equity-only put/call ratio is in the middle of its 10-year historical range. Sentiment, as measured by the put/call ratio, can hardly be described as either panic or euphoria, but meh!

Short-term breadth indicators are also showing the similar pattern of rising prices while flashing a series of “good overbought” signals. However, readings are overbought, indicating a high likelihood of a pause or pullback early in the week.
My inner investor is bullishly positioned. He is slightly overweight equities compared to his target equity weights. My inner trader is also bullish and long the market. He is prepared to buy more should the market pull back next week.
Disclosure: Long SPXL
Herman Cain will change his tune, from”hard money” to MMT, once he is on the Federal Reserve board.
The about turn of Federal policy in the last six month is one of the most ridiculous policy decision I have seen. Stocks and other assets remain desperately dependent on Central bank polices.
All one needs to do is monitor Central bank policies, and invest accordingly.
Using Ken’s analogy, the Moon (= Central bank) has arisen again, so let us party.
Jokes aside, the countertrend rally from January seems almost surreal, needs a scary pull back, to restore health.
On a more serious note, rally in the bond market is telling a cautionary tale. With improving market fundamentals, bonds should sell off, with rising yields or so goes the theory. That has not happened in the last quarter (we are now measuring time in quarters).
Why bonds are rallying in the face of a massive stock market rally is an enigma. There is an obvious explanation and that is the Fed policy.
So, the stock market rally may be seen only as a “technical rally”, in response to Fed policy. This plays into the hands of our esteemed teacher, Cam, that this rally should be seen only as a trading rally rather than a fundamental (=secular = long term) signal to buy stocks.
It is some way notional when a trading signal becomes a long term signal to buy and hold equities, especially when the Fed is telling “not to fight the Fed”.
Cam has indicated that one should be invested in the market for the long(er) term, based on ones risk appropriate exposure is a cautionary approach to long term buy and hold approach.
Maybe it is a sign that everything is charging for the proverbial cliff. When central bank policy causes “bubbles” to form, what is the final result? Aside from equities and bonds, we have cryptos, IPOs (do you think when the manufacturers finally perfect self navigating cars they will hand over the rights to Lyft or Uber? More likely someone will come up with a car pooling scheme that will combine the services of Lyft, Instacart and Ubereats). Somebody is going to lose a lot of money at some point. It’s strange but gold does not have much appeal to this mania….maybe when everyone is bailing out of what they are piling into now.
The problem is human nature/moral hazard. When there is all this easy money, some of it is not put to good use. Stock buybacks on an unprecedented scale, being offset almost completely by stock option incentives to insiders…does that really benefit share holders?…there are so many ways this will not turn out well.
When the cat’s away the mice will play, when the teacher leaves the classroom do the children stay quiet? Moral hazard is in our nature.
There is no question in my mind that this will eventually unravel, the when and how is the mystery.
This time is not different because people are not different.
yodoc,
Based on what you have said, gold remains a long term, contrarian buy. Not much has been discussed on this forum regards gold, but as an asset, it has lost 40% from its recent peak (2011) and appears to be creating a durable (?) base in the 1200-1300 range. Longer the base, stronger the base.
As regards Uber/Lyft, the Intellectual Property of these companies is their software. Labor (drivers), is a commodity in the equation. Amazon (or Google or Apple) can easily create the software that is used by Uber/Lyft and register drivers on its website and destroy the Uber/Lyft model very quickly.
I am not sure whether Amazon is working on it, but if it is, it will quickly prove to be disruptive.
Your point about bubbles in other assets is well taken.
Gold should be a decent long-term buy here, but getting the timing right is a totally different challenge.
Timing??
Do you think it has much downside here (below 1200)?
If I understand you correctly, you are saying that gold may remain a sleeper asset for an uncertain length of time.
¯\_(ツ)_/¯
Personally I prefer silver.
The gold silver ratio is at extremes which makes silver the better buy.
Silver is used up in industry, the result being that there is less above ground silver than there is gold. Gold is mined, refined and then put back underground in a vault, silver goes into electronics and so many other things.
If they ever find a way to extract gold from seawater can they do it fo 80 times cheaper for silver?
Those cycles in commodities are long, gold and silver took about 20 years from 1980 to 2000 (approx dates) to bottom, so I don’t think we are done.
Gold at 750 to 800 would be a great price, but it could take another 10 years.
My take is that we are in a bear market in precious metals and because of that, all we will get are bear market rallies, but they can be very sharp rallies
If you look at Elliott waves, wave 4 is around 750 where it was in 2008, which is curious when you consider in 1980/81 gold went to 885 and then went down to somewhere around 275, if you use the same math on the high of 1950 in 2011 it puts a low in the range of 750.
That of course is speculation, but there is another piece to the puzzle. Ask yourself why when the GFC started gold went up but then it crashed along with everything else? Like everything else, you need a buyer, it is not just about safe haven.
So I expect some rallies in gold, but I anticipate that if we get a GFC 2.0 at some point, then gold will be lower
Barbaric relic or not, it seems we end up going back to it to back currencies, so unless we come up with a better alternative there is a good chance that some day it will happen again.
The bond market has reversed course and yields have risen in the last week and a half as stock prices rallied. In addition, the 2s10s yield curve has been steady while the 10s30s spread is north of 40bp, so I don’t see a lot of slowdown signals there.
Thanks Cam, for pointing out the significance of different parts of the yield curve.
The Citi Economic Surprise Index for the U.S. has fallen below minus 50. That shows extreme unexpected weakness. Markets have to weather that storm.
Although year end future earnings are rising, investors will soon experience first quarter earnings announcements that will be down year over year for the first time in a long time. How will they react. Last September, estimates had first quarter earnings going UP 8%. Now it’s down almost 4%. Big negative change to absorb by investors.
I am still very bullish about the medium term but expect some volatility during the earnings season.
Here is a chart that shows the current China related ETFs versus the S&P 500.
https://product.datastream.com/dscharting/gateway.aspx?guid=d9901cb3-44ee-4b09-bc11-d22cdb9a373f&action=REFRESH
Amazing outperformance. I made the early audacious claim that the Chinese market had started a new bull market in October and it would be the leading stock market in the world. The better performance has been 15 to 35%. I expect they will continually outperform going forward.
People seemed to be surprised that the Chinese economy is perking up. But this is the direct result of Chinese Central Bank and government easing moves back in September. When China changes policy and starts easing, it will either work or more stimulus will be applied until it does, that simple.
Sorry, here is the Citi Economic Surprise Index
http://product.datastream.com/dscharting/gateway.aspx?guid=49539612-0a50-40cc-a9a3-c35e91ff8a27&action=REFRESH
We are now in a new quarter. Let us see if volatility brings equity levels into buying orbital.
Great article! And thanks for touching on the different kinds of sentiment surveys.