I have two thoughts ahead of the March Jobs Report that investors should consider. Let’s start with the tactical picture of what Friday’s reports might bring.
Recent jobs data has been distorted by the effects of the federal government shutdown, which can make the reported figures nonsensical. Now that the effects of the shutdown are mostly over, we can get a better idea of the overall trend.
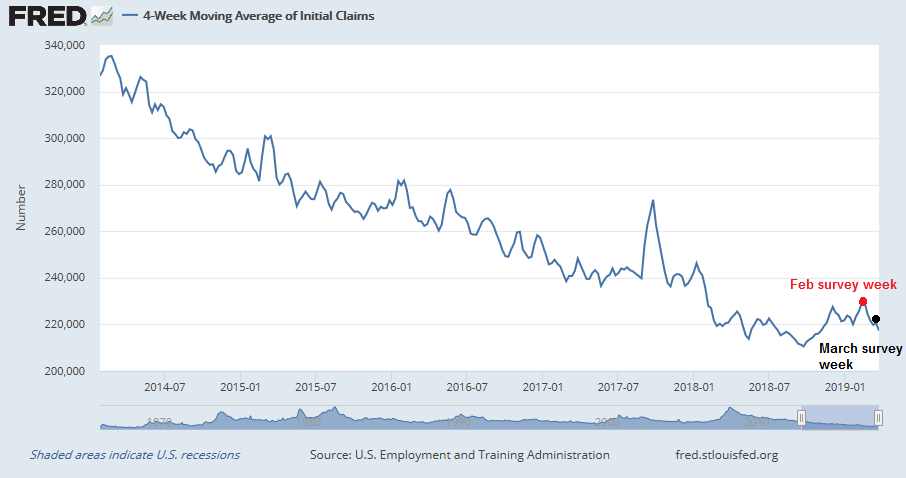
One clue comes from the weekly initial jobless claims data, which is reported on a timely basis. As the chart below shows, the week of the February Jobs Report survey coincided with an unusually strong initial claims print, which may have contributed to the shocking miss in the February NFP report of 20K jobs. Initial claims for the March survey week weakened to a level consistent with January’s. In light of the strong January NFP print of 304K jobs, which was later revised to 311K, this suggests that an in line or beat result for March headline NFP estimate of 175K.
Notwithstanding the tactical trading considerations of the March Jobs Report, a new development is likely to affect how the Fed views employment data, which could affect thinking on future policy.
Job market measurement error (and what it means)
A new research paper by Ahn and Hamilton found a number of internal inconsistencies in the job survey data is mis-stating the unemployment rate, and participating rate. These errors can have important policy implications. Here is the abstract:
The underlying data from which the U.S. unemployment rate, labor-force participation rate, and duration of unemployment are calculated contain numerous internal contradictions. This paper catalogs these inconsistencies and proposes a reconciliation. We find that the usual statistics understate the unemployment rate and the labor-force participation rate by about two percentage points on average and that the bias in the latter has increased since the Great Recession. The BLS estimate of the average duration of unemployment overstates by 50% the true duration of uninterrupted spells of unemployment and misrepresents what happened to average durations during the Great Recession and its recovery.
Hamilton summarized the research results at his blog Econobrower. Here is the first inconsistency:
One of the well-known inconsistencies in these data is referred to in the literature as “rotation-group bias;” see Krueger, Mas, and Niu (2017) for a recent discussion. One would hope that in a given month, the numbers collected from different rotation groups should be telling the same story. But we find in fact that the numbers are vastly different. In our sample (July 2001 to April 2018), the average unemployment rate among those being interviewed for the first time is 6.8%, whereas the average unemployment rate for the eighth rotation is 5.9%. Even more dramatic is the rotation-group bias in the labor-force participation rate. This averages 66.0% for rotation 1 and 64.3% for rotation 8.
The second problem has to do with systematic errors when people who responded to one survey but do not respond in a subsequent survey:
A second problem in the data, originally noted by Abowd and Zellner (1986), is that observations are missing in a systematic way. The surveyors often find when they go back to a given household in February that some of the people for whom they collected data in January no longer live there or won’t answer. The standard approach is to base statistics for February only on the people for whom data is collected in February. But it turns out that people missing in February are more likely than the general population to have been unemployed in January. If the people dropped from the sample are more likely to be unemployed than those who are included, we would again underestimate the unemployment rate.
There were also inconsistency problems with the reports of the length of unemployment:
A third inconsistency in the underlying data comes from comparing the reported labor-force status with how long people who are unemployed say they have been looking for a job. Consider for example people who were counted as N the previous month but this month are counted as U. The histogram below shows the percentage of these individuals who say they have been actively looking for work for an indicated number of weeks. Two-thirds of these people say they have been looking for 5 weeks or longer, even though the previous month they were counted as not in the labor force. Eight percent say they have been looking for one year, and another 8% say they have been looking for two years.

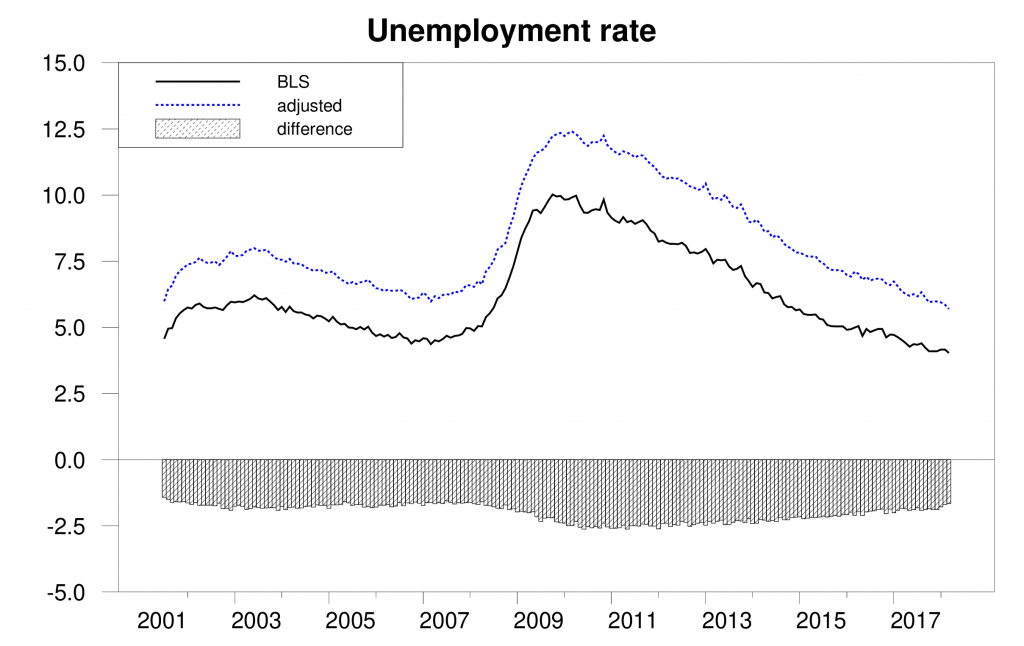
Here is what happened when the authors adjusted for these errors. The unemployment rate is higher than reported. The policy implication is there may be more slack in the labor market than what is in the Fed’s original models, which argues for an easier monetary policy than what is being currently pursued.
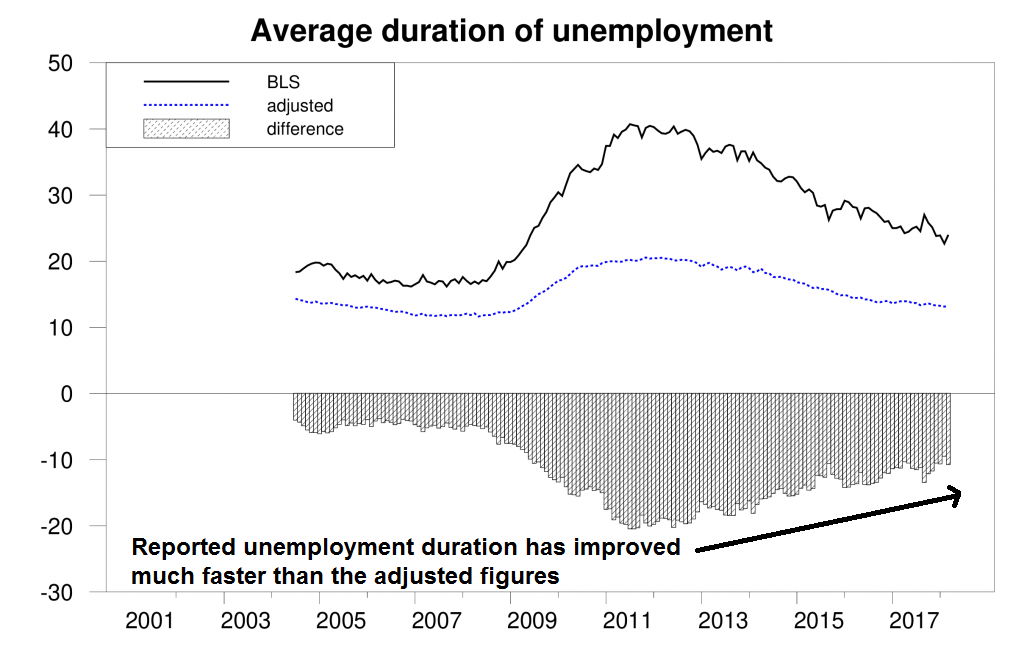
Another effect is the length of unemployment is much lower than reported. More importantly, the bars in the bottom panel show the differences between the reported and adjusted numbers. The takeaway is the rate of improvement in the jobs market is actually not as strong as previously reported (annotation is mine). This result also gives greater ammunition for the doves within the Fed.
The Federal Reserve is a slow moving institution, and I do not expect any immediate policy changes as a result of this paper. Nevertheless, this is an important paper by two well respected researchers. Ahn is a Fed economist, and Hamilton is well-known for his work on oil prices and recessions. This kind of research result can move the needle, over time, and change the analytical framework, and shift Fed policy towards an easier path.
I am a little surprised to think that the Fed would have no idea about the potential issues within the reported statistics (unemployment as an example). Perhaps the exact extent may not be clear to them.
Also (hopefully) Fed would consider the trend in unemployment not just the level of unemployment. The Adjusted unemployment shows a consistent trends as the reported.
In these regard, I wonder how much more ammunition does it really give Feb in addition to what they may have already taken into account.