Preface: Explaining our market timing models
We maintain several market timing models, each with differing time horizons. The “Ultimate Market Timing Model” is a long-term market timing model based on the research outlined in our post, Building the ultimate market timing model. This model tends to generate only a handful of signals each decade.
The Trend Model is an asset allocation model which applies trend following principles based on the inputs of global stock and commodity price. This model has a shorter time horizon and tends to turn over about 4-6 times a year. In essence, it seeks to answer the question, “Is the trend in the global economy expansion (bullish) or contraction (bearish)?”
My inner trader uses a trading model, which is a blend of price momentum (is the Trend Model becoming more bullish, or bearish?) and overbought/oversold extremes (don’t buy if the trend is overbought, and vice versa). Subscribers receive real-time alerts of model changes, and a hypothetical trading record of the those email alerts are updated weekly here. The hypothetical trading record of the trading model of the real-time alerts that began in March 2016 is shown below.

The latest signals of each model are as follows:
- Ultimate market timing model: Sell equities
- Trend Model signal: Neutral
- Trading model: Bullish
Update schedule: I generally update model readings on my site on weekends and tweet mid-week observations at @humblestudent. Subscribers receive real-time alerts of trading model changes, and a hypothetical trading record of the those email alerts is shown here.
Bullish and bearish over different time frames
I was recently asked to clarify my market views, as they appear to have been contradictory. Let me make this clear, I am both bullish and bearish, but over different time horizons.
I expect that the U.S. equity market should perform well into the end of 2019. The recent Zweig Breadth Thrust signal on January 7 (see A Rare “What’s My Credit Card Limit” Buy Signal) has historically seen higher prices over longer time frames. Exhibitions of powerful price momentum have historically been very bullish.
Troy Bombardia recently pointed out that the NYSE McClellan Summation Index (NYSI) recently exceeded 850, and past episodes have resolved bullishly. My own shorter-term study shows that the market was higher 75% of the time after one month with an average return of 1.8%, and higher 83.3% of the time after three months with an average return of 3.9%.

However, I do have some concerns about the possibility of stock price weakness over the next few months. As we pointed out last week (see Recession Ahead? Fuggedaboutit!), the market is likely to be spooked by growth slowdown as we approach Q2. Evidence of a growth scare is already emerging.
The growth scare in Europe
The most visible portion of the growth scare is appearing in Europe. German industrial production is tanking, and the country is in a technical recession. In addition, the European Commission cut its 2019 eurozone growth forecast from 1.9% to 1.3%.

As Germany has been the growth locomotive of the eurozone, worries are spreading. Even The Economist published an article entitled, It is Time to Worry About Germany’s Economy — A Sputtering Engine”.
Germany is getting both the short and the long term wrong. Start with the business cycle. Many policymakers think the economy is close to overheating, pointing to accelerating wages and forecasts of higher inflation. In their view, slower growth was expected, necessary even. That is complacent. Even before the slowdown, the IMF predicted that in 2023 core inflation will be only 2.5%—hardly a sign of runaway prices. In any case, higher German inflation would be welcome, as a way to resolve imbalances in competitiveness within the euro zone that would elsewhere adjust through exchange rates. The risk is not of overheating but of Europe slipping into a low-growth trap as countries that need to gain competitiveness face an inflation ceiling set too low by Germany.
The slowdown also portends deeper problems for Germany’s globalized economic model. Weakness in part reflects the fallout from the trade war between China and America, two of Germany’s biggest trading partners. Both are increasingly keen on bringing supply chains home. America is due soon to decide whether to raise tariffs on European cars. Trade is already becoming more regionalised as uncertainty grows. If global commerce splits into separate trading and regulatory blocs, Germany will find it harder to sell its goods to customers around the world.
The possibility of a no-deal and disorderly Brexit is also worrisome. This New York Times graphic shows that while the British economy will bear most of the pain of a no-deal Brexit, both the French and German economies will also be vulnerable too. In addition, Bloomberg reported that a study by Halle IWH concluded that 100,000 German jobs would be at risk in the event of a no-deal Brexit.

Another possible but less noticed development is bearish implications of a U.S.-China trade agreement. China has promised to import more from the U.S. in order to reduce or eliminate the trade deficit over time. However, if China were to import more American goods in the short run, demand will have to be shifted from somewhere else. More imports from America such as Boeing aircraft, and fewer from Airbus. Europe would bear the brunt of falling Chinese demand under such a scenario.
A US slowdown ahead?
Over on this side of the Atlantic, slowdown fears are also rising. Yelp recently unveiled a business survey called the Yelp Economic Average (YEA), and it is uncovering broad-based signs of a business downturn.
Over the past quarter, YEA fell by more than two points, due in large part to declines in the professional services, shopping, and other categories. Slumps in core business sectors may be early signs of an economic downturn. A second successive fourth-quarter slump isn’t a result of seasonality; we’ve normalized the data so that it is seasonally adjusted.
Of the 30 business sectors represented by the Yelp Economic Average (YEA), only one—gas stations—saw an increase in the fourth quarter of 2018, resulting in a national decline to 98.5 from 100.7 in the third quarter. All YEA scores are calculated relative to the fourth quarter of 2016, for which the score was set to 100.
The downturn left few business sectors untouched. Everything from high-end retail such as jewelry stores and antique shops to pricey professional services such as private eyes and architects were hit hard in the fourth quarter, in a trend extending to sectors beyond our core 30. So were more routine discretionary offerings, such as burger places, bars, and coffee shops.
In addition, Georg Vrba’s unemployment rate recession model is on the cusp of a recession call (see The Unemployment Rate May Soon Signal A Recession: Update – February 1, 2018): “If unemployment rate rises to 4.1% in the coming months the model would then signal recession”.
I am skeptical that a recession is in the cards. The recession model is based on a rising unemployment rate, which has signaled slowdowns in the past. However, the rise in unemployment is the result of the labor force participation rate rising faster than job growth, which are signs of a strong economy not a weak one.
As well, the blogger New Deal democrat went on “Recession Watch” for Q4 last week because of tightening credit conditions from the Senior Loan Officer survey. Credit has tightened across the board for firms of all sizes.

Analysis from Citi Research confirms NDD’s concerns. Changes in credit standards leads industrial production by three quarters.

I would also add that credit conditions have also tightened on the consumer side as well.

The deterioration in credit conditions was enough to put NDD on “Recession Watch”:
We have 3 negatives: interest rates, housing, and credit conditions
We have 2 positives: corporate profits and real retail sales per capita
We have 2 mixed indicators: money supply and the yield curveThere has been enough further deterioration in the long leading indicators — metrics I have followed and updated over and over again for years — during the second half of 2018 that a plurality are negative. It had already appeared that the more likely outcome would be that in the second half of 2019, left to its own devices, the economy would just barely escape recession, although poor government policy choices this year could easily tip the balance. The further deterioration described above warrants going on Recession Watch one year out — i.e., beginning Q4 2019.
However, NDD was careful to distinguish this as a “Recession Watch” warning, and not an actual recession forecast.
It isn’t a “Recession Warning,” where a downturn looks certain, but more on the order of the warning given to Scrooge by the Ghost of Christmas Future: what is likely to happen if there is no intervening change for the good.
Why I am bullish
Here is why I remain bullish on equities longer term. It is true that recessions are bull market killers, I am skeptical of these recession warnings
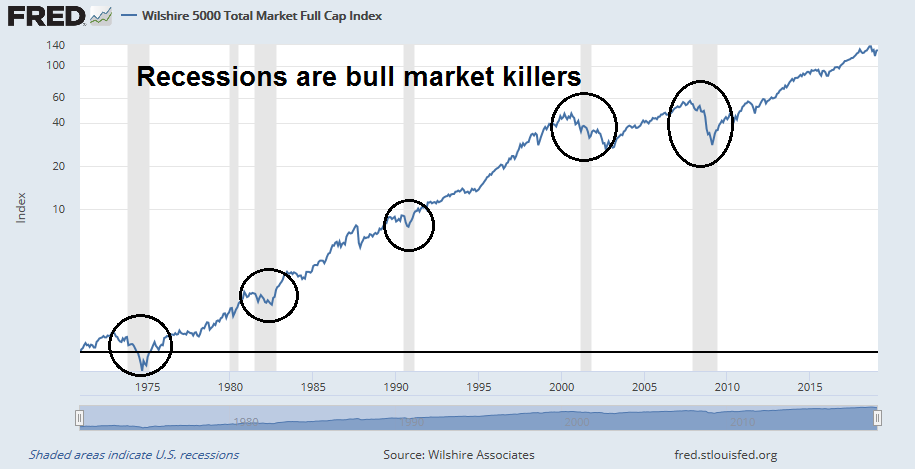
Recessions don’t occur spontaneously, but occur as part of a process. Past recessions have been the result of either tight Fed policy cooling growth into recession (1973, 1980, 1982, 1990) or the unwinding of financial excesses that led to an accident (2000, 2008). The same conditions are not in place. Fed policy can hardly be described as overly hawkish. A financial accident is always possible (China, the European banking system), but the American economy is largely insulated from the worst of any implosion. Should a U.S. recession occur, we expect it to be mild.
Traversing the valley of weak growth
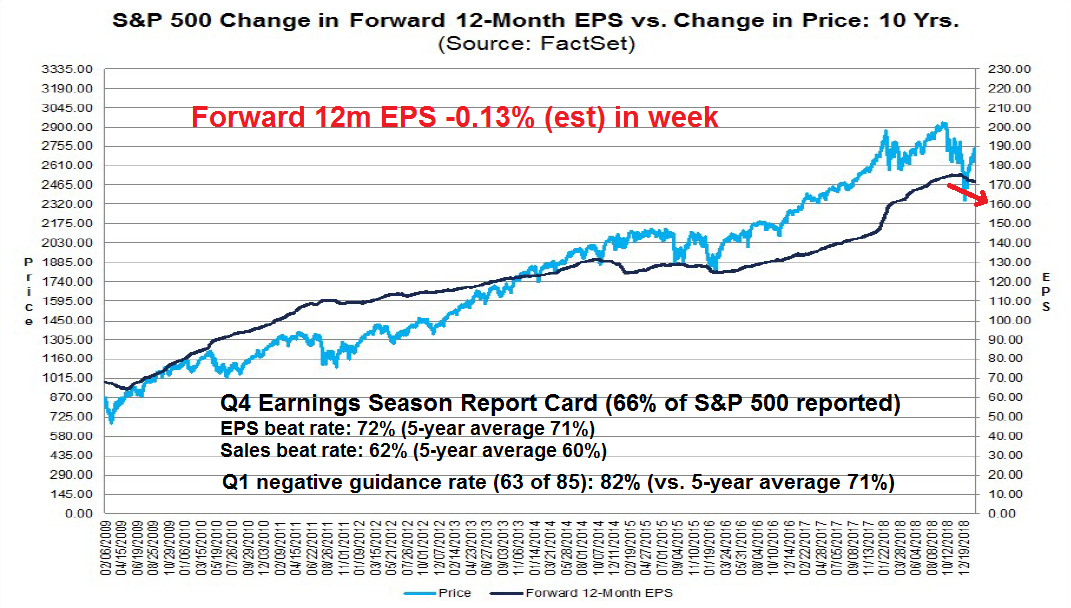
Nevertheless, NDD’s short leading indicators are pointing to Q2 weakness, and the market will have to traverse this valley of weak growth. The latest update from FactSet shows that while Q4 earnings season beat rates are slightly ahead of historical averages, Estimate revisions are falling and the Q1 negative guidance rate is higher than average, but stock prices haven’t responded to the downgrades.
In addition, the old market leaders of 2018 have not stepped up in the reflex rally off the December 24 bottom, and many of the old FAANG stocks are likely to face regulatory headwinds in 2019. Business Insider reported that Facebook is facing an existential threat to its business model in Europe. Other companies that rely on Big Data like Google and Amazon are likely to get caught up in the dragnet soon.
Germany’s antitrust regulator, the Bundeskartellamt, or Federal Cartel Office, on Thursday issued Facebook with an ultimatum: Stop hoarding people’s data.
Following an unprecedented three-year investigation involving extensive conversations with Facebook, the Bundeskartellamt issued a press statement declaring that it had “imposed on Facebook far-reaching restrictions in the processing of user data.”
It demands that Facebook — which has 32 million monthly users in Germany — change its terms and conditions so that people can explicitly stop it from hoarding data from different sources, including Facebook-owned apps like WhatsApp and Instagram as well as third-party websites with embedded Facebook tools such as “like” or “share” buttons.
If FAANG falters, where’s the leadership? The market will have to spend a little time to sort these issues out before it can rise further.
What could go right
Still, there are some silver linings in the dark cloud of bearish factors. Even the perennially bearish Zero Hedge conceded that market positioning is supportive of stock prices in the short run. Analysis from Nomura shows that Commodity Trading Advisors are responding to the change in price trend and adding to their equity positions.

As well, risk parity funds are unwinding their underweight position in equities and they are starting to buy again.

In addition, the team of Steve Mnuchin and Robert Lighthizer are headed to China for another round of trade negotiations on February 14-15, though the timing of a Trump-Xi meeting has not been finalized yet. Asia Nikkei reported that while China is making trade concessions, it is also playing the North Korea card. A trade agreement, regardless of how incomplete the provisions are, combined with a de-escalation of tensions with North Korea, will be a positive surprise for the markets.
As things stand, Xi’s side appears to be making concessions to Trump — announcing increased purchases of American goods and hinting at some structural reforms — in a bid to stabilize bilateral economic relations. China’s economic slowdown has made it difficult for Xi to take a combative stance.
But things are not that simple. What is also happening is that China is playing the “North Korea card” and shrewdly weighing in on the second U.S.-North Korean summit, as a way to gain leverage in the trade talks with Washington.
Xi was in effect offering a big win to Trump, not just on trade, but on North Korea as well:
China’s strategy was clear from the composition of the delegation that accompanied Liu on his trip to Washington. Although labeled as “ministerial-level talks,” Liu took no cabinet members with him. The only other high-profile figure on the delegation was Yi Gang, the governor of the People’s Bank of China, the country’s central bank.
Sitting opposite a full line-up of Trump administration heavyweights such as U.S. Trade Representative Robert Lighthizer, Treasury Secretary Steven Mnuchin, Commerce Secretary Wilbur Ross was a group of Chinese vice-ministers.
The unequal and bizarre lineup of the Chinese side said it all. The main purpose of Liu’s U.S. trip was to meet Trump and personally convey in polite terms Xi’s request for a summit.
China knew that if it could arrange a meeting with Trump before the March 1 trade negotiation deadline, it could finalize the details of a possible deal in the days after this week’s Chinese New Year holiday.
This is where the North Korea issue comes into play. A source involved in Sino-North Korean relations says the really big issue between the U.S. and China is not trade, but national security.
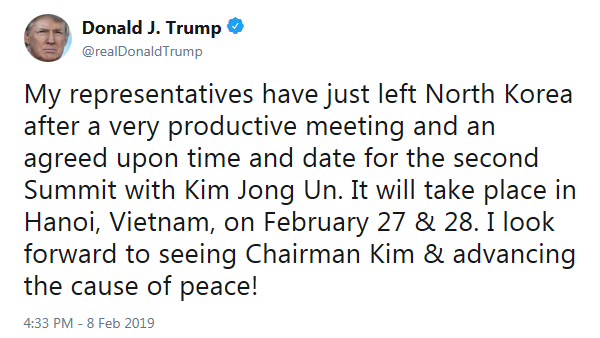
I believe that the recent statements on the American side about “a sizable difference” between the two sides and no Trump-Xi summit has been scheduled is posturing (see Why there will be a US-China trade deal March 1). Both sides desperately need a deal for their own domestic reasons. Negotiators on both sides will undoubtedly be closed-mouthed after the Beijing round of talks, but statements by both sides will give some clues. Barring a complete breakdown, any decision to keep talking should be seen as a sign of progress. Expect negotiations to go right down to the wire, much like the NAFTA negotiations, which yielded only cosmetic changes, but all sides were able to claim victory. Trump’s Friday night tweet about a meeting with Kim Jong-Un is a tantalizing clue that he has taken Xi’s bait of a trade-North Korea linkage in the discussions.
The Chinese stock market was closed last week, but the U.S.-listed ETF was not. The U.S.-listed ETF (FXI) and soybean prices are exhibited constructive technical patterns that bear watching. FXI (top panel) made a double bottom and is now testing a key resistance zone. Soybean prices have been trending up and also testing key resistance.

These will be key indicators to watch in the days to come.
Bullish tripwires
Should the market correct, or retrace and test the December lows, we stand by our belief that a re-test would represent a buying opportunity because the market was discounting a mild recession at the December 2018 year-end (see Ursus Interruptus).
Should stock prices weaken and re-test the previous lows, here are the signs we would watch to see if the same buying opportunity is still presenting itself.
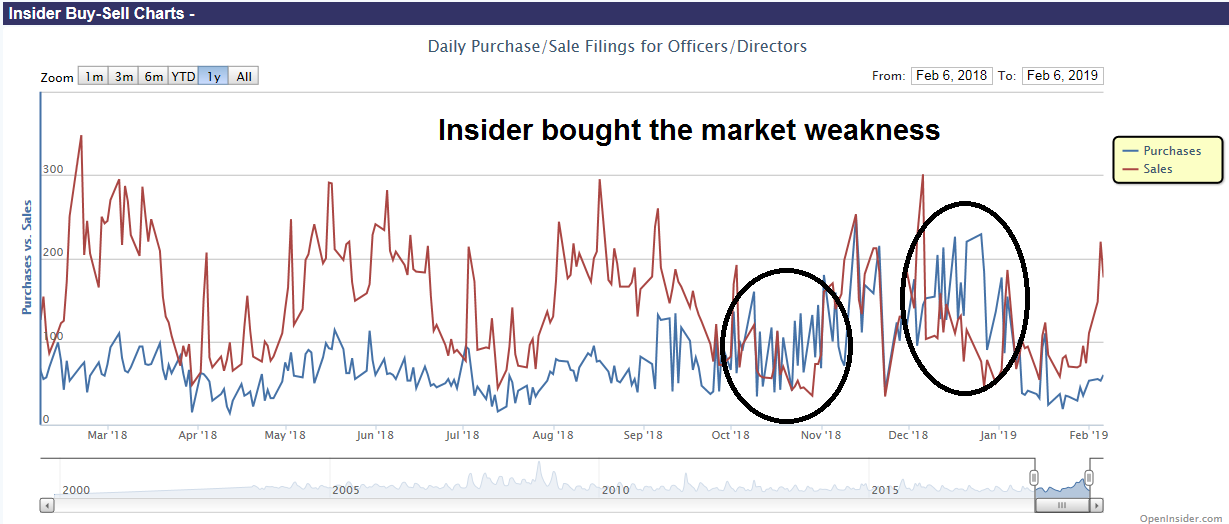
How are insiders behaving? This group of “smart investors” bought the last two rounds of market weakness. Would they continue to do so if stock prices re-visit the December lows?
One concern that will undoubtedly face the markets in the event of a widespread growth scare is financial stress, and contagion risk from abroad. In the past, technical breakdowns of the relative performance of bank stocks have been warnings of equity bear markets.

Since a key stress point is the European banking system, how are the European financial stocks performing? Is the relative performance of the sector significantly worse than US financials?

As well, watch for signs of stress in the canaries in the Chinese coal mine. How are Chinese property developers like China Evergrande (3333.HK) behaving? Are they holding long-term support?

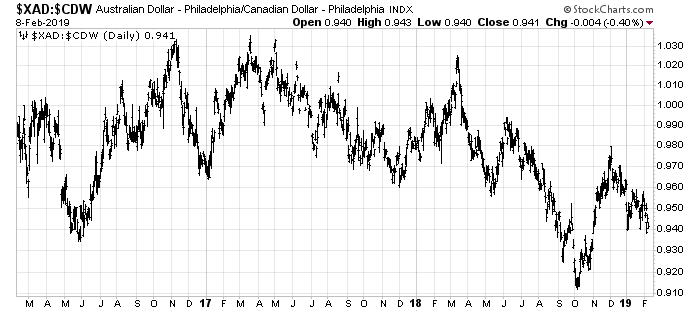
What about the AUD/CAD exchange rate? Both Australia and Canada are commodity-sensitive economies, but Australia is more sensitive to China while Canada is more levered to American growth. Is AUD/CAD holding support?
If these tripwires were to flash the all-clear sign should stock prices correct, that would be the signal to step up and buy.
The week ahead
Looking to the week ahead, I am also bullish and bearish over different time frames. In the very short run, the SPX successfully tested support while exhibiting positive RSI divergences and an unfilled gap above current levels. This suggests a bullish tone to the early part of the coming week.

There is precedence for the pattern of breadth thrust, overbought and pullback before rallying to new highs. Exhibit A is the Zweig Breadth Thrust signal of 2015.

Looking at the bigger picture, the SPX rally was halted at the 200 dma resistance. Another run at the 200 dma while flashing another overbought reading on RSI-5 would be no surprise, with additional resistance at 2800. Should such a rally occur, watch to see if the VIX Index breaches its lower Bollinger Band, which is a sign of a stalling rally.

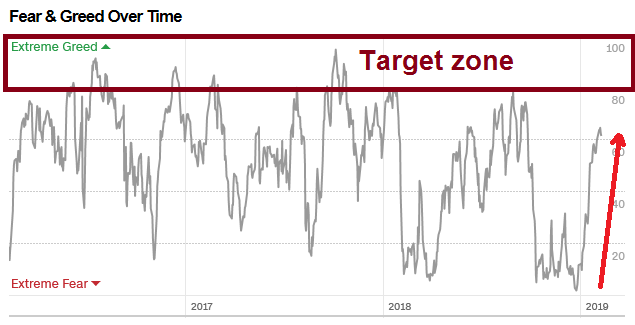
The Fear and Greed Index has rebounded strongly and ended on Friday at 61. It may need to rise up into the 80-100 target zone before this rally is over.
Longer term, a glance at the history of % of stocks above the 200 dma became wildly oversold shows that past V-shaped bounces off deeply oversold conditions has seen the market rally stall at current readings. This is consistent with my view of a growth scare induced correction over the next few weeks.

Tactically, it may be a little early to get overly defensive. The NYSE McClellan Summation Index (NYSI) is extended, but the stochastic has not rolled over yet. A rollover of the weekly stochastic has historically been a more timely sell signal for the market.

My inner investor is neutrally positioned at his investment policy asset weights. My inner trader remains bullishly positioned for a rally into early next week.
Disclosure: Long SPXL
Possibility of some additional choppiness over the next few weeks, but I’m still expecting 2800 level to be tested at a minimum before any intermediate-term pullback. I’m looking at 2650ish as max downside if we take out Friday’s low, but gut says Friday’s low will hold. Either way I see R/R about 2/1 in favor of Bulls here.
Hopefully see 2800