Preface: Explaining our market timing models
We maintain several market timing models, each with differing time horizons. The “Ultimate Market Timing Model” is a long-term market timing model based on the research outlined in our post, Building the ultimate market timing model. This model tends to generate only a handful of signals each decade.
The Trend Model is an asset allocation model which applies trend following principles based on the inputs of global stock and commodity price. This model has a shorter time horizon and tends to turn over about 4-6 times a year. In essence, it seeks to answer the question, “Is the trend in the global economy expansion (bullish) or contraction (bearish)?”
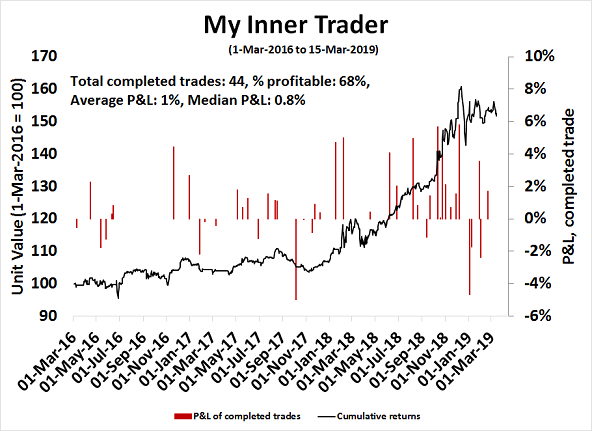
My inner trader uses a trading model, which is a blend of price momentum (is the Trend Model becoming more bullish, or bearish?) and overbought/oversold extremes (don’t buy if the trend is overbought, and vice versa). Subscribers receive real-time alerts of model changes, and a hypothetical trading record of the those email alerts are updated weekly here. The hypothetical trading record of the trading model of the real-time alerts that began in March 2016 is shown below.
The latest signals of each model are as follows:
- Ultimate market timing model: Sell equities
- Trend Model signal: Neutral
- Trading model: Bearish
Update schedule: I generally update model readings on my site on weekends and tweet mid-week observations at @humblestudent. Subscribers receive real-time alerts of trading model changes, and a hypothetical trading record of the those email alerts is shown here.
More recession jitters
I have been warning about the possibility of weakness in Q2 in these pages. Recently, I am seeing more and more evidence of recession jitters come across my desk. The respected UCLA Anderson Forecast issued a statement last week stating that economic growth is likely to slow in 2019 to 1.7% and to near recessionary conditions in 2020:
In his outlook for the national economy, UCLA Anderson senior economist David Shulman notes that while the global economy started out strong in 2018, signs of its weakening will likely be everywhere by year’s end. “The weakness is being amplified by the protectionist policies being employed by the Trump administration and the uncertainties associated with Brexit,” he writes. “This economic weakness has triggered a major contraction in global interest rates, making it difficult for the Fed to conduct its normalization policy, and has put a lid on long-term interest rates.
“After growing at a 3.1 percent clip on a fourth-quarter-to-fourth-quarter basis in 2018, growth will slow to 1.7 percent in 2019 to a near-recession pace of 1.1 percent in 2020,” Shulman adds. “However, by mid-2021, growth is forecast to be around 2 percent.” Payroll employment growth will decline from its monthly record of 220,000 to about 160,000 per month in 2019 and a negligible 20,000 per month in 2020, with actual declines occurring at the end of that year. In this environment, the unemployment rate will initially decline from 3.9 percent in January to 3.6 percent later in the year and then gradually rise to 4.2 percent in early 2021.
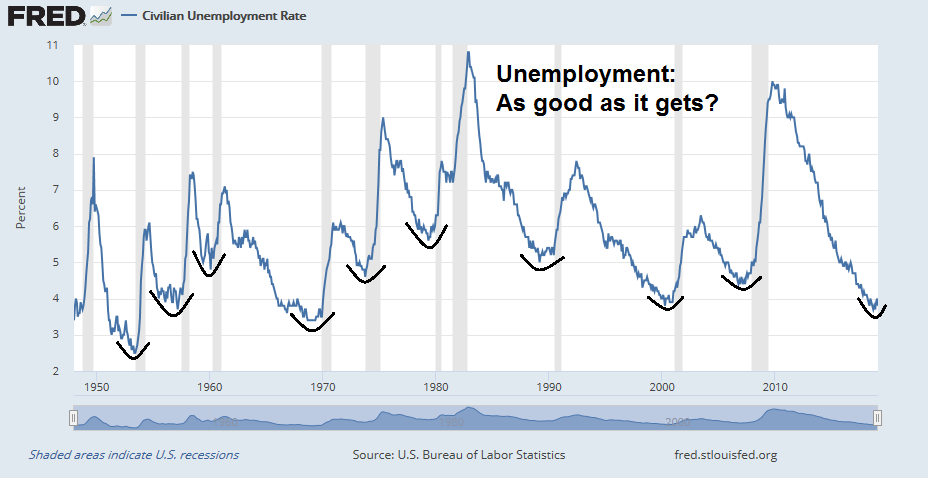
Antonio Fatas, the Portuguese Council Chaired Professor of European Studies and Professor of Economics at INSEAD, rhetorically asked in a blog post if low unemployment is sustainable. In other words, this is as good as it gets for unemployment and the economy? Past turns in the unemployment rate have been followed by recession.
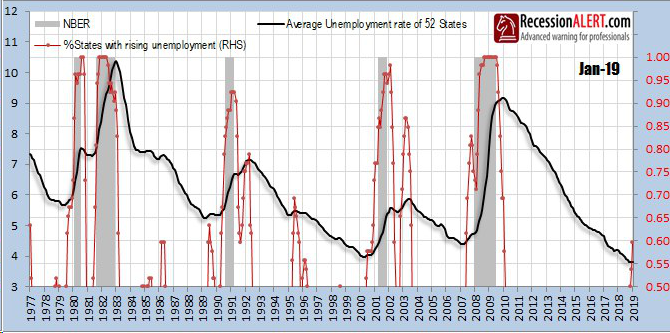
The latest Jobs Report saw the headline unemployment rate decline from 4.0% in January to 3.8% in February, which is constructive, but the internals of the report don`t appear as rosy. RecessionALERT pointed out that 60% of states have reported an increase in unemployment rate.
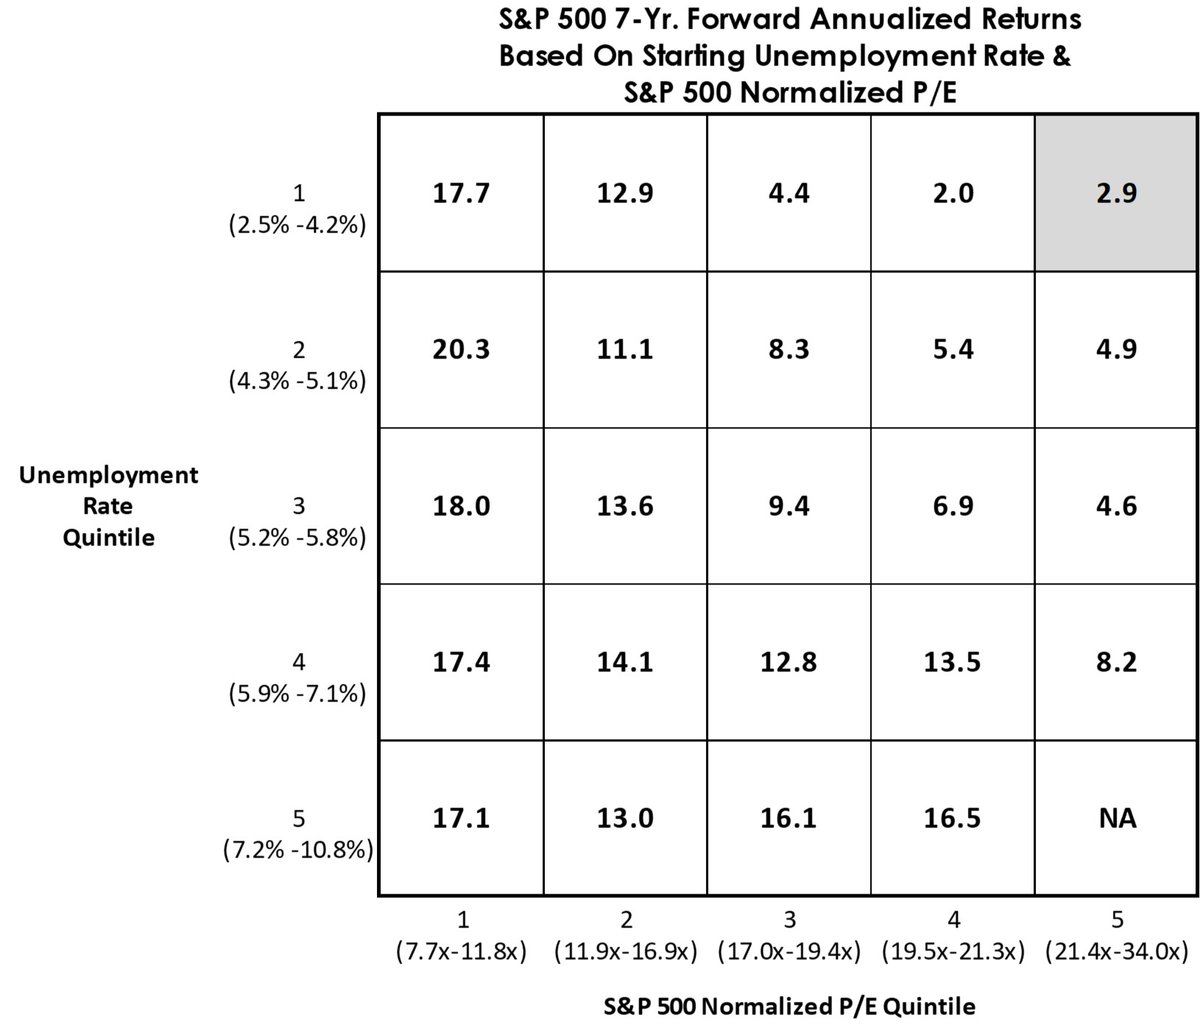
The Leuhold Group also sounded a warning for equity investors. The combination of low unemployment and top quintile valuations is unfriendly for long-term (7-year) returns.
As good as it gets?
Returning to Fatas` analysis, he observed that, in the past, low unemployment rates were unsustainable, and they have displayed a V-shaped pattern at the lows.
In the case of the US, history suggests that “full employment” is not a sustainable state and that once we reach such a level a sudden increase in unemployment is very likely. In the figure below I plot unemployment rates around the peak of each of the last five cycles (where zero represents the month the recession started). I plot 5 years before the recession started and 10 months after the recession.
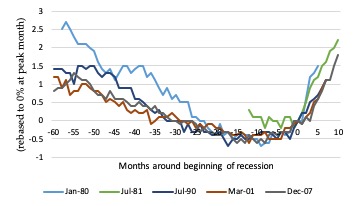
All cycles display a V-shape evolution for unemployment. Unemployment reaches its lowest point around 12 months before the recession and, in most cases, unemployment is already increasing in the months preceding the recession. What is interesting is the absence of a single episode of stable low unemployment (or full employment). It seems as if reaching a low level of unemployment always leads to dynamics that soon generate a recession. Recessions die of old age if “age” is measured in terms of how much economic slack is left. If this pattern was to be repeated, the US must be today very close to an inflection point, a recession.
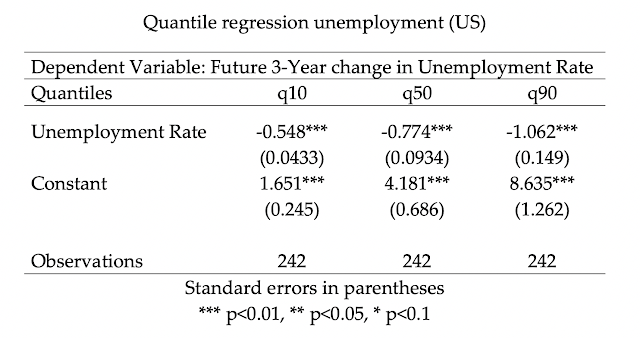
He went on to demonstrate the V-shaped recovery in employment using quantile regressions:
We can quantify this intuition by relating this result to an academic literature that analyzes the determinants of the tail risk of unemployment (or GDP) changes. This literature looks at the determinants of worst potential outcomes over a specific time window. Some examples: Cecchetti (2008), Kiley (2018) Adrian, Boyarchenko, and Giannone (Forthcoming).
Empirically this is done with the use of quantile regressions. In this case we are interested in the tail risk of sharp unemployment increases, which are associated with recessions, and I will capture that by coefficient on the 90th percentile of the distribution in a quantile regression (Fatas (2019)).
The results of such a regression are displayed in the table below. All three coefficients are negative (which is what one would expect as there is reversion to the mean in unemployment rates). But the interesting part is that the size of the coefficient increases as we move from small changes in unemployment to large changes (from q10 to q90). This means that low unemployment rates are particularly good at predicting the tail risk of large increases in unemployment (recessions)
What makes low unemployment unsustainable? To say that low unemployment leads to recession is similar to saying that expansions die of old age. Fatas attributes the unemployment V to the buildup of excesses in the economy. In other words, low unemployment is just an indicator that we are in the late cycle of an expansion.
The academic literature tends to emphasize two set of variables: those associated to macroeconomic imbalances (such as inflation) and those associated to financial imbalances. Interestingly, the introduction of these variables in the quantile regressions above makes the above effect go away (see Fatas (2019)). In particular, once we control for credit growth, it is not any longer the case that low unemployment is a good predictor of the tail risk associated to recessions (we still observe a reversion to the mean but we do not obtain a larger coefficient for the p90 quantile).
This result suggests that recessions follow periods of low unemployment because imbalances are built during those years. What is interesting is that the evidence shows that this is always the case, that the US economy has never managed to sustain a low rate of unemployment without generating the imbalances that lead to a recession. If history is an indicator of future crisis, and given the current low level of unemployment, a recession is likely to be around the corner.
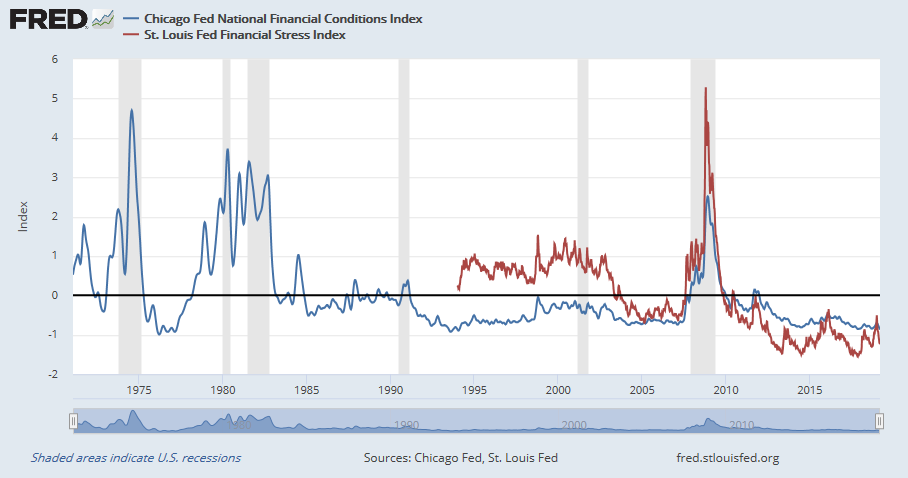
Fatas uses the Chicago Fed’s National Financial Conditions Index (blue line) to measure financial excesses. So far, this indicator, along with the St. Louis Fed’s Financial Stress Index, remains tame.
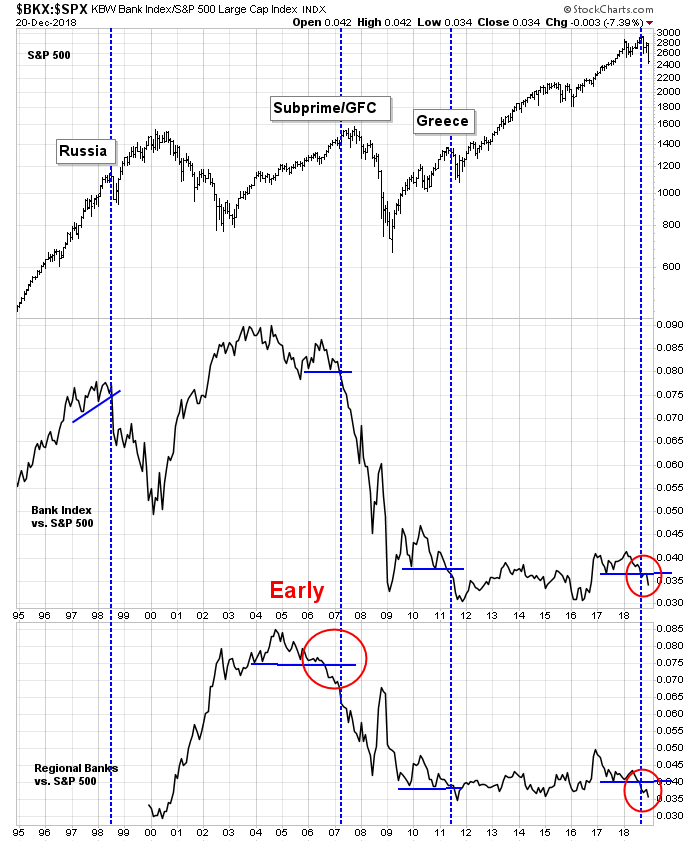
However, the real excesses of this expansion cycle can be found outside the US. As I have noted before, a technical breakdown in the relative performance of bank stocks have signaled bear markets or financial crises in the past.
The worries of this expansion cycle have been dominated by the increasing fragility of the Chinese economy. If China were to stumble, the rest of Asia would tank, and so would the major resource producing countries like Australia, Canada, New Zealand, and Brazil. Europe is also highly vulnerable to a China slowdown. China Beige Book pointed out that China’s headline growth has a 0.81 correlation with Germany’s IFO Index with a one-month lead.

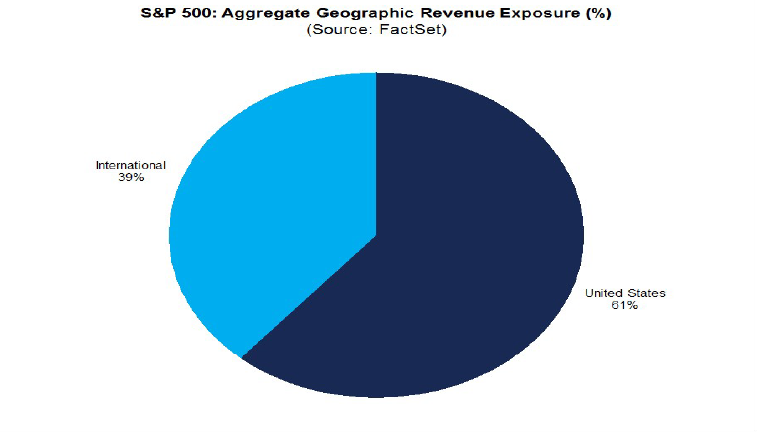
While the American economy is not highly exposed to trade, I remind readers that 39% of S&P 500 sales come from foreign sources. Non-US economic weakness will have an outsized effect on US equity prices, especially if the global investors pile into USD assets because US is viewed as a safe haven. A rising USD would have the double whammy of further depressing operating margins owing to poor exchange rate translation.
New Deal democrat’s Recession Watch
New Deal democrat, who monitors high frequency economic statistics and categories them into coincident, short leading, and long leading indicators, remains on “recession watch”, which he is careful to distinguish from an actual recession forecast:
The summary for my long leading forecast changes to the following:
- 3 negatives: Interest rates, housing, and credit conditions.
- 1 positive: Corporate profits.
- 1 neutral: Real retail sales per capita.
- 2 mixed indicators: Money supply and the yield curve.
In sum, with more complete information, the “Recession Watch” call centered on Q4 2019 remains, and in fact, has received more support. To reiterate, treat this in a similar way to a “Hurricane Watch”, as if the 5-day forecast cone for the hurricane included your area. There is an enhanced chance of the event occurring, but not a sure thing unless the conditions continue – in this case, the long leading indicators do not quickly reverse, and the short-term leading indicators turn negative for a sustained period of time
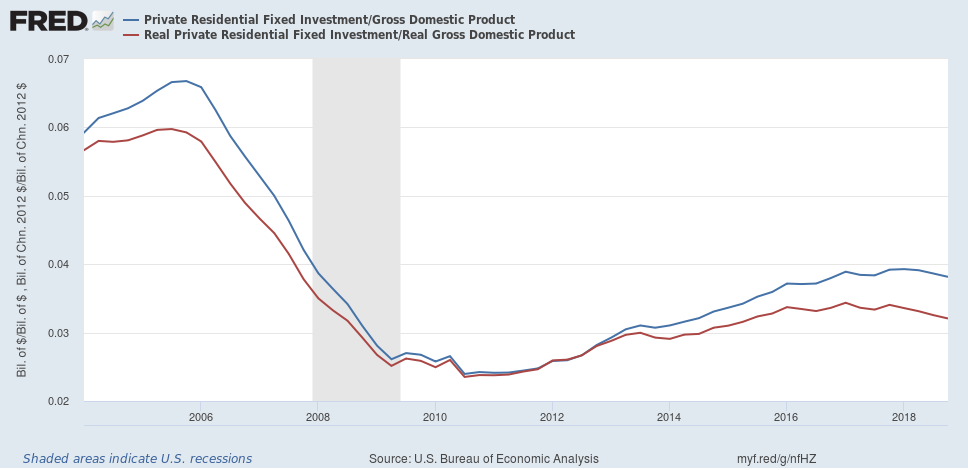
While the long leading indicators that measure corporate sector has been healthy, the household sector is not behaving well. Real private residential investment to GDP has been declining.
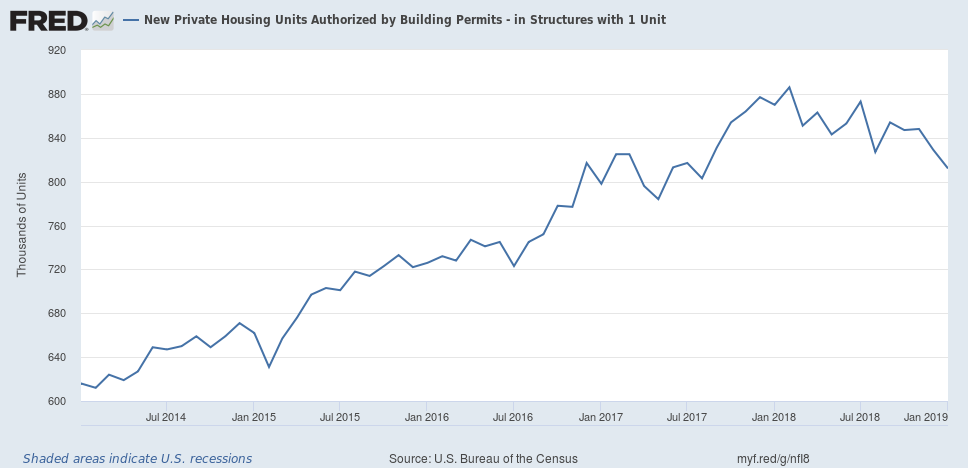
The cyclically sensitive housing sector has been weak. While monthly releases can be noisy, single family housing starts is one of the least volatile data series, and it peaked out about a year ago.
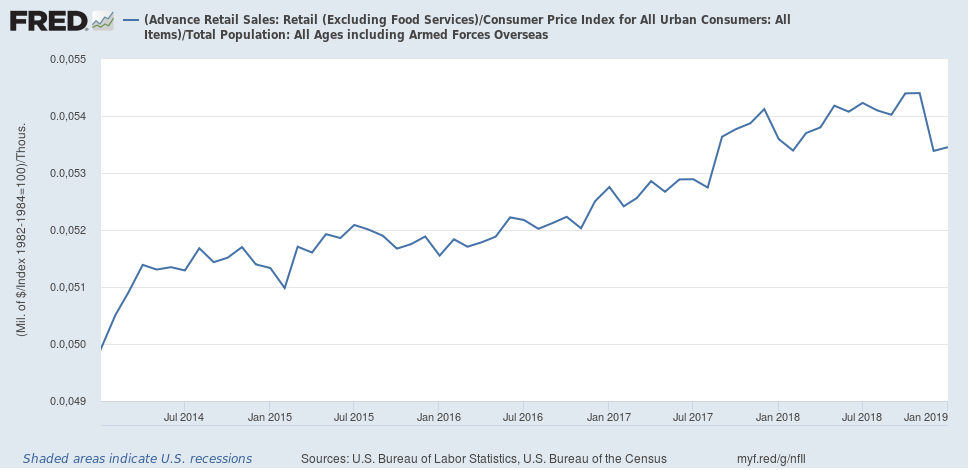
Real retail sales per capita has tended to peak ahead of past recessions. The last high was in October, and this indicator has been declining ever since.
In addition to the warnings raised by NDD, I would add that leading indicators of employment appear to be rolling over. Weakness in employment raises the concerns about a V-shaped turnaround in the unemployment rate pointed out by Antonio Fatas. Temporary employment growth has historically led Non-Farm Payroll in the last two cycles, and temp jobs seem to be topping out.

As well, the quits rate has been a useful indicator of labor market health, but it is part of the JOLTS data, which is reported with a time lag. This chart of the quits rate (blue line) and initial jobless claims (inverted scale, red line) suggests that the quits rate may be due to decline in near future. If this is indeed the inflection point, then it would indicative of a weakening job market.
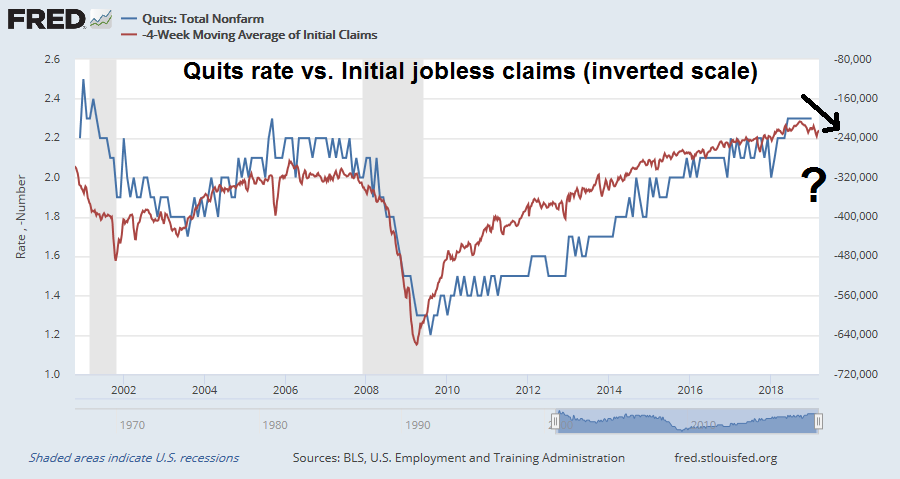
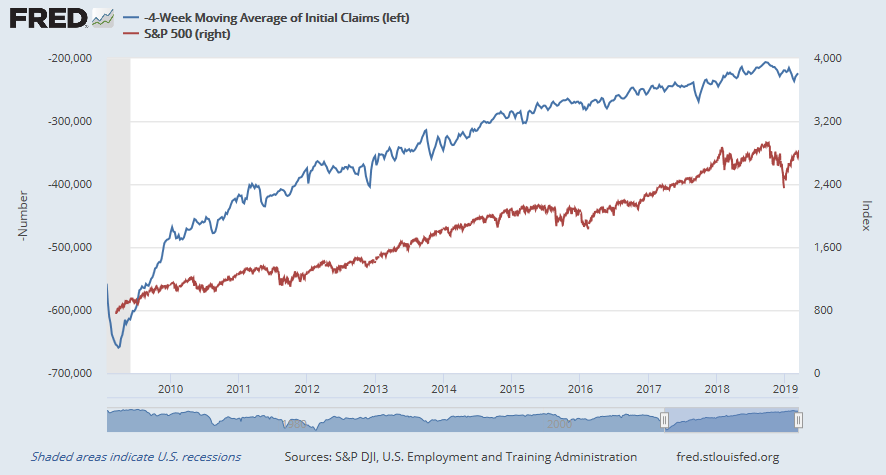
As an indication of the usefulness of the timely initial jobless claims, initial claims (inverted scale, blue line) have been remarkably correlated with stock prices during this expansion cycle.
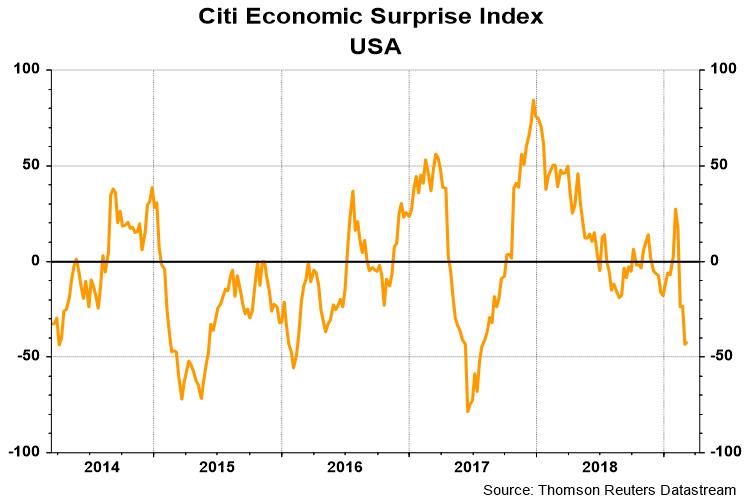
The Citigroup US Economic Surprise Index, which measures whether macro-economic data is beating or missing expectations, has been cratering, indicating the misses are worsening.
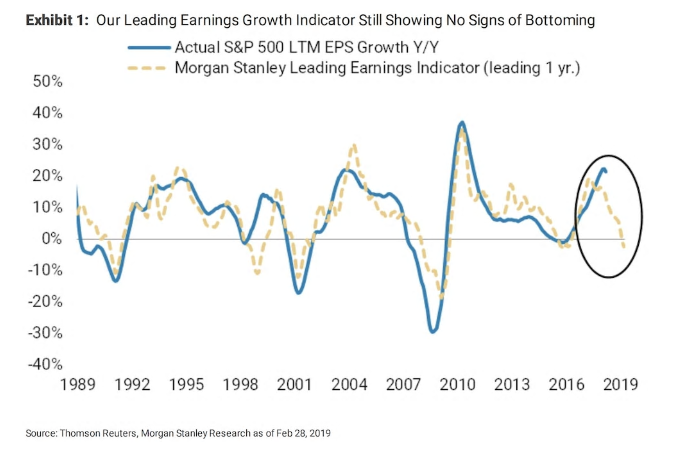
Business Insider reported that Morgan Stanley sounded a similar warning. Leading indicators are declining, and investors should be prepared for falling earnings growth.
FactSet reported that the Q1 negative guidance rate is 74%, which is above the 5-year average of 71%. In addition, Business Wire reported that a review by Gartner Inc. of earnings calls revealed a high degree of management anxiety about a downturn.
“S&P 500 company executives are concerned about the risks and uncertainty from government interventions rather than suspecting any global macroeconomic downturn in the near term,” said Tim Raiswell, vice president at Gartner’s finance practice. “Talk of capital and cost-efficiency programs was increasingly common in earnings calls as 2018 progressed.”
“Mentions of the words ‘downturn’ and ‘slowdown’ were four times more likely to appear in earnings call in 4Q18,” said Mr. Raiswell. “Yet it’s important to consider that 4Q18 brought relatively extreme drops in stock prices. After 10 years of economic expansion, it’s not surprising to see analysts asking company executives about their preparations for cyclical economic weakness.”
More importantly, slowdown fears are beginning to affect business confidence [emphasis added]:
“Given the lack of realistic precedents in many cases, all parties are largely guessing about the extent to which political rhetoric will become firm policy and what the impact will be on companies’ order books,” said Mr. Raiswell. “In this uncertain environment and after a long stretch of expansion since 2009, a significant number of leading firms are taking a recessionary stance and making preparations to capitalize on a downturn rather than be a casualty of one.”
Many large firms reported that cost management initiatives are well underway, largely targeting overhead categories such as marketing, advertising and finance, as well as direct industrial production costs. For example, P&G, Estée Lauder, Whirlpool and others all detailed significant firmwide productivity programs. Several vehicle manufacturers, such as Honda, Ford and Nissan, began initiatives to consolidate their production in fewer facilities to drive efficiencies. Many more firms reported deliberately lower capital expenditure than expected in 2018, as growth capital was reallocated.
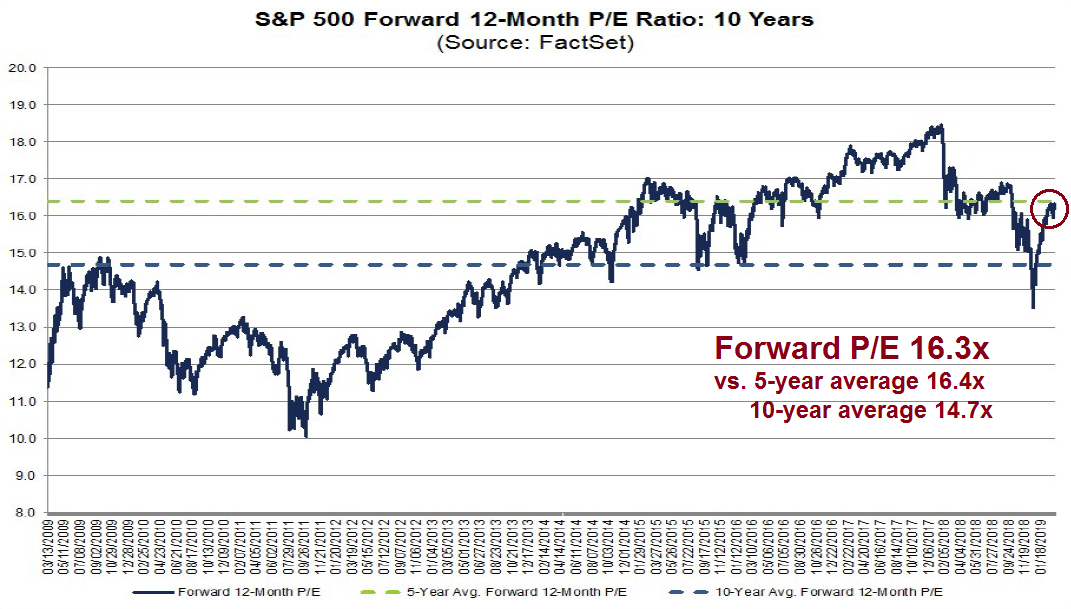
The S&P 500 trades at a forward P/E ratio of 16.3, which is just below its 5-year average of 16.4 and above its 10-year average of 14.7. In this environment of likely downgrades to the economic outlook and elevated valuation, investors need to be prepared for the possibility of disappointment and de-rating in the weeks and months ahead.
The Powell Put
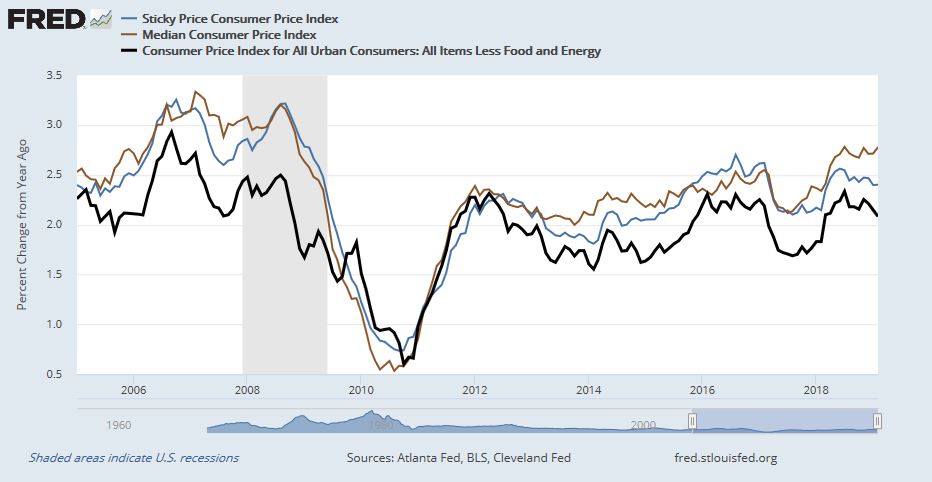
What about the Fed? Won’t it rescue the stock market? While we will hear more from the Fed at its upcoming FOMC meeting, it is difficult to see how its policy could become any more dovish in light of the current environment. The Fed’s past behavior indicates that it will ride to the rescue should stock prices crash, it is nevertheless constrained by its dual mandate of maximum employment and stable prices. As the chart below shows, while core CPI (black line) has softened, both median CPI and sticky price CPI are stubbornly firm. In fact, median CPI is at or near a cycle high, and these trends in inflation could handcuff the Fed from easing monetary policy should the economy weaken.
There is a Powell Put, but expect the strike price to be lower than current market levels. The Fed is likely to tolerate minor corrections, just not market crashes.
In conclusion, dark clouds are appearing on the economic horizon. While they do not necessarily mean that a hurricane is ahead, investors have to be prepared for storm fears, and act accordingly. I reiterate my belief that any growth scare is likely to be temporary. There are few signs of excesses in the US, if unwound, that are likely to plunge the American economy into recession. Most of the risks come from abroad. China is the main source of global concern, and it has already begun another stimulus program, and Beijing is going to pull out all stops to ensure the economy is not tanking ahead of its 70th anniversary of Mao`s revolution in October. Therefore any growth jitters are likely to be ephemeral, and any resulting market weakness will only be only corrective in nature.
The week ahead: From one BB to another
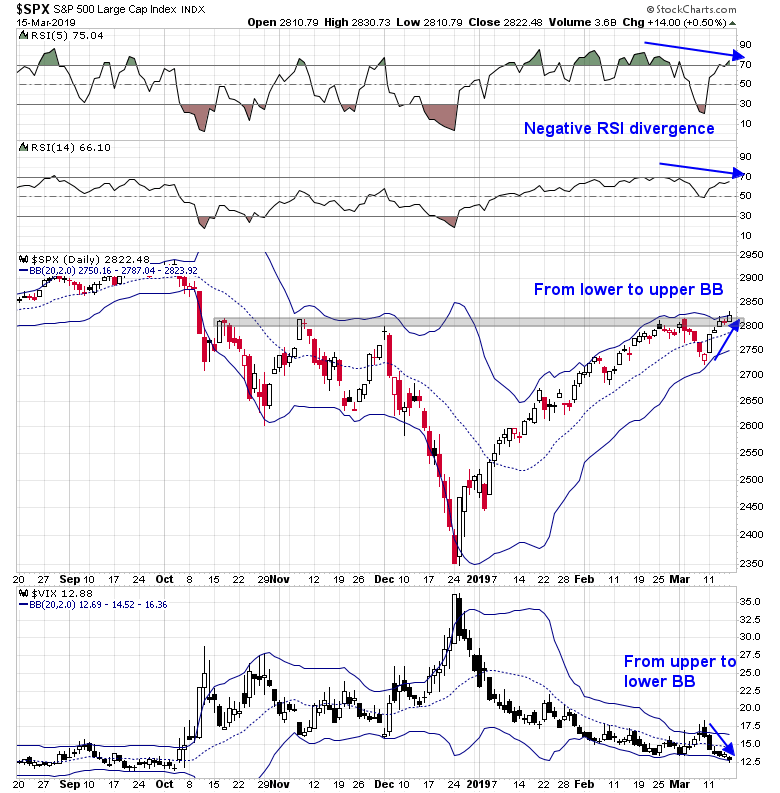
Looking to the week ahead, the market staged a remarkable rally last week as indices moved from one end of the Bollinger Band to the other. The VIX Index (bottom panel) fell from the top of its BB to the bottom in five days. At the same time, the S&P 500 rallied from the bottom of its BB to the top. The market is not testing a resistance zone while exhibiting negative RSI divergences, which is a sign calling for caution.
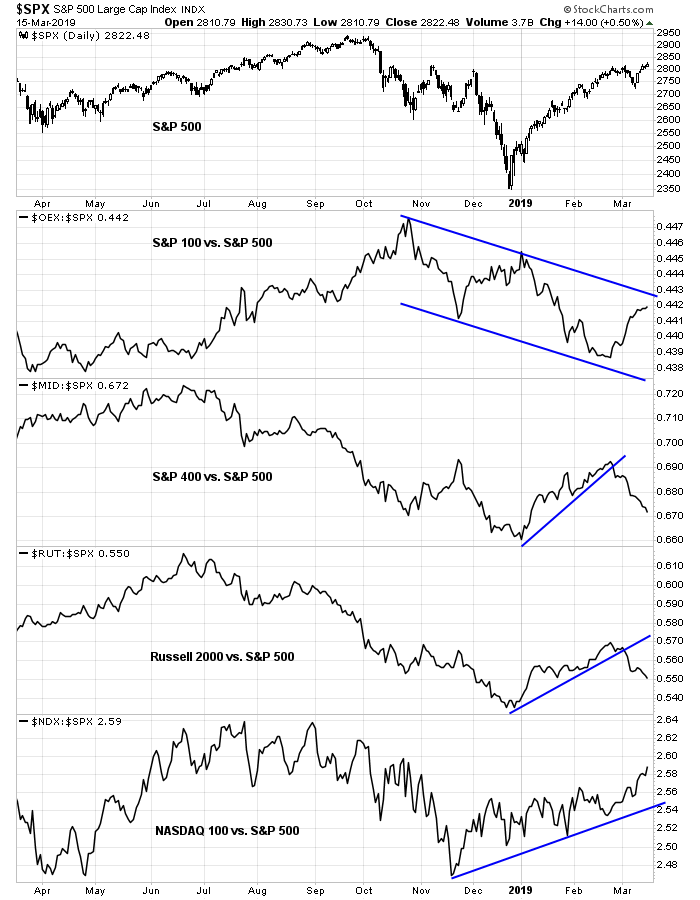
Another worrisome sign is the narrowness of market cap leadership. The relative performance of the megacap S&P 100 is in a relative downtrend, and so are the mid and small cap stocks. The only index showing any leadership are the NASDAQ 100 stocks, indicating narrow leadership.
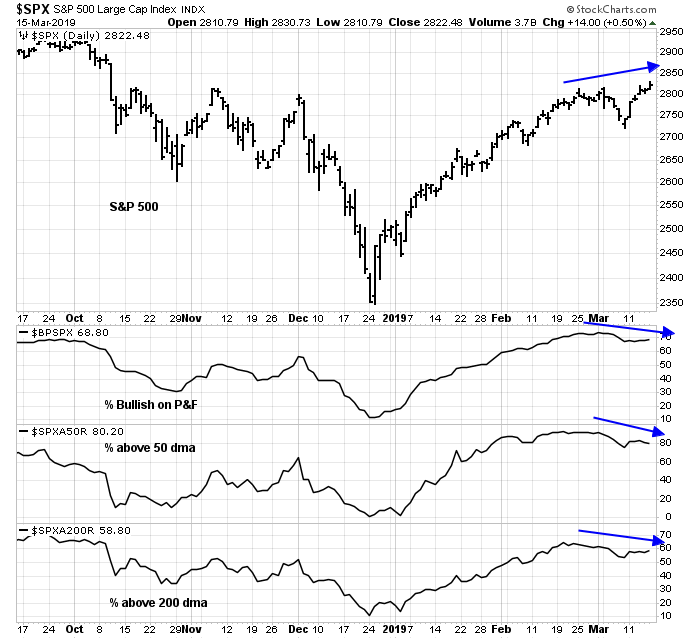
Selected breadth indicators are also displaying a series of negative divergences as well. % bullish, % above their 50 dma, and % above their 200 dma are making lower highs even as the S&P 500 made higher highs in the past two weeks.
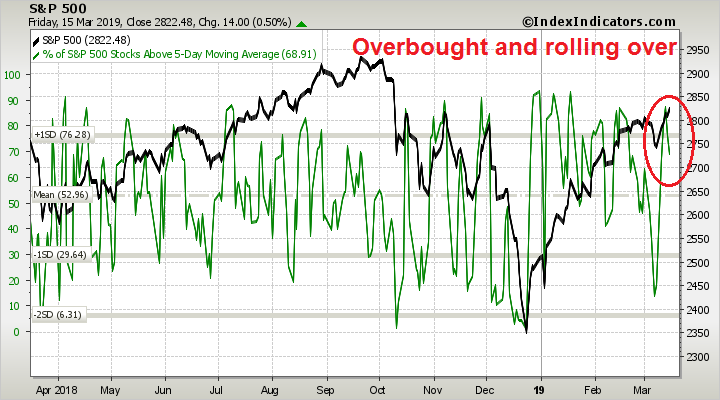
Short-term breadth was overbought and rolling over, which is often a signal of short-term weakness.
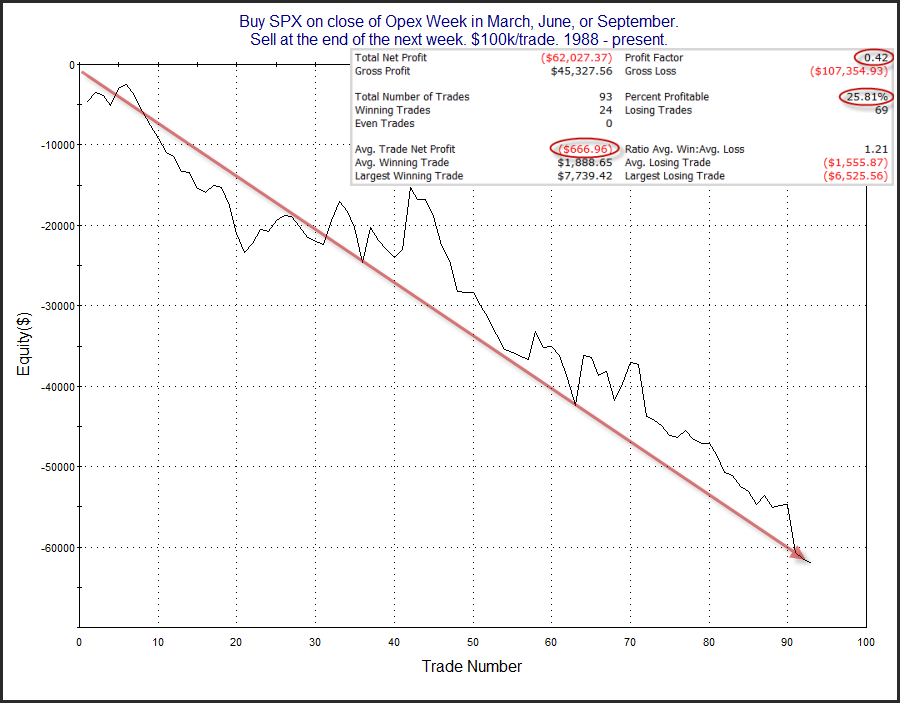
Notwithstanding the unpredictability of the market reaction to next week`s FOMC meeting, the market also faces historical headwinds in the upcoming week. Rob Hanna at Quantifiable Edges observed that the week after quadriple witching tends to have a bearish bias.
My inner investor is neutrally positioned at roughly his target asset allocation weights. My inner trader has been leaning bearish and he increased his short positions as the market rallied last week.
Disclosure: Long SPXU
You’re conclusion is that the growth scare is likely to prove temporary. Given that the stock market is a discounting mechanism, could it be that the market is looking beyond the current weakness?
While that interpretation is always possible, the market has not reacted at all to the growth scare at all. It seems unusual that the market is ignoring all of the negative corporate guidance and earnings downgrades.
Agree with Cam, the market has not reacted to the new information available which has been discounted by Sovereign bond markets across the globe. I think either next weeks and certainly begin of April might be a shocker for markets when participants finally see that earnings can actually move quite fast down as margins decrease. Catalyst in my opinion will be news from the earnings front when discounting for Q2-Q3. Which should happen rather sooner than later. I’m looking to this as an opportunity to get long in US after being long already in EM and China.
Happy to hear other thoughts.
A good debate needs a person on the other side. In fact, behavioral economics has a bias called ‘Confirmation Bias’ that says we humans erroneously tend to read and hear things that agree with our previous conclusions. The antidote is to read opposing views. So hear is mine.
I believe we are in a new bull market being led by China. I stated many months ago that China would lead the world’s stock markets and it has. On October 29, they started a multi-year bull. Emerging markets are following. Europe and the US are more muted but they too are in a new bull market.
All of these especially China fulfilled my three ‘Big Picture’ attributes (Value, Investor Sentiment, Central Bank Policy/Leading Economic Indicators) of a new bull market. Markets got cheap, investor sentiment got panicky and Central Bankers turned stimulative.
You might say, the US market isn’t cheap. When I look at the chart above of S&P earnings growth versus the Morgan Stanley future growth estimate most people see the future looking mediocre. What I see is the Last Twelve Months number well over 20%. That means from the beginning of 2018 to now, the earnings are up over 20%. And since the stock market is still down 5% from its first quarter peak, that means it’s about 25% cheaper that it was back then. Plus the future shows that these earnings are sticking and not just a one year tax boost. The lower tax rate sticks and as pre-tax earnings go up from here, we will see earnings growth from this new higher base.
The Powell new dovish stance is a HUGE long-term plus. It is a big positive surprise because he was on record as a hawkish critic of QE and said in the past that the Fed should ignore the stock market. He has turned 180 degrees. THANK YOU SIR.
Longer term blog readers know my ‘Moonless Economy’ view. All and I repeat ALL, Central Bankers in the last few months have turned ultra-dovish on interest rates and QT is also now a non-factor too. We are in a Moonless World. Parts of the economy may have ebbs and flows but not a Central Bank generated synchronized economy-wide recession.
So that means I disagree with the studies in the first half of today’s post that look back at correlations in the old Mooned World. All of those recessions happened with Central bank tightening after the economy overheated and they raised rates to choke off inflation. That won’t happen in a Moonless World. So the past studies are a false guide. In fact, Fatas even found that when he added to his employment research ‘those associated to macroeconomic imbalances (such as inflation) and those associated to financial imbalances’ the correlations WENT AWAY. In a Moonless World, the Fed does not create the imbalances as before and quickly comes to the aid when any start to appear.
What we get in a Moonless World is an economy that does not have huge waves in interest rates crashing over the general economy. That doesn’t mean particular industries can’t have their ebbs and flows within their own cycles. People overbuild and then suffer. Investors push a given popular sector’s stocks too high and they fall. It’s human nature. Just don’t think these are macro events in a Moonless world effecting the whole stock market.
Banks are a case in point. They are exhibiting relative weakness. In old times that could be a sign of macroeconomic problems ahead. A heads-up for the whole stock market. But in this new world, it could just be a growing sense that Democrats with a restrictive policy stance are heading into power. It could be digital competitors disrupting their industry. I see the Junk Bond Spread Index showing shrinking spreads which tells me that credit quality is not a concern. If we had macroeconomic problems junk spreads would be blowing out. A new bull market witnesses spread shrinking and that’s what’s happening. Look elsewhere than the macro-economy for bank stock price problems.
So give Powell and big hug and get bullish about this cheap US market and even possibly better global areas.
If you still have doubts, the safest approach is owning super-boring Dividend ETFs. If interest rates are tame with the new dovish Fed, they are a natural and could have surprising high returns.
Interesting, thanks for sharing. How would you see the slope of the U.S. yield curve going forward under this scenario? Flat or short rates low and long moving higher and to what extent?
The U.S. Treasury has huge borrowing needs due to high deficits. Where they decide to tap markets will be key. To help the economy, they would avoid as much as possible the long end that influences mortgage rates. So They borrow short and lingering economic softness from 2018 Fed tightening will allow that without too much upward pressure to invert.
All that to say flat yield curve to year end.
As we progress through 2019, expect worries of a recession in 2020 will fade. The sooner that happens, the sooner we might see a bit of steepening. Remember in a Presidential election year, all parties will be making economy friendly legislation.
As we enter 2020, if MMT becomes a major policy movement of the Democrats, I would expect investors to shy away from long bonds. MMT could be a BIG inflation worry.
Sounds right, thanks…
“Super boring dividend ETFs”.
Ae you referring to dividend paying stocks or bond ETFs?
I’m referring to dividend ETFs like SDY and DVY
These ETFs own dividend stocks. The SDY owns stocks in companies that have raised their dividends every year for 25 years. These are called Dividend Aristocrats. DVY uses a quality screening system.
Thanks for the clarification. Your analysis is diametrically opposite of Cam’s though. Cam has cut back longer term equity exposure last year circa August (Red sky at Dawn missive).
ECRI is also expecting a cyclical downturn (because of business cycle). Here is an article and a TV appearance:
https://www.businesscycle.com/ecri-news-events/news-details/economic-cycle-research-ecri-lakshman-achuthan-business-cycle-fox-business-oped-recession-or-not-it-s-out-of-trump-s-hands
https://www.businesscycle.com/ecri-news-events/news-details/conomic-cycle-research-ecri-lakshman-achuthan-business-cycle-bloomberg-daybreak-asia-interview-trump-xi-trade-china-outlook-fed
In early 2011, BKX/SPY broke down support with corresponding correction in SPY in October. But that also marked the bottom in SPY.
We have very similar situation today with BKX/SPY broke down support late last year, followed by a 20% correction in SPY. If history repeats, SPY has bottomed after the correction.
The move of prices from the lower BB to upper BB in 5 days isn’t remarkable at all because the BB is pinching and therefore quite narrow. It would be remarkable if they can do so from December low.
In last November when the BB width is considerable wider, but the prices moved from lower BB to upper BB in 6 sessions. That’s also not very remarkable because it was a bear rally which is usually powerful.
I’m hoping you’re right. I bought some TVIX and SOXS on Friday.
Ken: Thanks for taking the time to post this. Third year of the Presidential Cycle, Seasonality winds at our backs, Breadth Indicators leading the way. When I feel this good, that ain’t good.