Preface: Explaining our market timing models
We maintain several market timing models, each with differing time horizons. The “Ultimate Market Timing Model” is a long-term market timing model based on the research outlined in our post, Building the ultimate market timing model. This model tends to generate only a handful of signals each decade.
The Trend Model is an asset allocation model which applies trend following principles based on the inputs of global stock and commodity price. This model has a shorter time horizon and tends to turn over about 4-6 times a year. In essence, it seeks to answer the question, “Is the trend in the global economy expansion (bullish) or contraction (bearish)?”
My inner trader uses a trading model, which is a blend of price momentum (is the Trend Model becoming more bullish, or bearish?) and overbought/oversold extremes (don’t buy if the trend is overbought, and vice versa). Subscribers receive real-time alerts of model changes, and a hypothetical trading record of the those email alerts are updated weekly here. The hypothetical trading record of the trading model of the real-time alerts that began in March 2016 is shown below.

The latest signals of each model are as follows:
- Ultimate market timing model: Sell equities
- Trend Model signal: Neutral
- Trading model: Bearish
Update schedule: I generally update model readings on my site on weekends and tweet mid-week observations at @humblestudent. Subscribers receive real-time alerts of trading model changes, and a hypothetical trading record of the those email alerts is shown here.
Momentum is dying
I have been cautious on the near-term equity market outlook for several weeks (see Here comes the growth scare and Still bullish, but time to reduce risk). I reiterate my point for being bullish and bearish over different time frames. While I believe stock prices will be higher by year-end, investors should be prepared for some turbulence over the next few months.
We are now seeing definitive technical evidence of a softer market in the near-term. Momentum is dying, and across a variety of dimensions. One key technique that I use to monitor momentum is the behavior of different moving averages. If the shorter moving average starts to roll over while the longer moving average continues to rise, that’s a sign of fading price momentum.
The chart below depicts the weekly S&P 500 chart, with a MACD histogram on the bottom panel. Note how MACD, while still strongly positive, is starting to roll over. I find that the weekly chart is useful for intermediate term price moves while filtering out the noise from daily fluctuations.

In the past, such episodes have resolved themselves with either a sideways consolidation or market downdraft. I expect that the most likely outcome is a correction that will last 1-3 months, followed by a resumption of the bull market.
Dying momentum everywhere
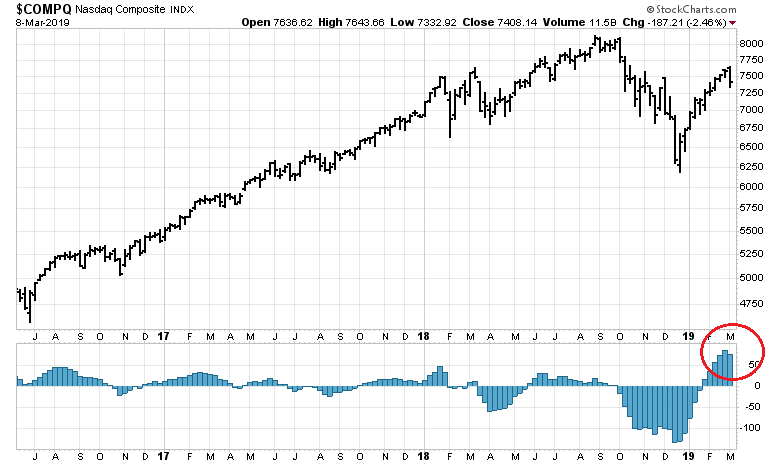
Evidence of fading price momentum can be found everywhere. The MACD rollover can be found in a variety of stock indices. Here is the NASDAQ Composite.
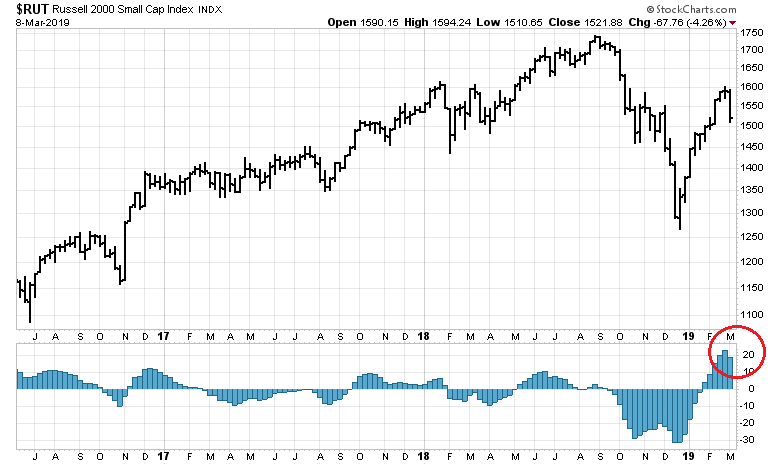
The small cap Russell 2000 is also rolling over.
The fading price momentum effect can be seen globally. Here are non-US developed market equities, as measured by EAFE.

Emerging market stocks started to fade several weeks ago, ahead of developed markets (see An EM warning).

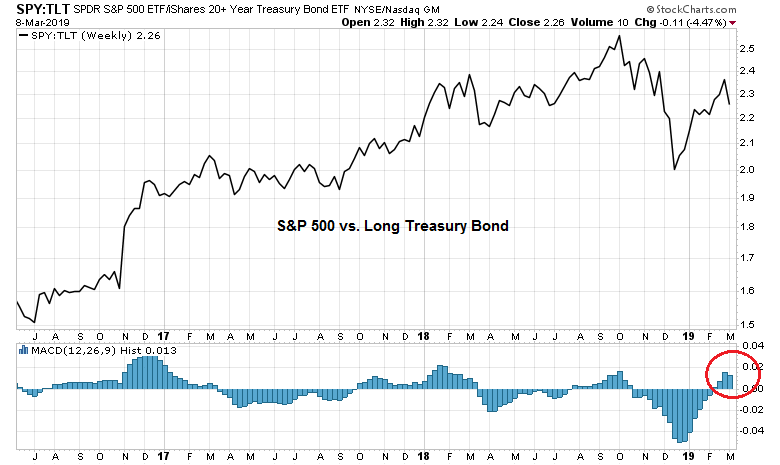
Risk appetite indicators are also losing momentum. The stock/bond ratio is exhibiting a pattern of MACD histogram rollover.
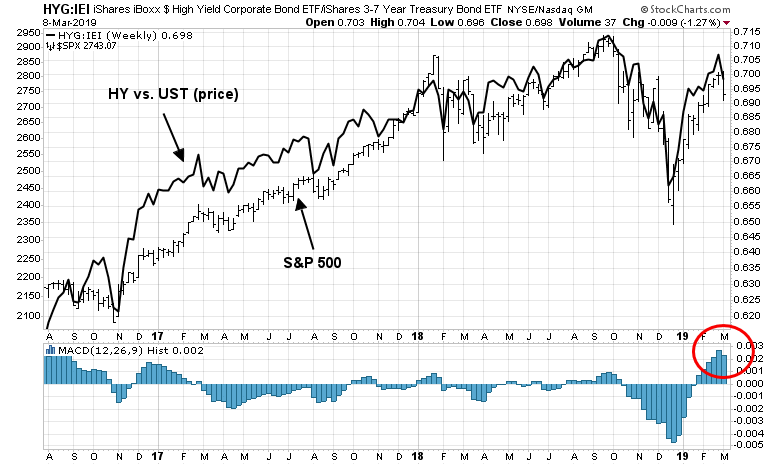
High yield (junk) bond prices, net of interest rate effects, have been highly correlated with stock prices, and momentum is dying as well in this asset class.
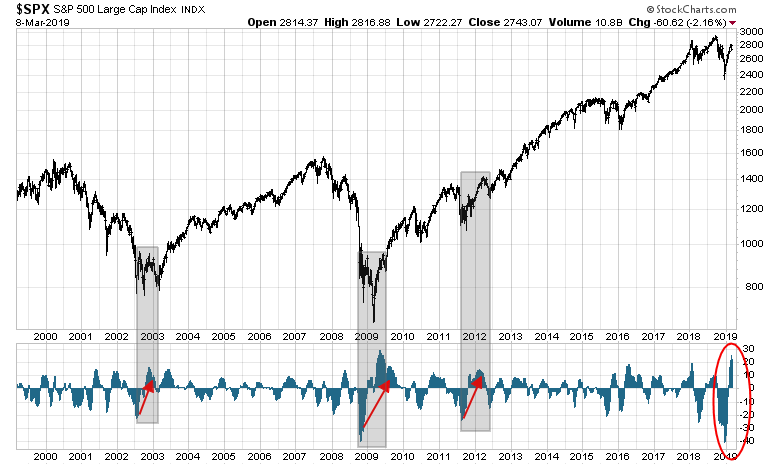
Even more ominous is the analysis from John Murphy of Stockcharts, who concluded from waning momentum that the market may have peaked in late 2018 and it may be undergoing a topping process:
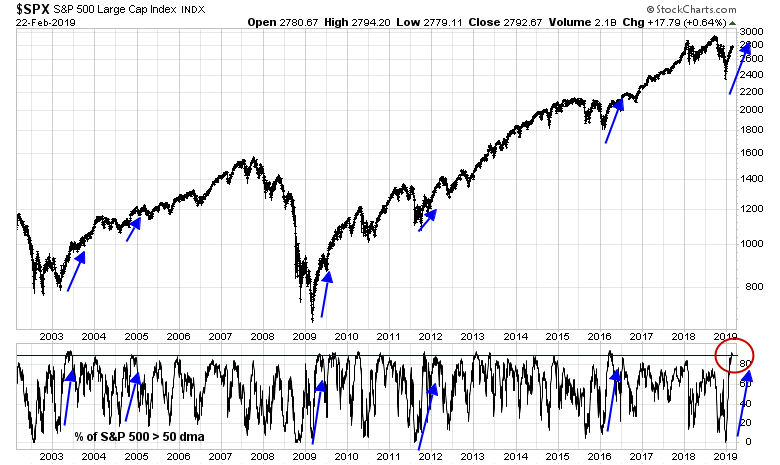
LONG-TERM MOMENTUM IS ALSO WEAKENING… The monthly bars in Chart 2 show the uptrend in the S&P 500 that started exactly ten years ago. And that uptrend is still intact. The sharp selloff that took place during the fourth quarter of 2018 stayed above the rising trendline drawn under its 2009, 2011, 2016 lows. That’s the good news. What may not be so good are signs that long-term momentum indicators are starting to weaken. The two lines in the upper box in Chart 2 plot the monthly Percent Price Oscillator (PPO). [The PPO is a variation of MACD and measures percentage changes between two moving averages]. The PPO lines turned negative during the second half of last year when the faster red line fell below the slower blue line. And they remain negative. [The red histogram bars plotting the difference between the two PPO lines also remain in negative territory below their zero line (red circle)]. Secondly, and maybe more importantly, the 2018 peak in PPO is lower than the earlier peak formed at the end of 2014. That’s the first time that’s happened since the bull market began. In technical terms, that creates a potential “negative divergence” between the PPO lines and the S&P 500 which hit a new high last year. That raises the possibility that the ten-year bull market may have peaked in the fourth quarter of 2018 and is now going through a major topping process. If the peaking process in stocks has already started, that could start the clock ticking on the nearly ten-year economic expansion that also started during 2009.

Weak fundamental momentum
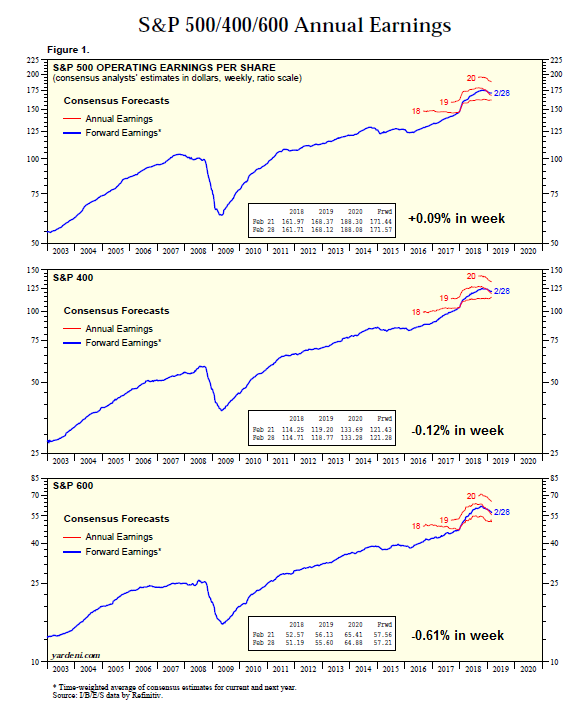
In addition to evidence of fading price momentum, the market is also faced with the prospect of negative fundamental momentum. The latest update from Yardeni Research Inc. shows that forward 12-month large cap EPS estimates edged up last week, but within the context of a multi-week downtrend. The strength in large cap estimates was not confirmed by mid and small cap estimates, both of which continued to fall.
We can see the effects of price and fundamental momentum from two ETFs. The relative performance of MTUM (black line) represents the returns of a pure price momentum factor. By contrast, FFTY is the IBD 50, which relies on a composite of fundamental and price momentum factors to construct its portfolio. As the following chart shows, the relative performance of both factors have been highly correlated until last fall. Since then, price momentum has been flat to down during the latest rally, while IBD 50 momentum has begun to roll over in the last few days.

Recession scare ahead?
Last Friday’s shockingly weak Employment Report also raises some concerns of fading macro momentum. While the weak February headline Non-Farm Payroll figure could be attributable to a data blip, or mean reversion from the strong January report, the internals of the report show signs of economic weakness. Temporary employment, which has historically led NFP, is topping out. This suggests that employment will weaken further in the coming months.

Equally worrisome is the outright loss of 31K in construction jobs, Construction employment growth has either been coincident or led past recessions. That`s not a surprise, as housing is a highly cyclical industry and a key barometer of economic health.

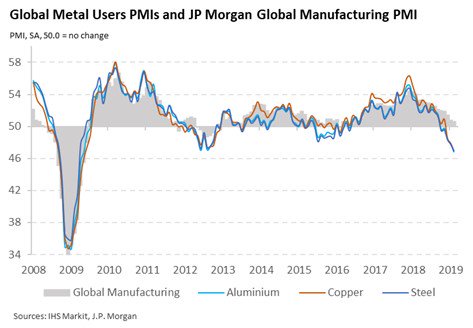
The message from the commodity markets is equally downbeat. Despite an apparent recovery in industrial metal prices, the internals are less bright.

However, IHS Markit pointed out that global metal users PMI has been declining, which is indicative of a softening manufacturing environment.
Business Insider (paywall) reported that the UBS US recession had spiked. However, these readings have to be taken with a grain of salt. Note the past false positives, which are highlighted on the chart.

Still bullish to year-end
Despite these short-term negatives, I remain bullish on equities to year-end, and believe that any growth scare is only temporary in nature for several reasons.
The first reason is the existence of a Trump Put. Bloomberg reported that Trump believes his 2020 re-election prospects goes through the stock market:
President Donald Trump is pushing for U.S. negotiators to close a trade deal with China soon, concerned that he needs a big win on the international stage — and the stock market bump that would come with it — in advance of his re-election campaign.
As trade talks with China advance, Trump has noticed the market gains that followed each sign of progress and expressed concern that the lack an agreement could drag down stocks, according to people familiar with the matter. He watched U.S. and Asian equities rise on his decision to delay an increase in tariffs on Chinese goods scheduled for March 1, one of the people said.
Trump has become obsessed with stock prices as a metric of his administration’s success. Even if the much anticipated trade deal doesn’t produce a market pop, he may be tempted to take other means to boost stock prices.
Trump’s fixation on stock-market performance has shaped his assessments of his economic policies. Top White House staff know to be aware of how markets are performing when summoned to the Oval Office to speak with Trump because the president often asks: ‘‘What’s happening with the markets?’’
The second reason is the Powell Put. The minutes of the January FOMC meeting makes it clear that the Fed is monitoring the stock market [emphasis added]:
Following the briefing, participants raised a number of questions about market reports that the Federal Reserve’s balance sheet runoff and associated “quantitative tightening” had been an important factor contributing to the selloff in equity markets in the closing months of last year. While respondents assessed that the reduction of securities held in the SOMA would put some modest upward pressure on Treasury yields and agency mortgage-backed securities (MBS) yields over time, they generally placed little weight on balance sheet reduction as a prime factor spurring the deterioration in risk sentiment over that period. However, some other investors reportedly held firmly to the belief that the runoff of the Federal Reserve’s securities holdings was a factor putting significant downward pressure on risky asset prices, and the investment decisions of these investors, particularly in thin market conditions around the year-end, might have had an outsized effect on market prices for a time. Participants also discussed the hypothesis that investors may have taken some signal about the future path of the federal funds rate based on perceptions that the Federal Reserve was unwilling to adjust the pace of balance sheet runoff in light of economic and financial developments.
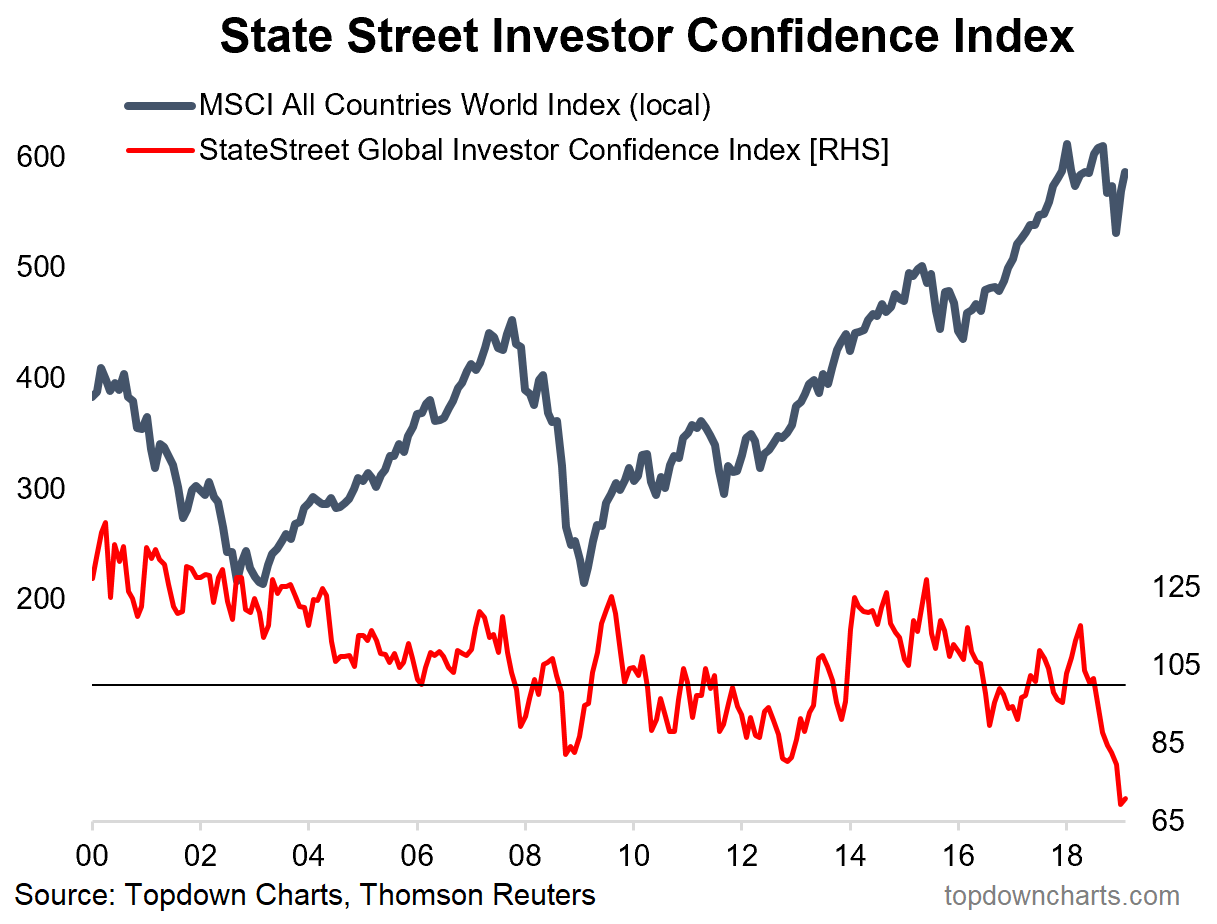
In addition, both the BAML Fund Manager Survey and the compilation of State Street investor confidence from Callum Thomas of Topdown Charts shows that institutions are already defensively positioned. While other segments of the markets, such as retail investors, are not similarly cautious, these reading should put a floor on stock prices in the event of bearish news.
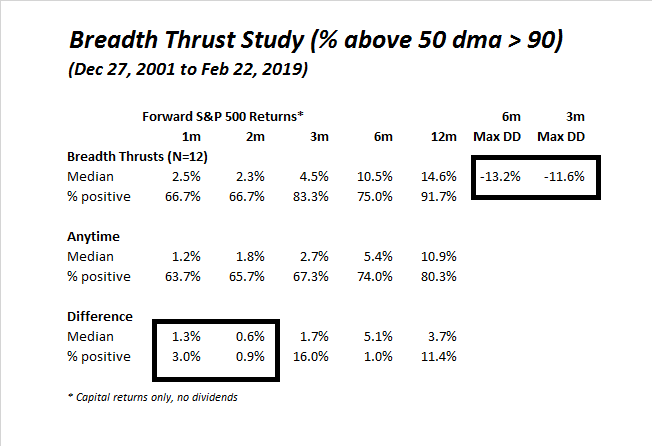
Lastly, investors should not ignore the powerful effects of a breadth thrust. If history is any guide, stock prices are almost invariably higher after a breadth thrust such as the one experienced in January, even though interim corrections may occur shortly after the event.
I had highlighted the results of my historical study in a past publication (see Still bullish, but time to reduce risk) which shows that excess return (bottom panel) weakens after two months, but rises thereafter. Moreover, three and six month maximum drawdowns are in the 11-13% range, indicating the possibility of a interim pullback.
I went back 20 years, and found very few instances like the one we are encountering today. There were not many episodes where the weekly MACD histogram had been deeply negative, rose strongly, and rolled over. In all cases (n=3), the market pulled back. In two of the three cases, the correction was relatively minor and the market did not re-test its previous low.
Buy the dip, or sell the rip?
My base case scenario calls for a correction of 1-3 months in length, but without a re-test of the December lows. The depth of the pullback will be a function of any growth scare, and the details of the US-China trade agreement. As always, I will be data dependent.
I have written before that I am both bullish and bearish on different time frames, and current circumstances suggest different positioning for traders and investors. Traders with time horizons of up to three months should be tilted bearishly, and be prepared to sell or short into market strength. On the other hand, longer term oriented investors should view any market weakness as an opportunity to deploy funds into equities in anticipation of higher prices later in the year.
The week ahead
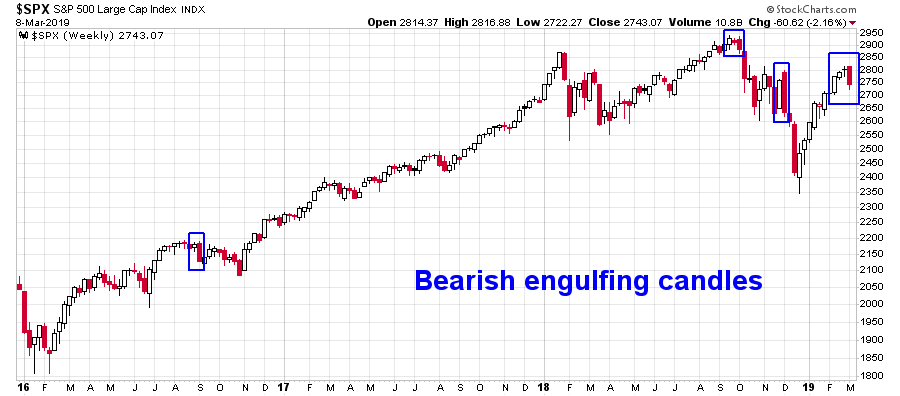
I have been tactically cautious on the equity market outlook in these pages for the past few weeks, and it appears that the technical break has finally appeared. The S&P 500 ended the week with a bearish engulfing candle that erased two weeks of gains. Past instances of such formations have tended to be bearish, but traders should be prepared for a backtest rally in the upcoming week.
One of the bearish setups that I highlighted before was the unusual high correlation between stock and gold prices. In the past, such episodes have resolved themselves with a trend reversal in stock prices, which seems to be finally happening.

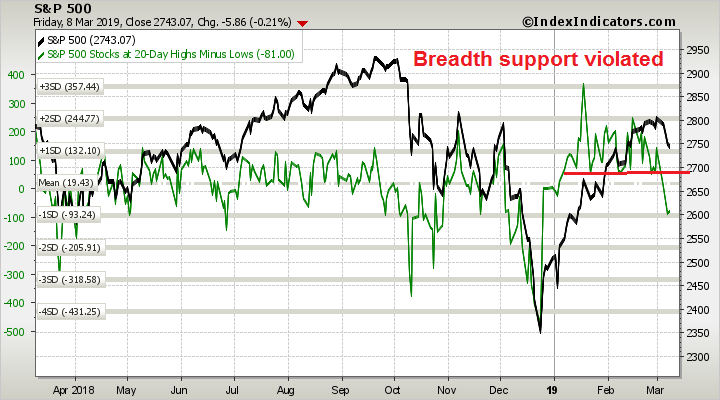
Too much technical damage has been done to believe that the market could just simply bounce and advance to test the old highs. One of my bearish tripwires was the violation of breadth support, as defined by the net 20 day highs-lows. In addition, the S&P 500 also breached its 200 dma last week, which is an important psychological level.
The technical damage is not just isolated to US equities. Chinese stocks had rallied through a key resistance zone on the excitement of stimulus, MSCI re-weighting of Chinese shares in its global indices, and a likely trade deal, only to see them crater late last week below support turned resistance when it became evident that growth was faltering. Moreover, the SCMP report that insiders are selling even as foreigners buy in did not help matters. In addition, US soybean prices, which are sensitive to the expectations of a trade truce, failed to stage an upside breakout through resistance, and they have weakened to test support.

In anticipation of the question, I have no idea how far down the correction might run. My working hypothesis is a 5-10% pullback, but that is only just a guesstimate. However, there are ways of spotting bottoms, but none of the signs are in place.
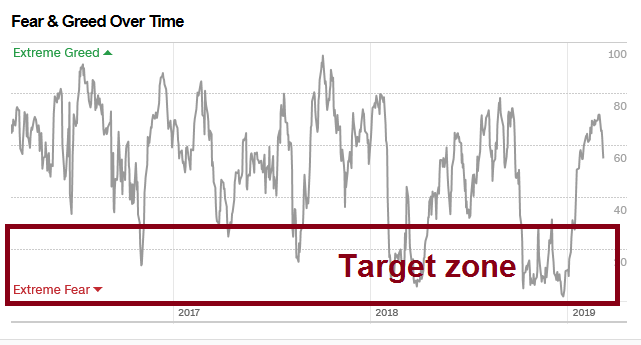
The Fear and Greed Index remains elevated, and I would like to see it fall to a minimum of 30 before declaring the possibility of a bottom are in place.
The VIX Index neared the top of its upper Bollinger Band (BB) last Friday, which can be a signal that a short-term bottom is near. However, past instances of VIX closes above its upper BB that was not accompanied by an S&P 500 close below its lower BB (light yellow shaded regions) have seen stock prices weaken further. By contrast, the combination of VIX closes above its upper BB and S&P 500 below its lower BB (grey shaded regions) have marked reasonable long entry points for traders.

To be sure, the market is oversold short-term, and a 1-2 day relief rally could happen at any time.

Next week is option expiry week. Rob Hanna at Quantifiable Edges pointed out that March OpEx is one of the more bullish OpEx weeks of the year.

These conditions argue for a short-term relief rally that begin early in the week, followed by either more choppiness or a resumption of the bear trend.
My inner investor is neutrally positioned with his asset allocation at roughly his target weights. Should stock prices correct further, he is prepared to raise his equity weight. My inner trader was short going into the decline, and he is getting ready to add to his shorts should the market rally. In other words, my inner investor is getting ready to buy the dip, while my inner trader will sell the rips.
Disclosure: Long SPXU
Cam: Below is an interesting piece on the ‘implications’ of SPX’s crappy performance last week – red, every day for week.
Oops, can’t past the link but this is close.
http://www.330ramp.com/oddstats. May support your case for a relief rally. & then……..
Here is the complete link: https://www.330ramp.com/oddstats/2019/3/8/odd-stat-of-the-day-3819
Let us draw a line between 2550-2600 (see graph of S&P 500) above, for good support. Cam has defined 1-3 months time frame. Possible catalysts for such a correction may be a hard Brexit, a China deal deadline that is pushed ahead, Mueller probe that affects the White House.
Indian market seems to be enjoying a decent rally as Modi announces elections. Presuming Modi wins, the next Fibonacci level (from 32-34 k Sensex), takes one to 51k. Such a rally is likely to be accompanied by INR strengthening against US $. US ETFs that invest in India, are not hedged, and hence their returns would reflect gains in Indian market and also gains in Indian Rupee against US $. Sensex may not run into resistance here at around 38, and may attain a breakout high, finally (see long term charts).
“This is typical post-Breakaway Momentum action and suggests – as crazy as it may seem – that this is a new #CyclicalBullMarket.
Just pointing out that we seem to be getting more and more confirmations as time goes by, so continuing to assume it’s a cyclical bull market until proven otherwise.”
https://twitter.com/WalterDeemer/status/1105101792768151552
Check this;
https://twitter.com/LizAnnSonders/status/1105174842402316288
https://twitter.com/LizAnnSonders/status/1105437725715562496
Without a significant catalyst, it is hard to see how we crack 2800 on the S&P 500. That catalyst may be a QE!
I know that everyone focuses on the Atlanta Fed’s GDPNow, but there are other nowcasts of Q1 GDP growth.
NY Fed at 1.4%
https://www.newyorkfed.org/research/policy/nowcast.html
St. Louis Fed at 2.18%
https://fred.stlouisfed.org/series/STLENI
Early nowcast readings move all over the place, and they don’t really stabilize towards a reasonable estimate until just before GDP gets reported.
D.V.
hahahaha. This is almost comical, how this market keeps going up, defying fundamentals. The market seems it might end up over 2800 today. I don’t know where the strength is coming from, I am at a loss.