Preface: Explaining our market timing models
We maintain several market timing models, each with differing time horizons. The “Ultimate Market Timing Model” is a long-term market timing model based on the research outlined in our post, Building the ultimate market timing model. This model tends to generate only a handful of signals each decade.
The Trend Model is an asset allocation model which applies trend following principles based on the inputs of global stock and commodity price. This model has a shorter time horizon and tends to turn over about 4-6 times a year. In essence, it seeks to answer the question, “Is the trend in the global economy expansion (bullish) or contraction (bearish)?”
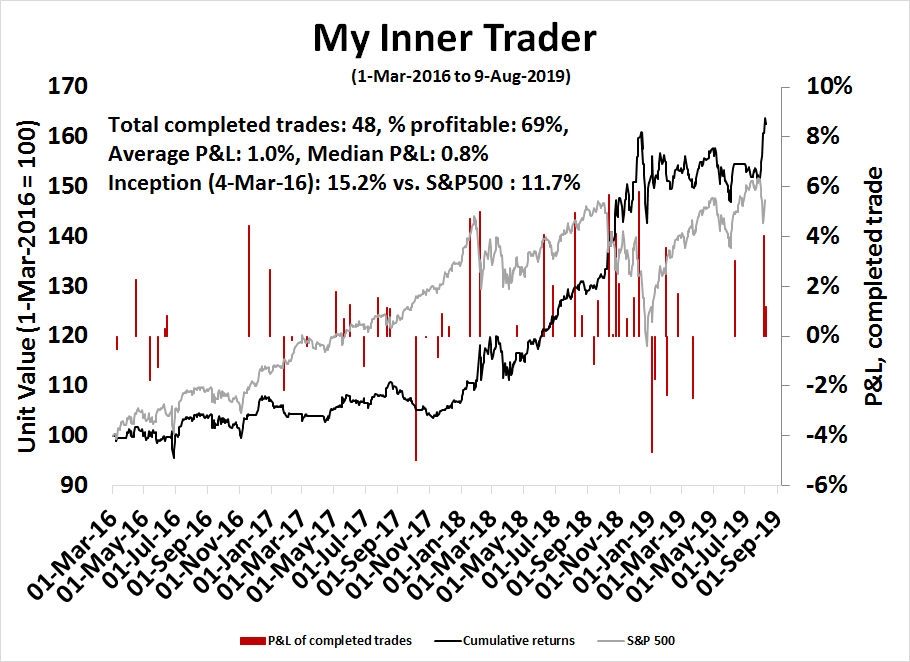
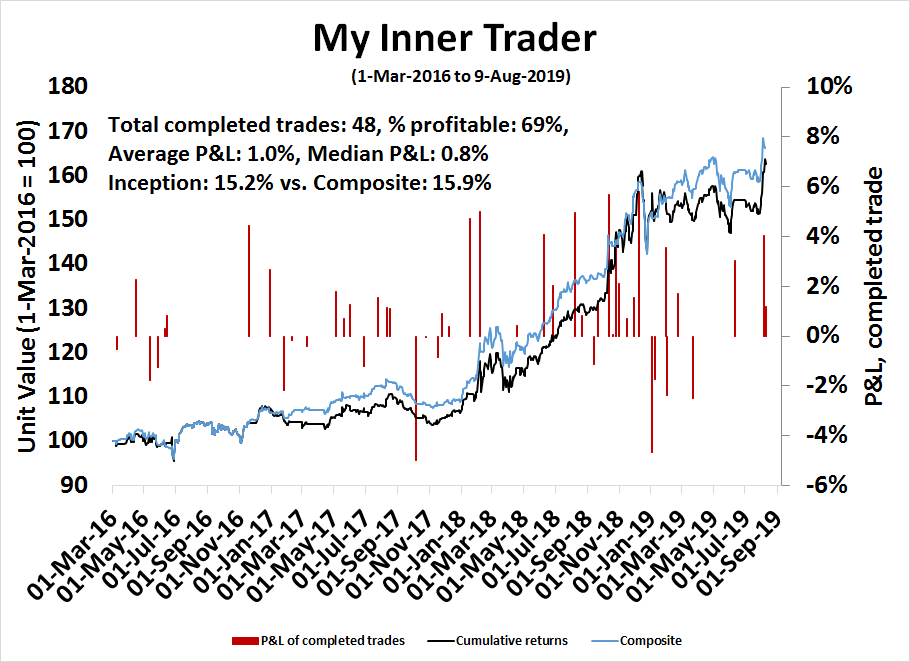
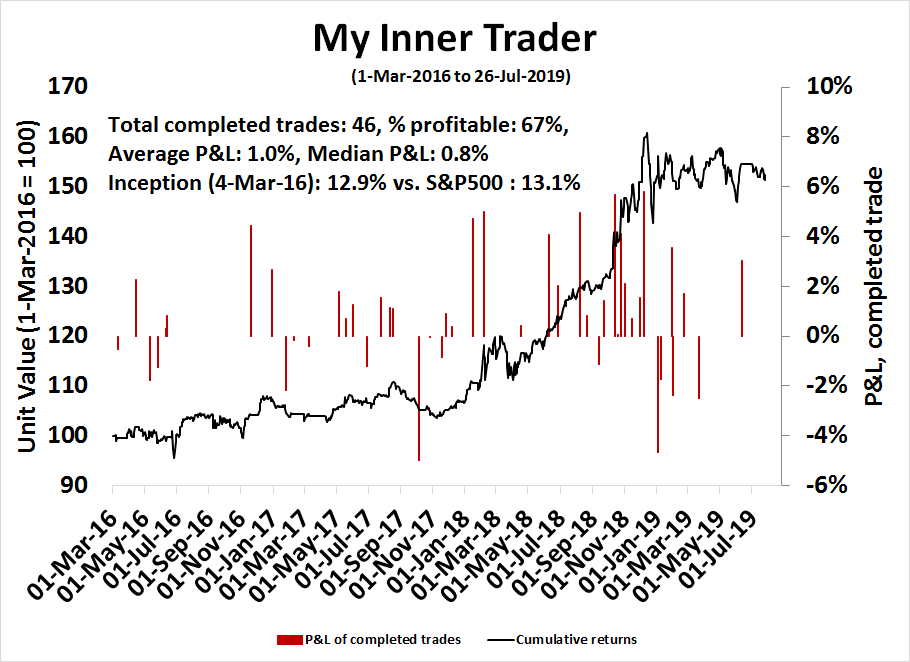
My inner trader uses a trading model, which is a blend of price momentum (is the Trend Model becoming more bullish, or bearish?) and overbought/oversold extremes (don’t buy if the trend is overbought, and vice versa). Subscribers receive real-time alerts of model changes, and a hypothetical trading record of the those email alerts are updated weekly here. The hypothetical trading record of the trading model of the real-time alerts that began in March 2016 is shown below.
The latest signals of each model are as follows:
- Ultimate market timing model: Buy equities
- Trend Model signal: Neutral
- Trading model: Bearish
Update schedule: I generally update model readings on my site on weekends and tweet mid-week observations at @humblestudent. Subscribers receive real-time alerts of trading model changes, and a hypothetical trading record of the those email alerts is shown here.
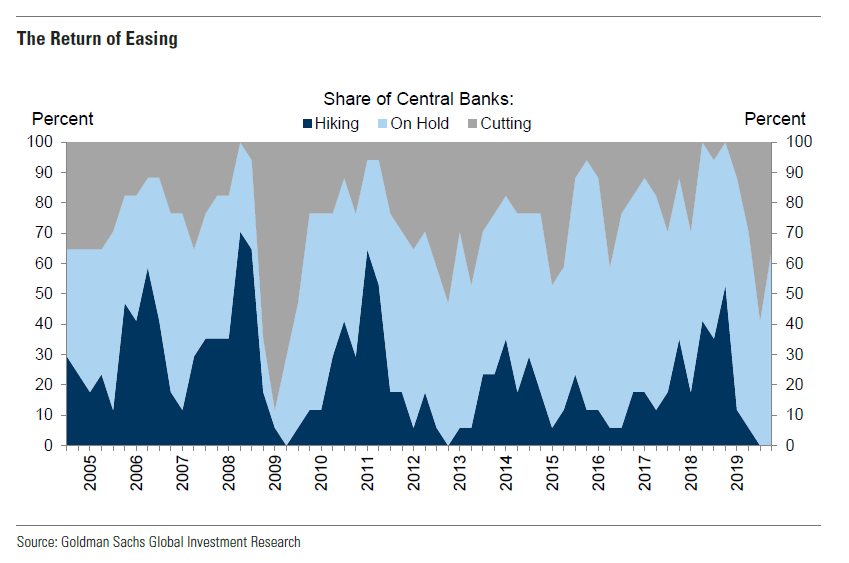
Sleepwalking into a currency war?
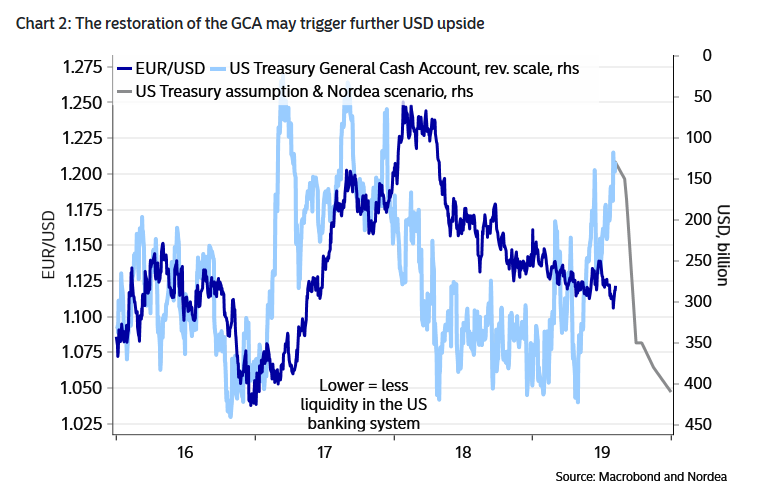
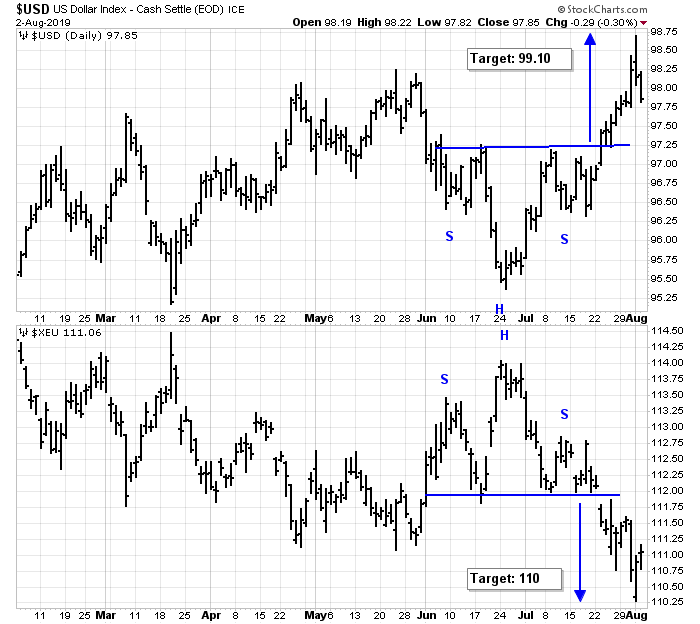
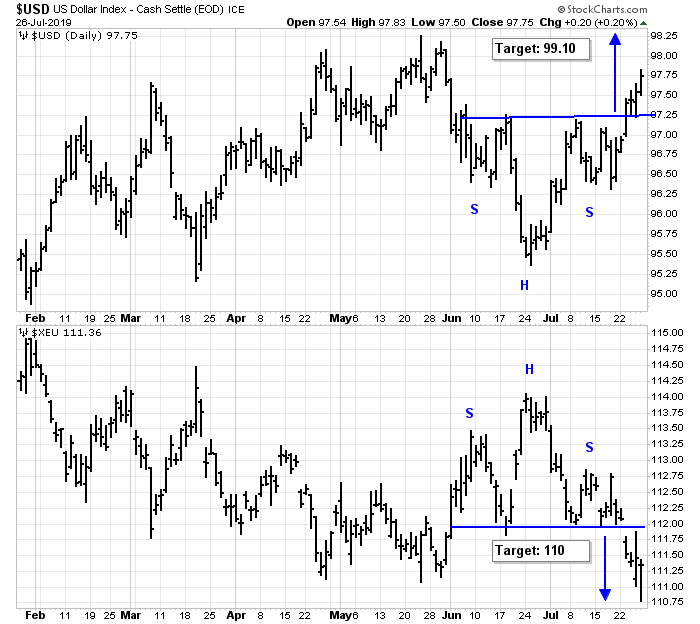
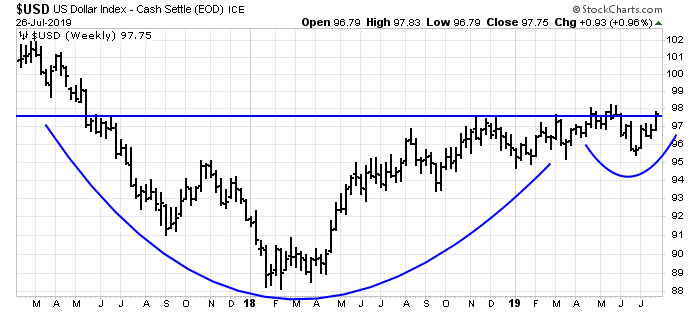
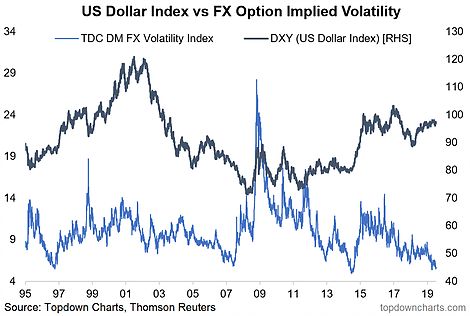
As we look ahead to the FOMC meeting next week, it may be the start of a synchronized global easing cycle. The ECB signaled a dovish tone last week at its meeting. The EURUSD exchange rate weakened, and the USD Index strengthened. From a technical perspective, the USD is exhibiting bullish patterns on multiple time frames. The index staged an upside breakout on an inverse head and shoulders formation on the daily chart, with an upside measured upside target of about 99.10. Conversely, EURUSD has broken down in a head and shoulders, with a downside target of about 110.
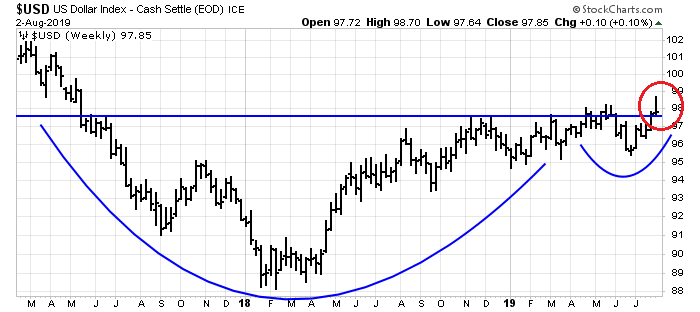
It is also forming a possible bullish cup and handle pattern on the weekly chart, with an upside target of 107.70 to 108.00 on a breakout.
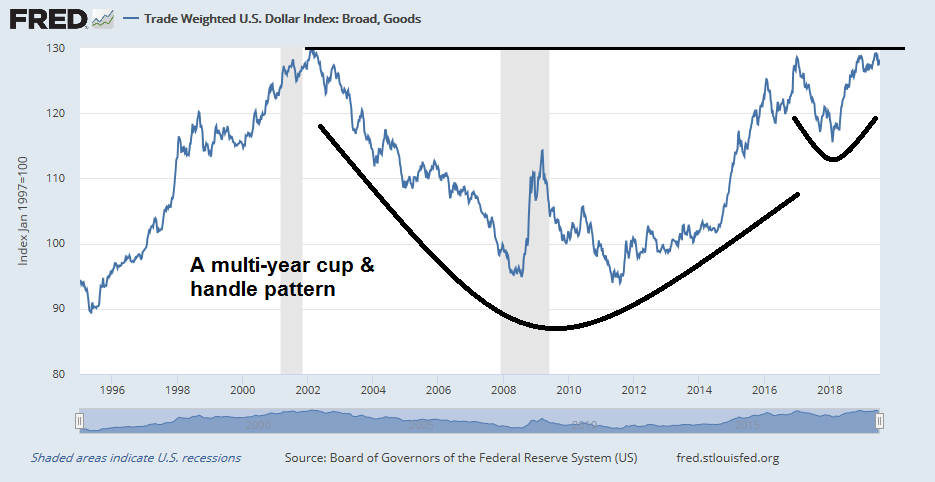
In addition, the trade weighted USD has also formed a possible cup and handle pattern that stretches back to 2002, with bullish implications.
The global nature of the seemingly coordinated central bank easing begs the question of whether monetary policy is inadvertently starting a cycle of competitive devaluation. Is this how a currency war starts?
We examine this thesis from the viewpoints of the three main currency and trading blocs, Europe, China, and the US.
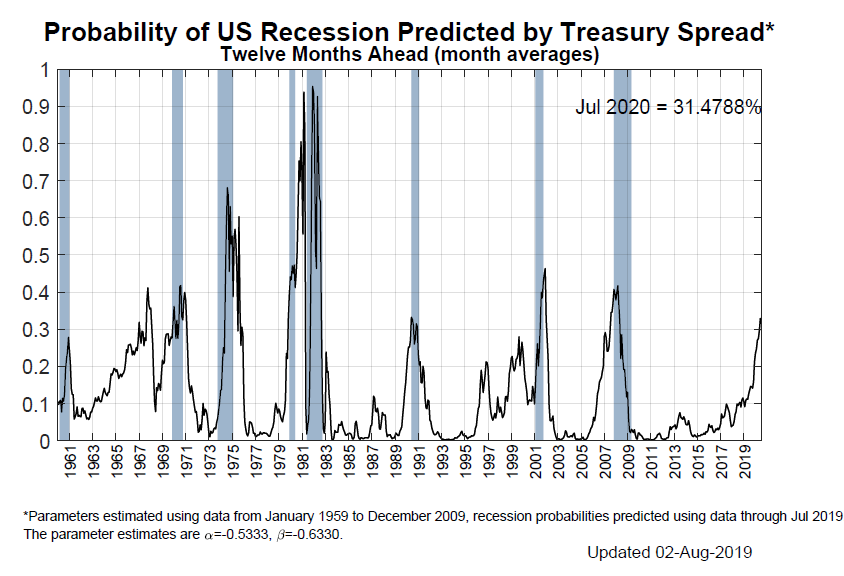
From a long-term US equity investor’s viewpoint, bear markets are accompanied by recessions. Of the major global economies, the US is the least likely to fall into recession, which is positive.
However, the risk of a round of central bank easing interpreted as currency war, which leads to greater protectionism is rising. This may create some bumpiness in equity returns, but the longer term outlook is positive. Even if other economies slow into stagnation or recession, central bankers are on alert and stand ready to provide sufficient liquidity to limit contagion effects.
Europe: Desperate for stimulus
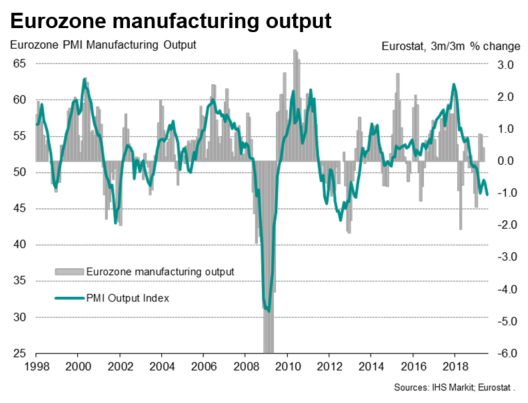
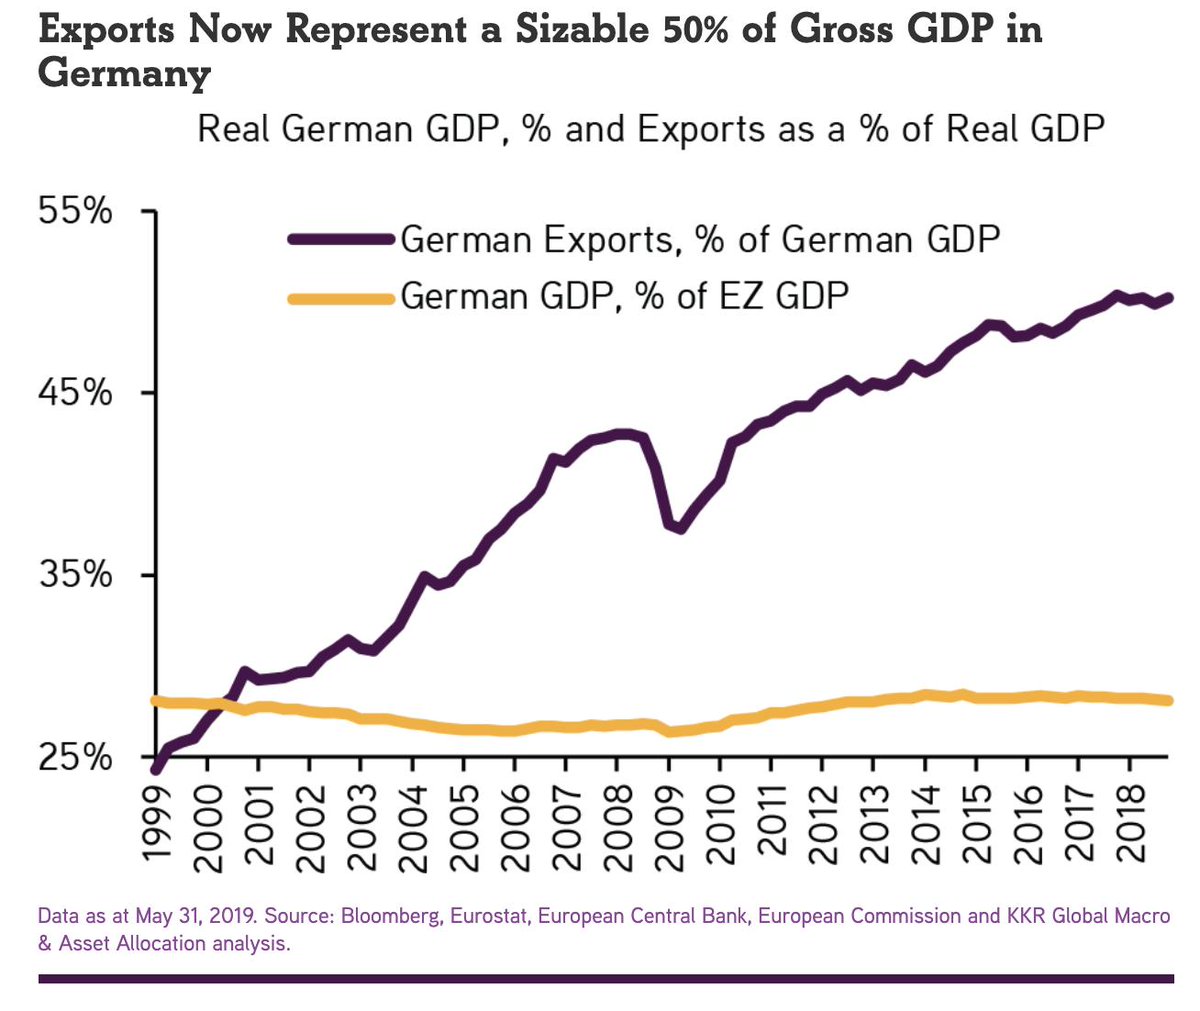
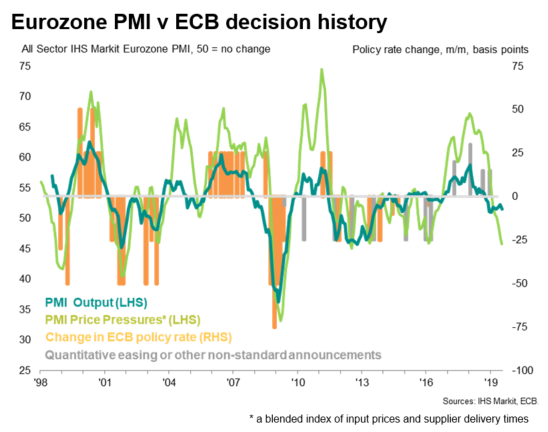
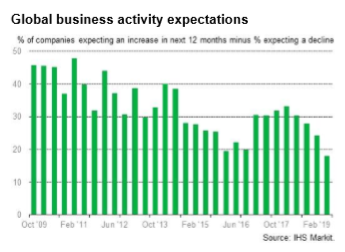
The case for stimulus for the eurozone economy is unequivocal. The latest PMI readings show a stalling manufacturing sector.
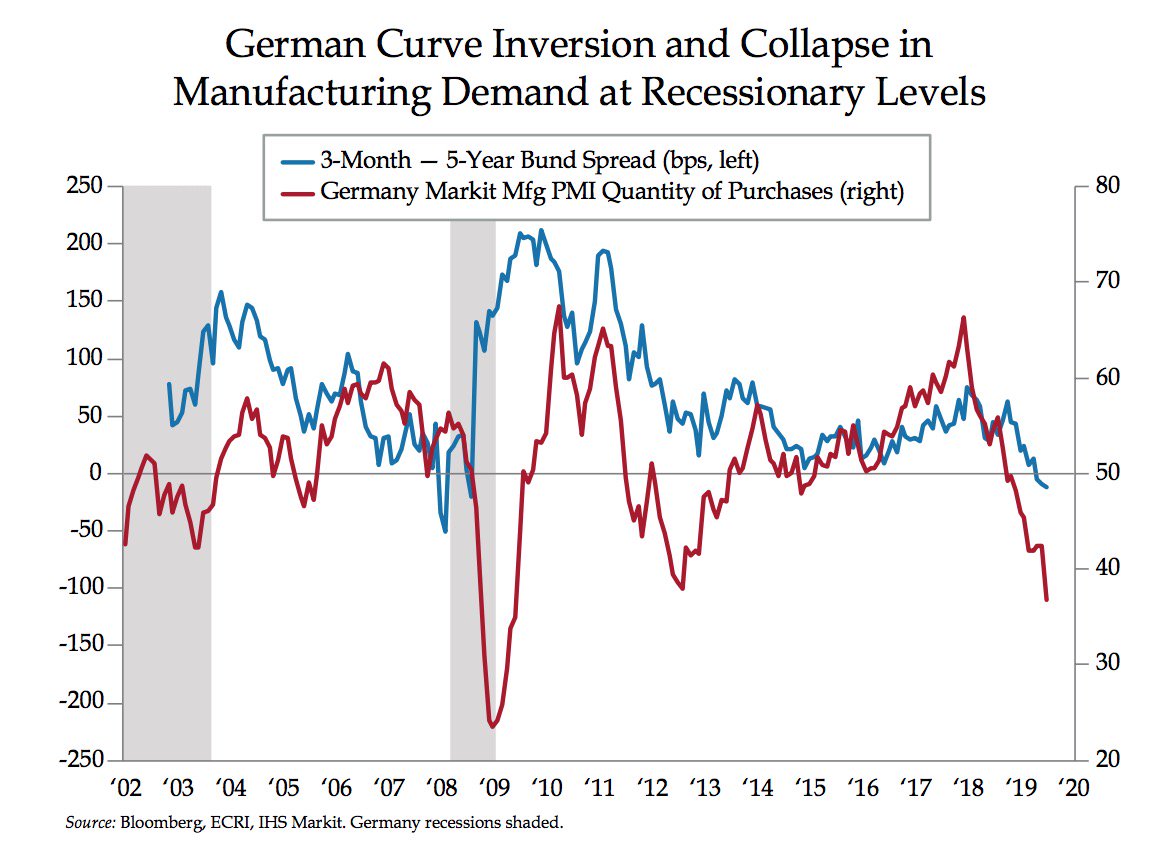
In particular, German manufacturing, which has been the locomotive of growth in the eurozone, has collapsed, and the 3-month to 5-year Bund yield curve has inverted for the first time since the GFC, signaling a possible recession.
The weakness in German manufacturing is important because about 50% of its GDP is exports.
The only silver lining in the PMI data is the strength of the services sector, which is holding up Composite PMI. However, the combination of soft inflation and manufacturing argues for stimulus.
The ECB faces a dilemma. Its stimulus efforts since the GFC has pushed bond yields into negative territory. The entire Swiss yield curve is negative, and the German and Danish yield curves are negative out to 20 years. Even the Greeks can borrow for 10 years at a yield less than the US Treasury. The limits to monetary policy is becoming clear.
A recent BIS working paper by Kristin Forbes lays out the limits to the current inflation fighting monetary framework used by most central bankers. Here is the abstract.
The relationship central to most inflation models, between slack and inflation, seems to have weakened. Do we need a new framework? This paper uses three very different approaches – principal components, a Phillips curve model, and trend-cycle decomposition – to show that inflation models should more explicitly and comprehensively control for changes in the global economy and allow for key parameters to adjust over time. Global factors, such as global commodity prices, global slack, exchange rates, and producer price competition can all significantly affect inflation, even after controlling for the standard domestic variables. The role of these global factors has changed over the last decade, especially the relationship between global slack, commodity prices, and producer price dispersion with CPI inflation and the cyclical component of inflation. The role of different global and domestic factors varies across countries, but as the world has become more integrated through trade and supply chains, global factors should no longer play an ancillary role in models of inflation dynamics.
Translation: In times of globalization, there are many other drivers of inflation than the factors outlined by Milton Friedman. Inflation is no longer just a monetary phenomena. Factors such “exchange rates, oil prices, other commodity prices, slack in major economies (not just at home) and international pricing competition” also affect inflation. Friedman believed that floating exchange rates would ensure external balance and insulate the economy from the outside world, putting monetary policy in full control. The actual evidence during the latest era of globalization contradicts those assertions.
The BIS paper is one sign of a paradigm change in central banking. There are limits to central bank papers, especially at the zero lower bound (ZLB). It is time for fiscal policy to pick up the slack.
In practice, however, the German resistance to fiscal stimulus is problematical, even when it is becoming evident that Germany is falling into recession. The changing of the guard from Draghi to Legarde is a positive step, as Christine Legarde is a politician who is more adept at navigating the political sensitives of member states and prod them into adopting fiscal stimulus than an economist like Draghi. However, any transition takes time, and Europe will find itself handicapped over the next 12-18 months as monetary policy will be the only stimulus tool available.
In the meantime, the ECB has no choice but to use the same old tools of lower rates and QE to stimulate, but it is increasingly pushing on a string, and in effect devaluing the euro as a result.
China: Stimulus or devaluation?
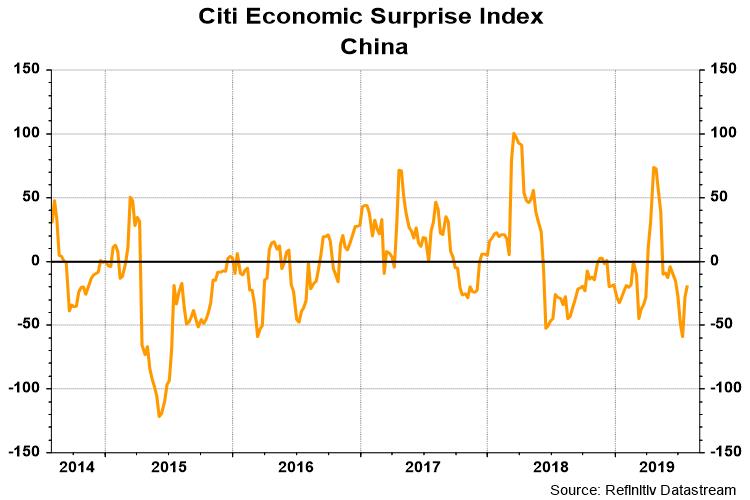
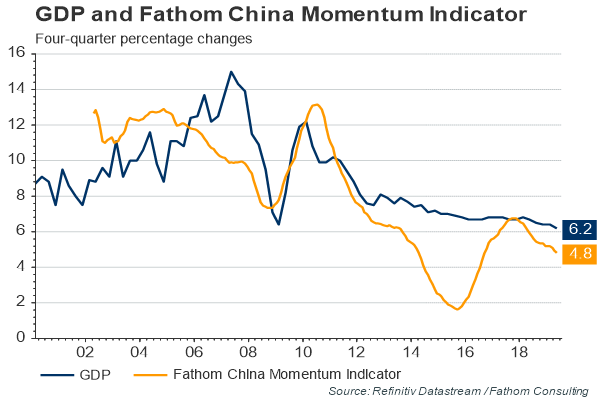
As we turn out signs to China, there are numerous signs the Chinese economy is slowing.
While we are always wary of the accuracy of official Chinese statistics, economic indicators from Asian trading partners are pointing to a slowdown. Japanese machine tool exports are down a whopping 38% year-over-year.
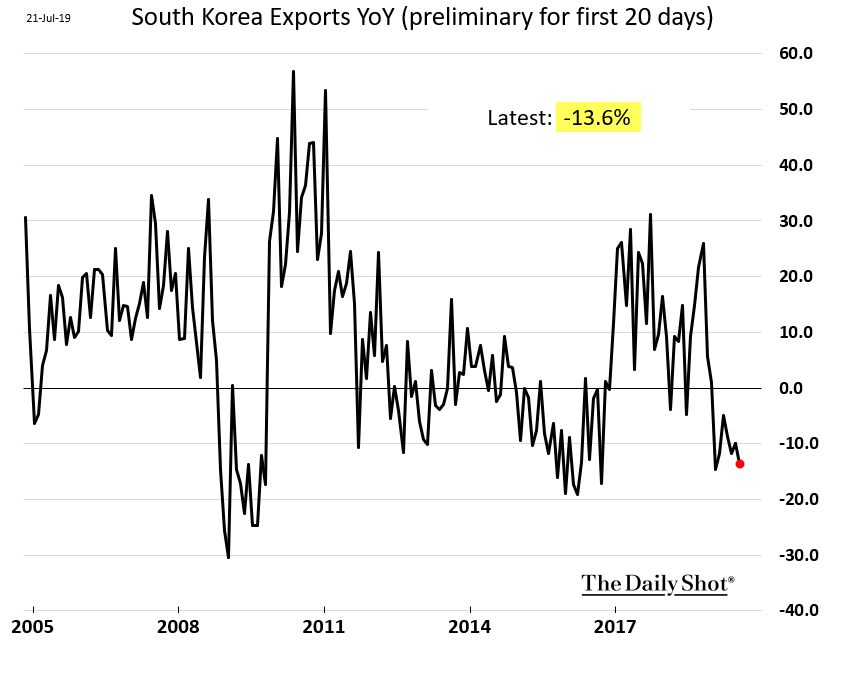
Korean exports, which is a sensitive barometer of global and Chinese growth, has fallen rapidly.
Normally, the authorities would respond with more stimulus as growth slows, especially ahead of the 70th anniversary celebration of the founding of the People’s Republic of China in October. What is puzzling is the lack of stimulus, and growing signs of financial distress.
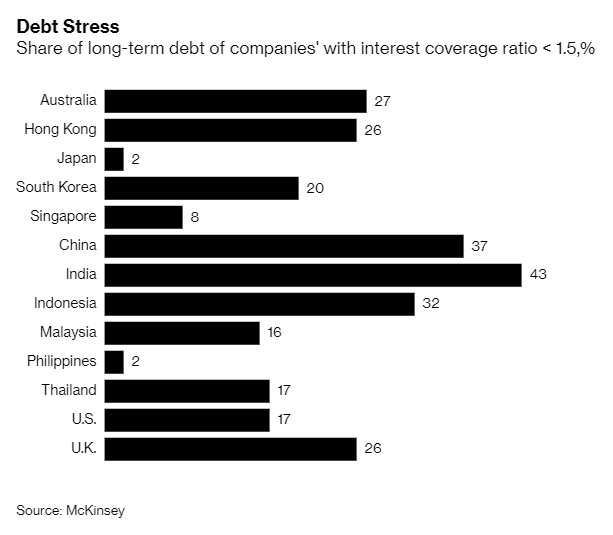
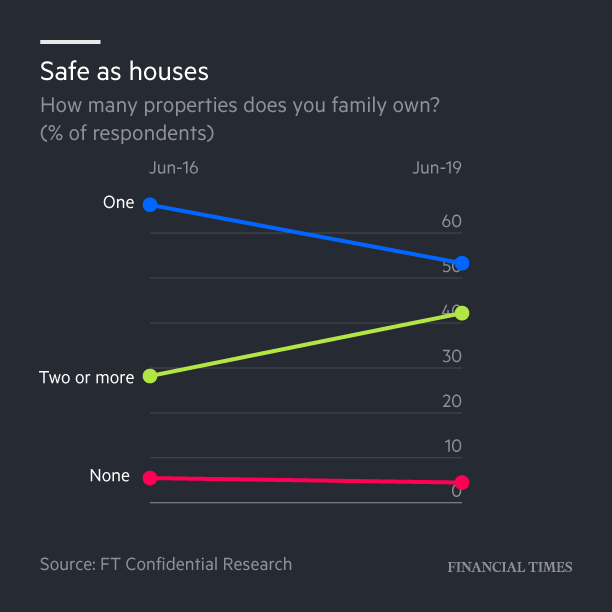
Real estate is the most cyclically sensitive sector in China in light of its high leverage and the propensity of Chinese to put their savings into property. Yuan Talks reported that 271 property developers went bankrupt in 2019, and 34 developers in July alone. Bloomberg also reported that liquidity conditions are tightening, and these measures are hitting the real estate sector hard:
[L]iquidity is tightening again. Buoyed by what Beijing had perceived as progress in trade talks with the U.S., officials in April started turning back to President Xi Jinping’s campaign to wring excess borrowing from the financial system.
Just look at the Politburo’s language from its latest quarterly meeting. In a Communist Party statement, key phrases such as “deleveraging” started to reappear, as well as Xi’s exhortation that “apartments are for living in, not for speculation.” That’s quite a turnaround from October, when officials removed all references to corporate debt or property curbs as the trade war escalated.
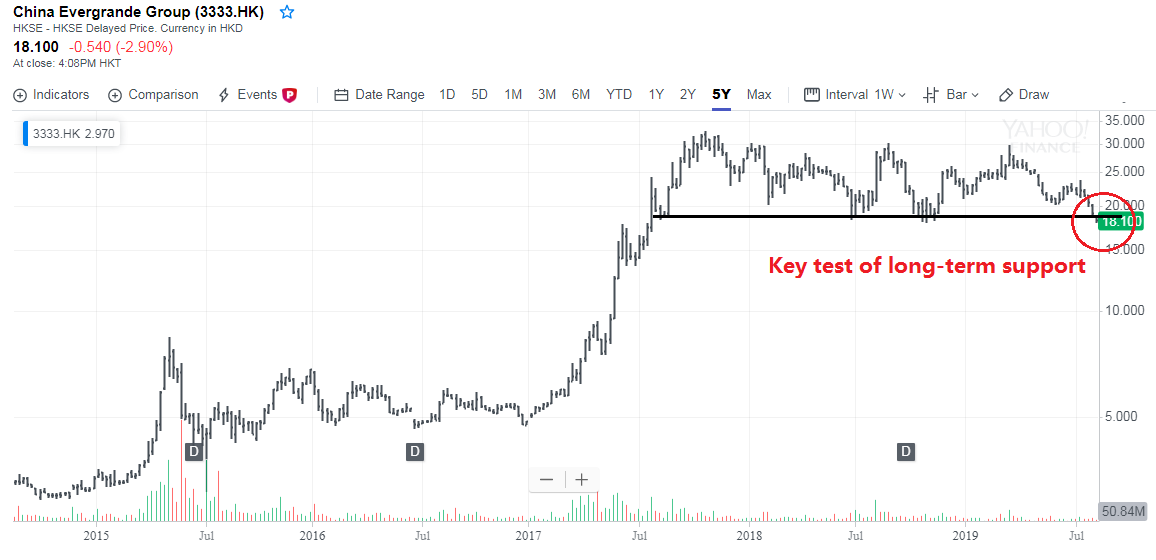
As Bloomberg Intelligence analysts Kristy Hung and Patrick Wong meticulously chronicled, property deleveraging is also back in full swing, with regulators choking off all funding channels. China Evergrande Group, the most avid offshore issuer, postponed dividend payouts last week to preserve cash. Issuing dollar bonds had become an important channel for developers, accounting for roughly a quarter of non-bank financing last year.
Funding is getting tight for other junk-rated developers, too. In July, Tahoe Group Co. issued a three-year bond with a 15% coupon, doubling the interest payment it offered as recently as January 2018.
To make matters worse, low-quality borrowers in the offshore market are finding that few investors want to lend over longer horizons, which has triggered a surge of issuance in short-dated bonds. Last year, 78% of new issues had maturities of one to three years, up from less than half in 2017. This will only make default scares more common: After all, honoring interest payments is a lot easier than paying off principal, or rolling over debt.
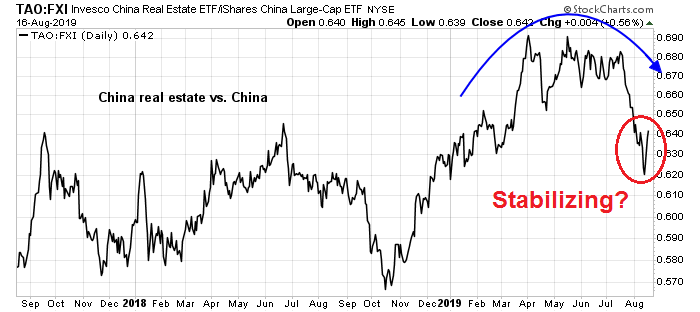
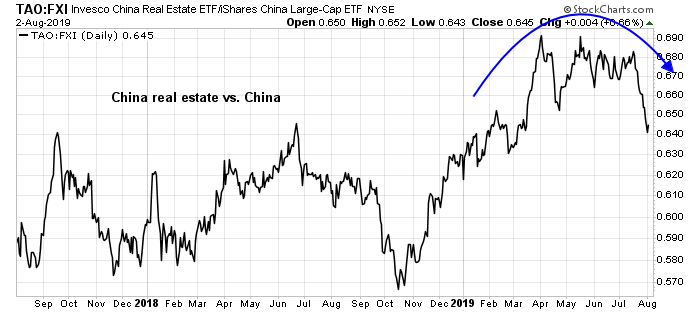
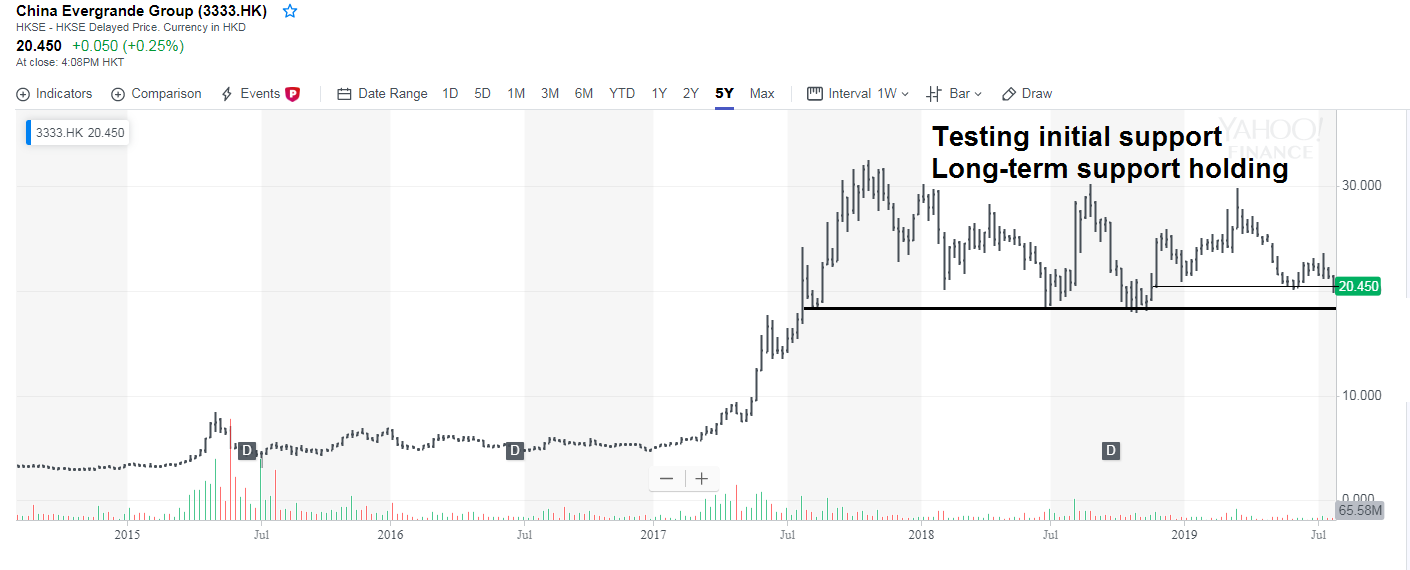
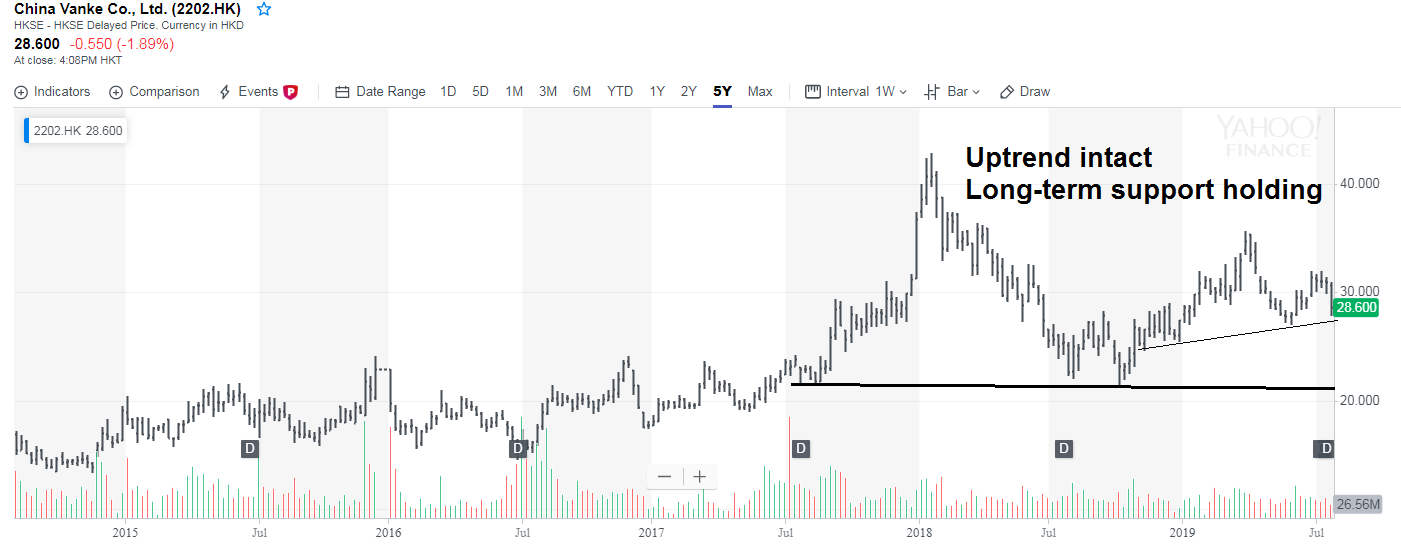
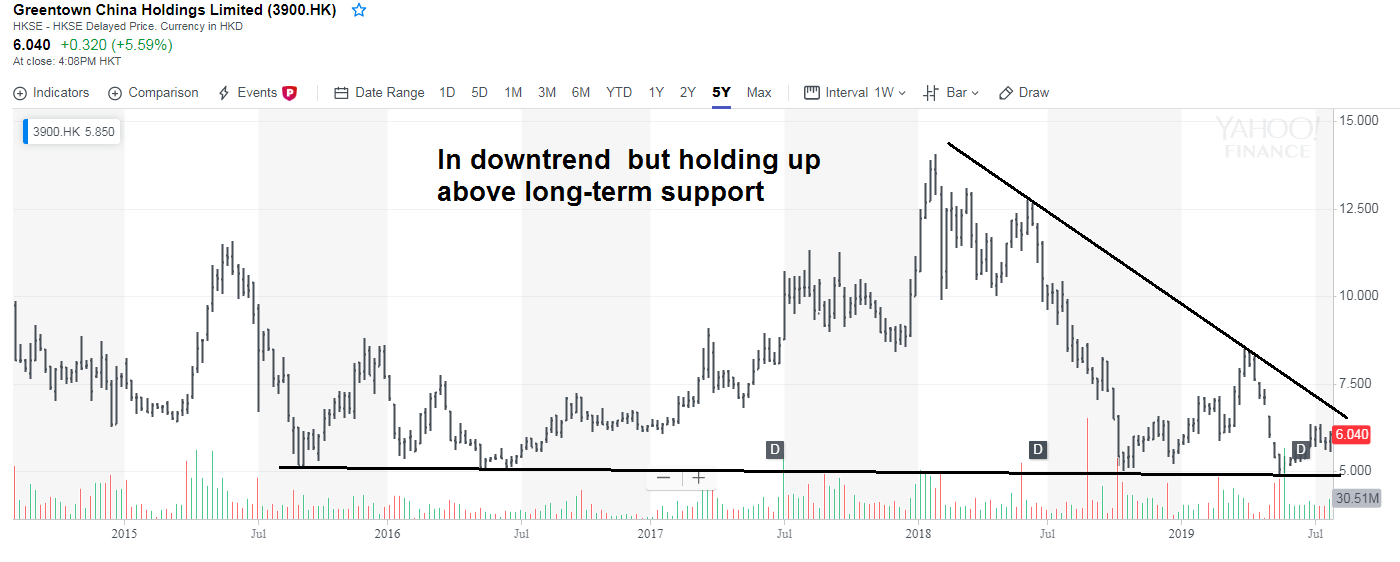
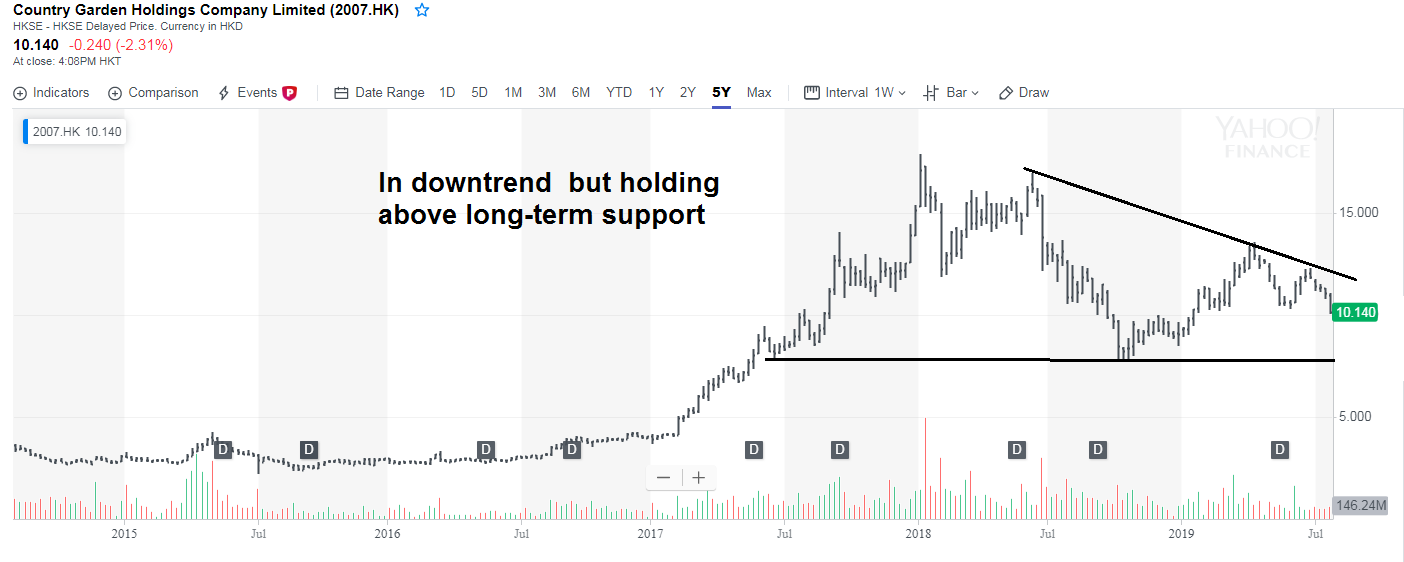
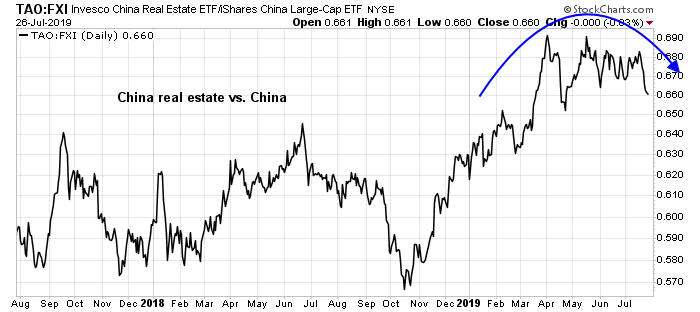
Our own real-time indicator of monetary stimulus is stalling. The relative performance of Chinese real estate stocks is starting to roll over, after benefiting from a stimulus program that began in Q4 2018.
While conditions are not at alarming levels, and the shares of bellwethers like China Evergrande (3333.HK) remain well above long-term support, it is something that investors should keep an eye on.
Reuters reported that the Bank of Jizhou, which is based in Liaoning, is encountering liquidity problems. Regulators are meeting to address the problem. This is another sign of cracks in the Chinese financial system that could be worrisome.
Houze Song at Macro Polo recently offered an explanation for the lack of stimulus. Song believes that the Q2 slowdown has a lot to do with tapering of fiscal stimulus, and expects it to rebound in Q3. He believes “a strong stimulus is unlikely, partly because the trade war requires Beijing to conserve stimulus ammunition for future contingencies.”
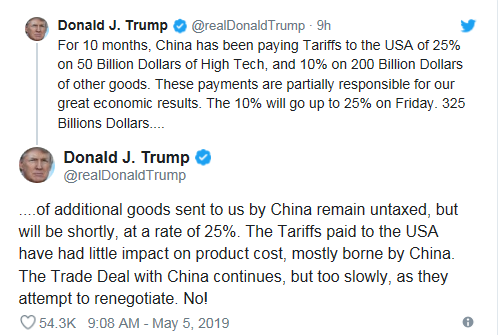
In the meantime, trade war talks are stalled. The Washington Post recently reported that Huawei had been working China’s state-owned Panda International Information Technology to build out North Korea’s mobile phone networks for at least eight years until 2016. This will do little to ease trade tensions.
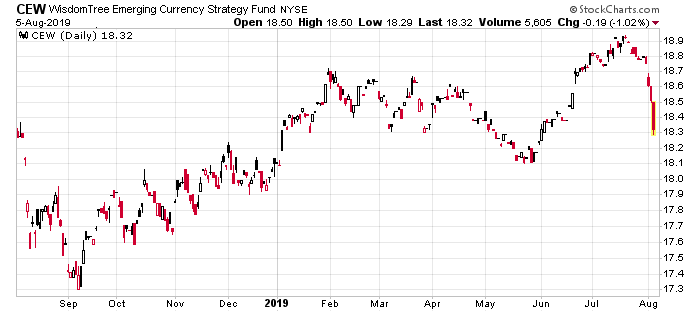
These developments are laying the foundation for a currency war. China’s slowdown and easing that began in Q4 led to greater domestic consumption and production, but fewer imports. Falling import demand hurt countries that heavily depend on Chinese demand, such as Korea and Germany. The ECB responded by easing policy, but the eurozone’s hands are currently tied by German intransigence against fiscal stimulus. ECB easing puts downward pressure on the euro, and creates headwinds for Chinese exports. In addition, the US-China trade war is not helping matters as companies relocate their supply chains out of China. Asian economies have no choice but to ease as well, and we have seen rate cuts from Korea and Indonesia.
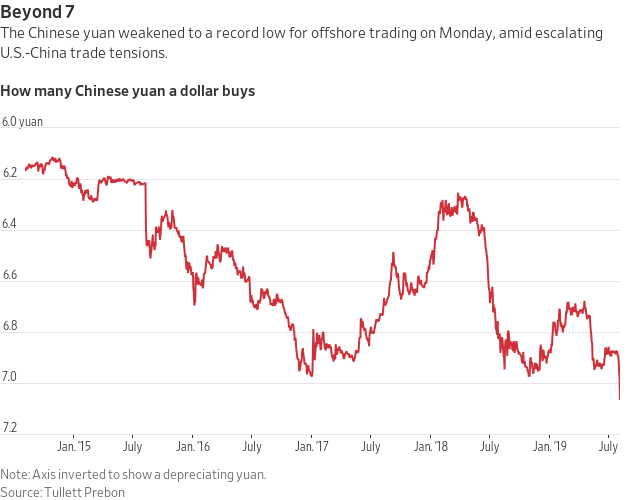
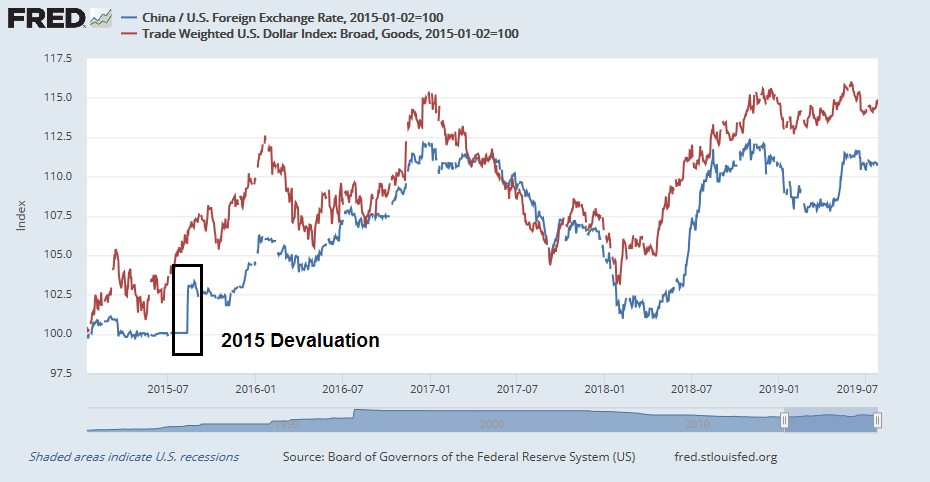
The stage for competitive devaluation is set. Recall that last time the ECB and BOJ eased strongly, CNYUSD appreciated and the PBOC corrected that by devaluing the yuan and moving to a currency basket as a benchmark. In this environment, the risk is China may be forced to devalue the yuan in a sudden and disorderly manner, which creates more trade tensions and heightens the chances of more competitive devaluations.
America: The last island of growth
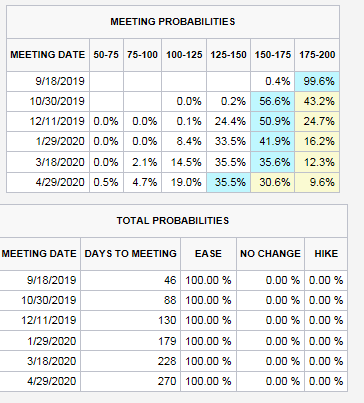
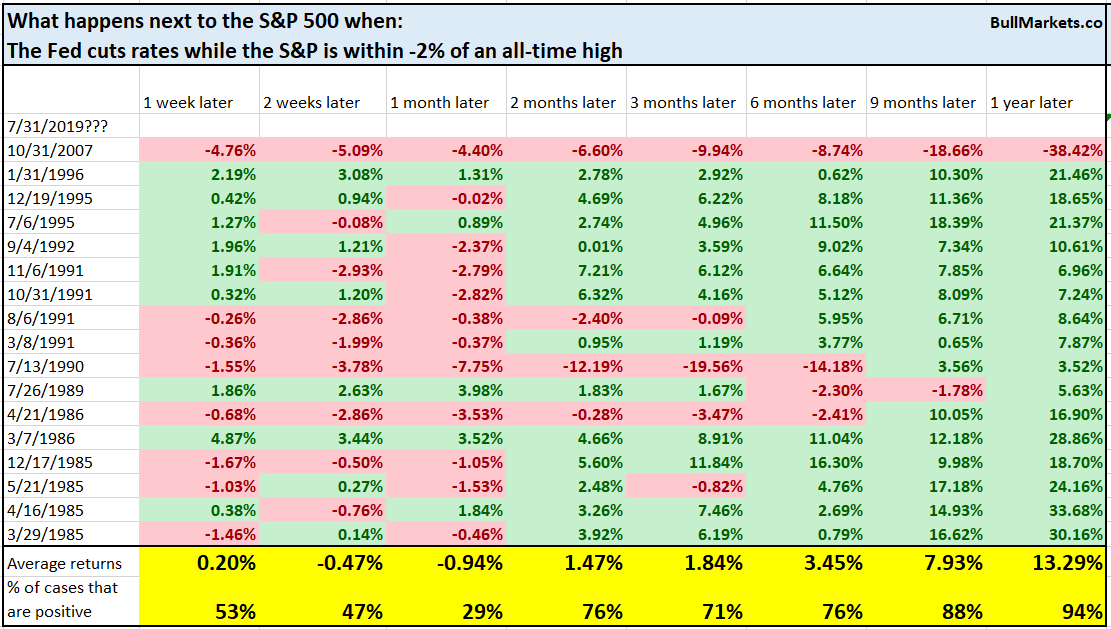
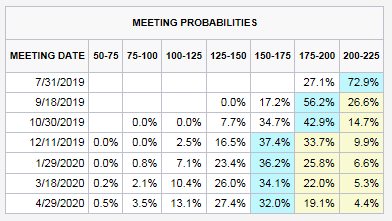
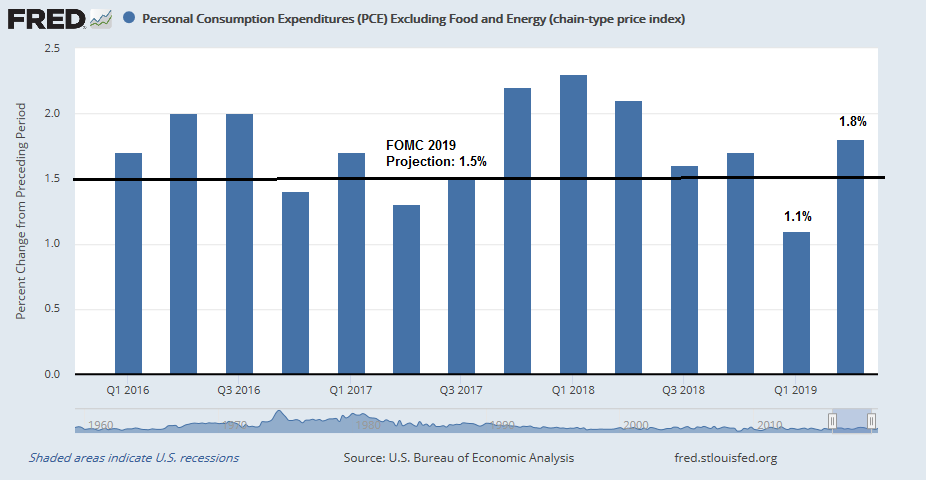
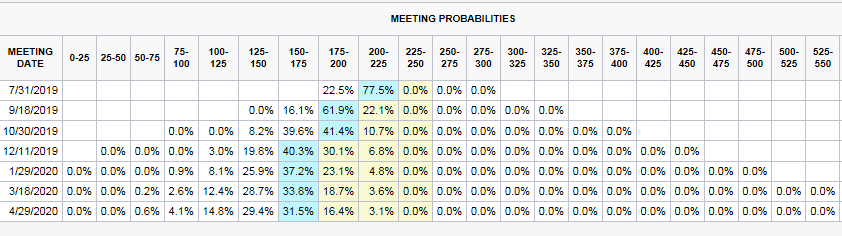
This brings us to the Fed and its decision at the July FOMC meeting. It has signaled that it plans to ease by a quarter-point, and Fed officials walked back expectations that it would ease by a half-point. Will that be enough, and what does that mean for exchange rates?
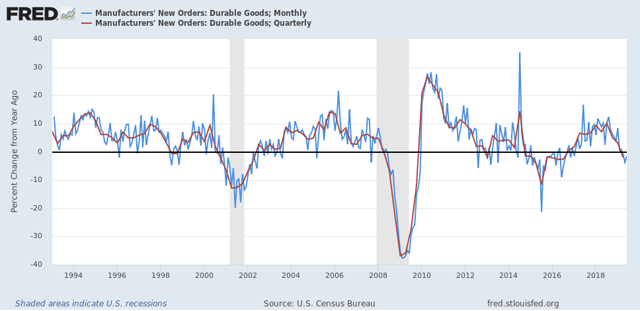
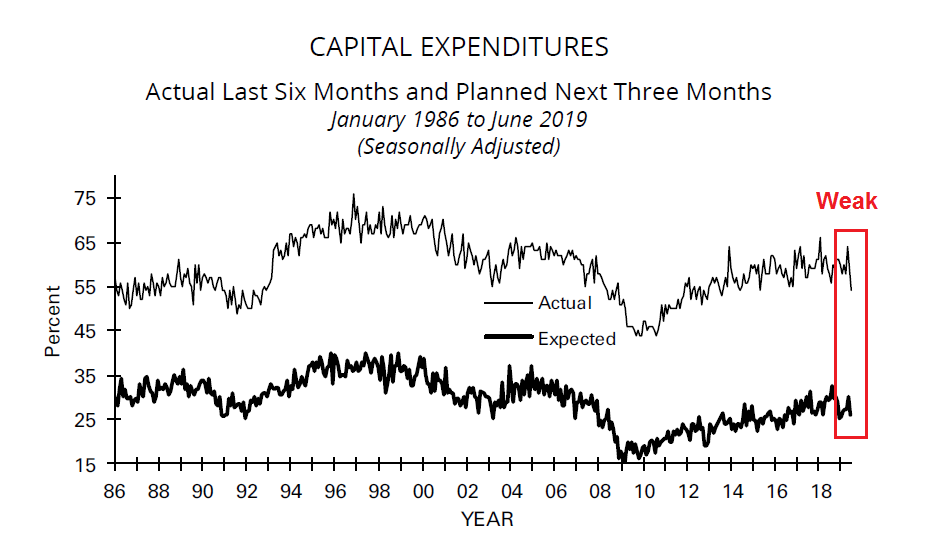
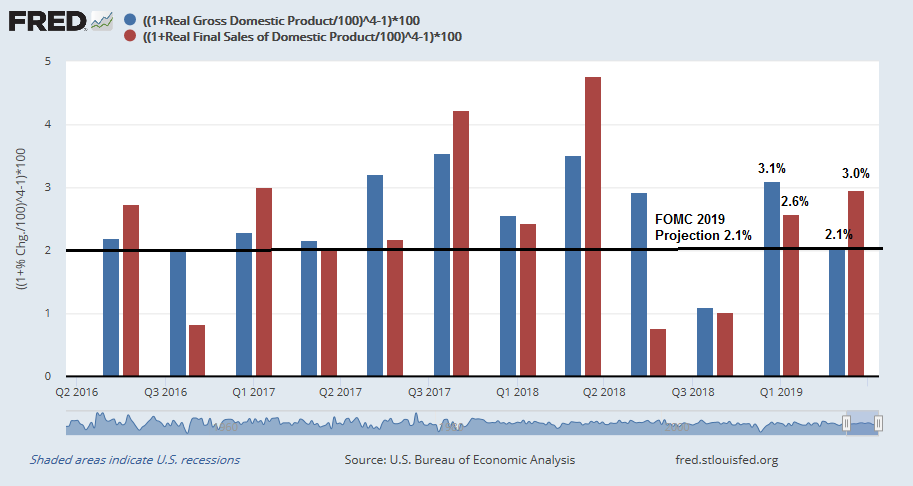
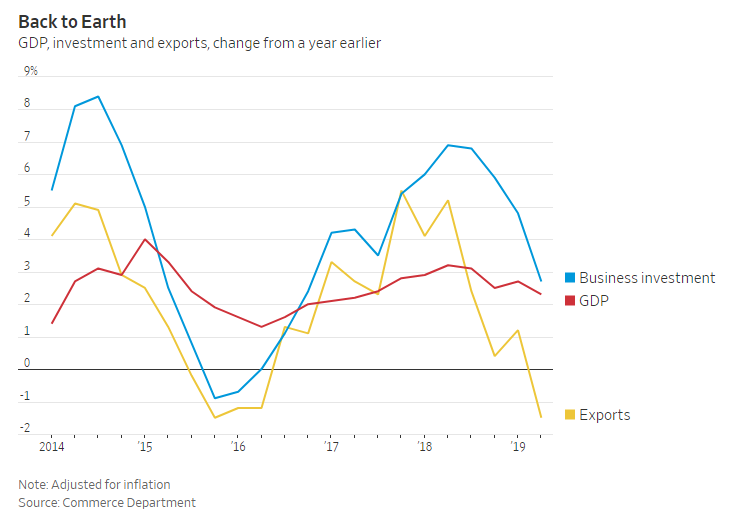
Unlike Europe, or China, the Fed’s case for monetary easing is no equivocal, and it is advertised as an “insurance cut”. To be sure, business investment is slowing because of the uncertainties from the trade war. While the American economy is slowing, it does not appear to be going into recession, as shown by the better than expected Q2 GDP growth of 2.1%.
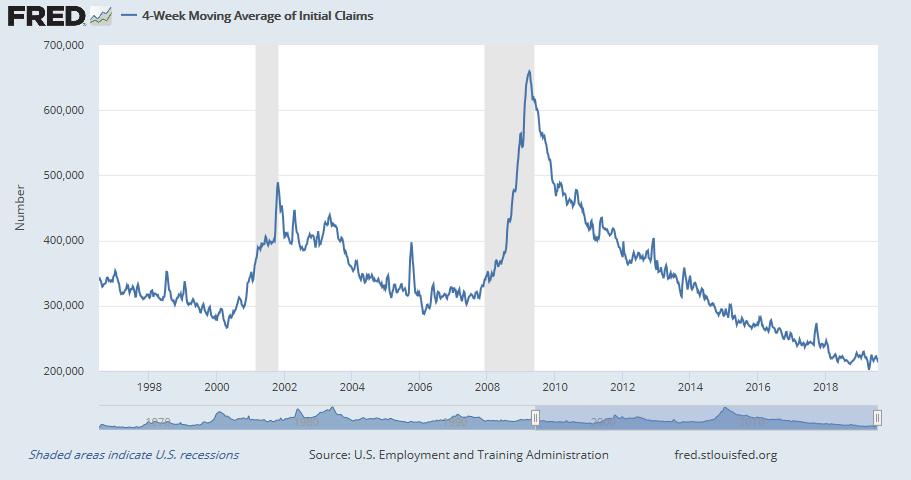
The jobs market looks strong. Initial jobless claims are troughing, but show no signs of turning up, which would indicate a slowdown.
At the same time, rising small business selling prices are pointing to rising inflationary pressures. Small business have little bargaining power and they are therefore sensitive economic barometers. This will handcuff the Fed willingness to ease policy over the longer run.
New Deal democrat, who has done exemplary work by monitoring high frequency economic data and categorizing them into coincident, short-leading, and long-leading indicators, recently concluded that the economy is likely to stagnate, but it will not go into recession. This makes the American economy the island of global growth, and puts upward pressure on the USD despite the Fed’s expected rate cut.
Investment implications
What does that mean for US equity investors? The global economy is sputtering, and global central bankers are entering an easing cycle, which could spark a currency war. Under such a scenario, US equities are attractive on a relative basis.
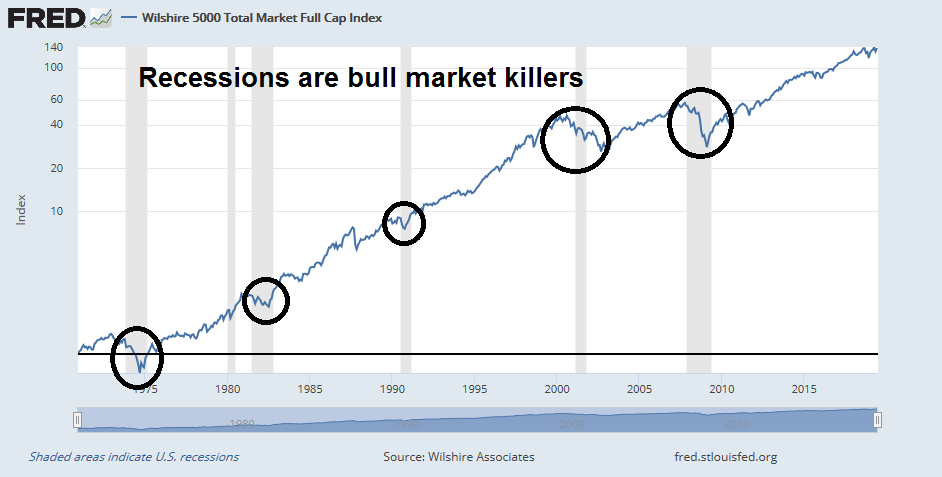
Recessions are bull market killers. Of the major global economies, the US is the least likely to fall into recession, which is positive. Headline Q2 GDP came in at a better than expected 2.1%. More importantly, final sales, which is a better measure of growth after stripping out adjustments, was a strong 3.2%.
The S&P 500 and NASDAQ 100 made fresh highs last week, commodity price inputs are low, the labor market is strong, liquidity is plentiful, and the Fed has made it clear it wants to support further expansion. This is bullish for investors who are not afraid of the normal equity risk 10% drawdowns that occur virtually every calendar year.
However, the risk of a round of central bank easing interpreted as currency war, which leads to greater protectionism is rising. This may create some bumpiness in equity returns, but the longer term outlook is positive. Even if other economies slow into stagnation or recession, central bankers are on alert and stand ready to provide sufficient liquidity to limit contagion effects.
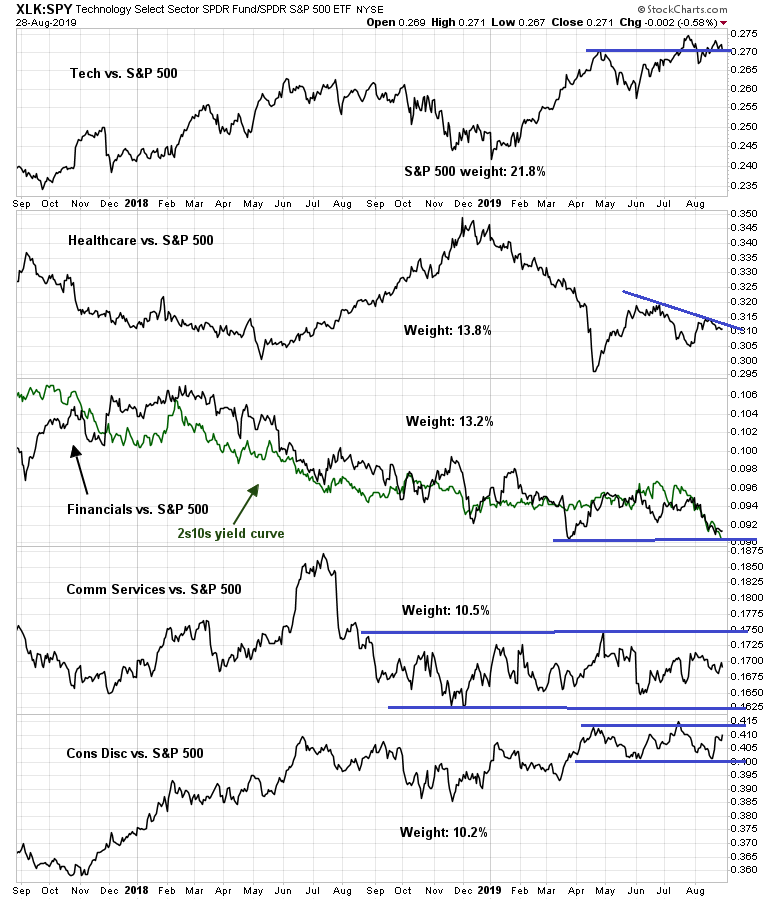
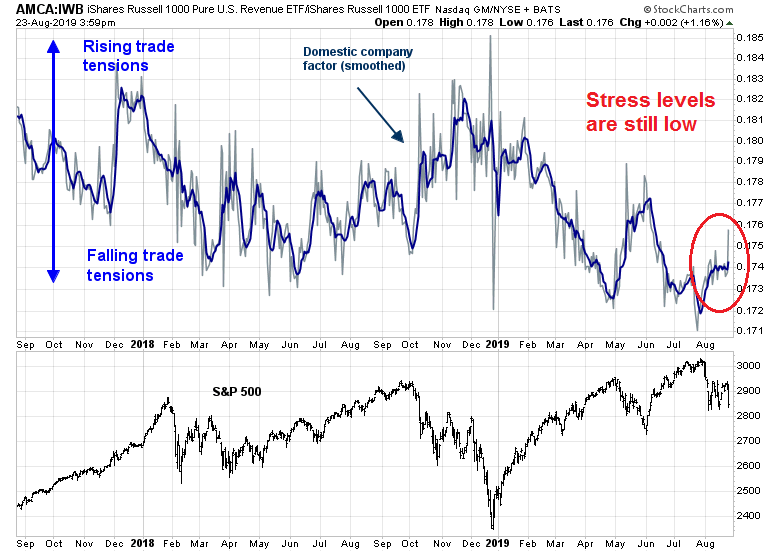
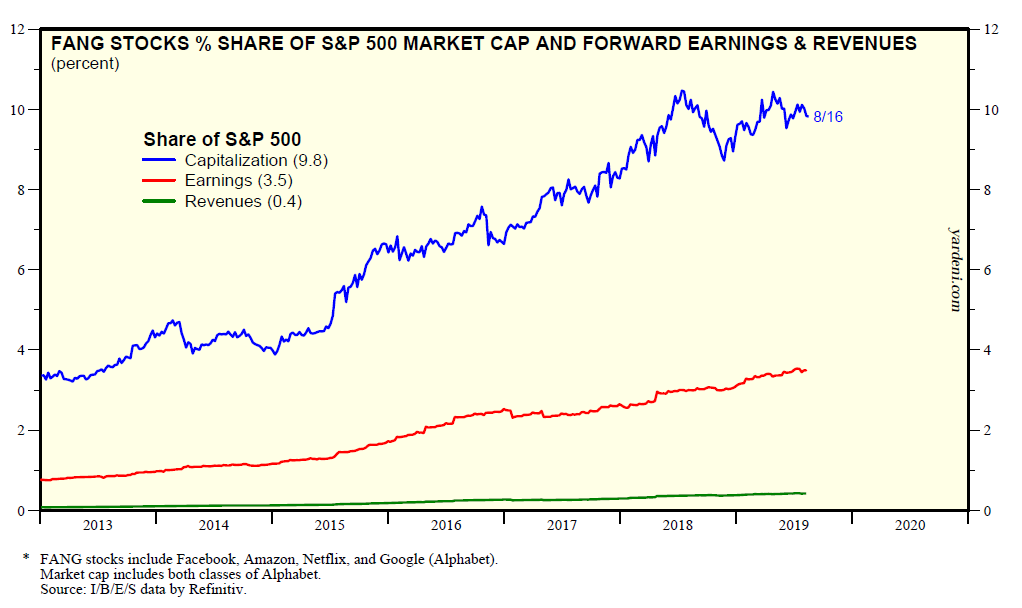
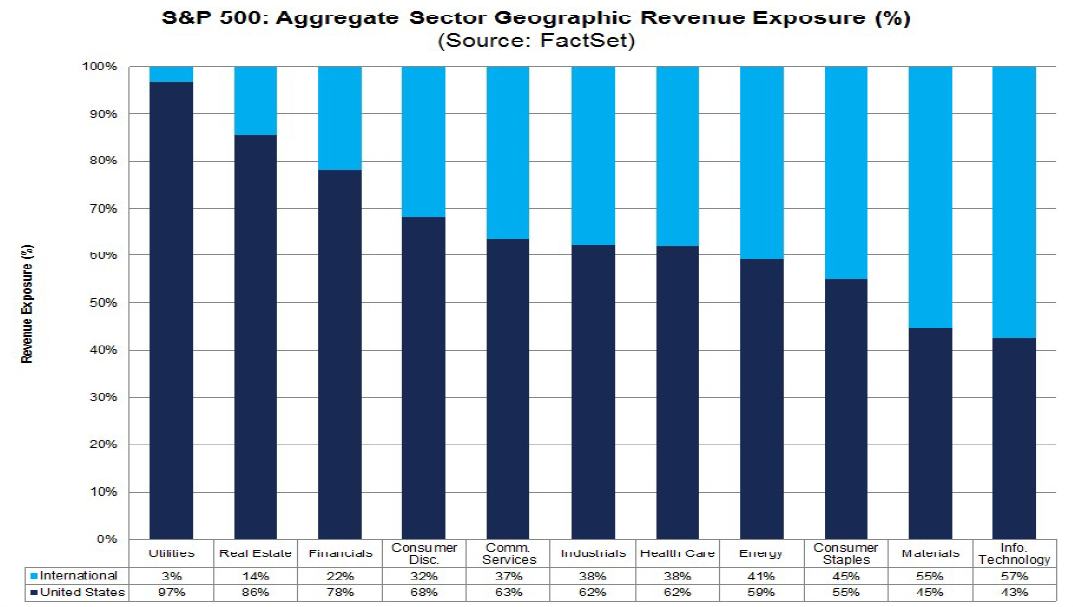
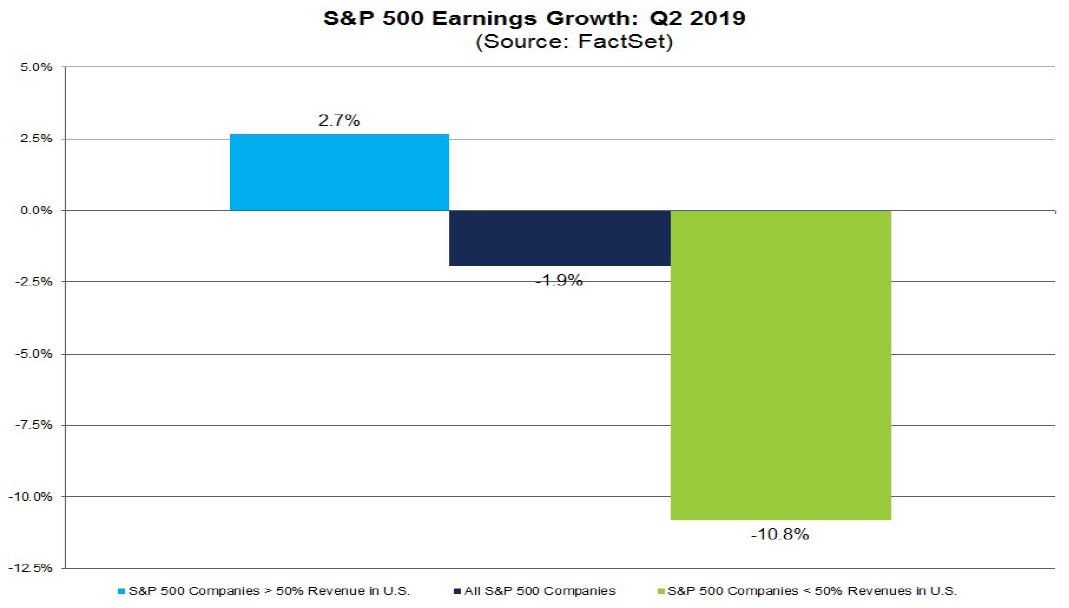
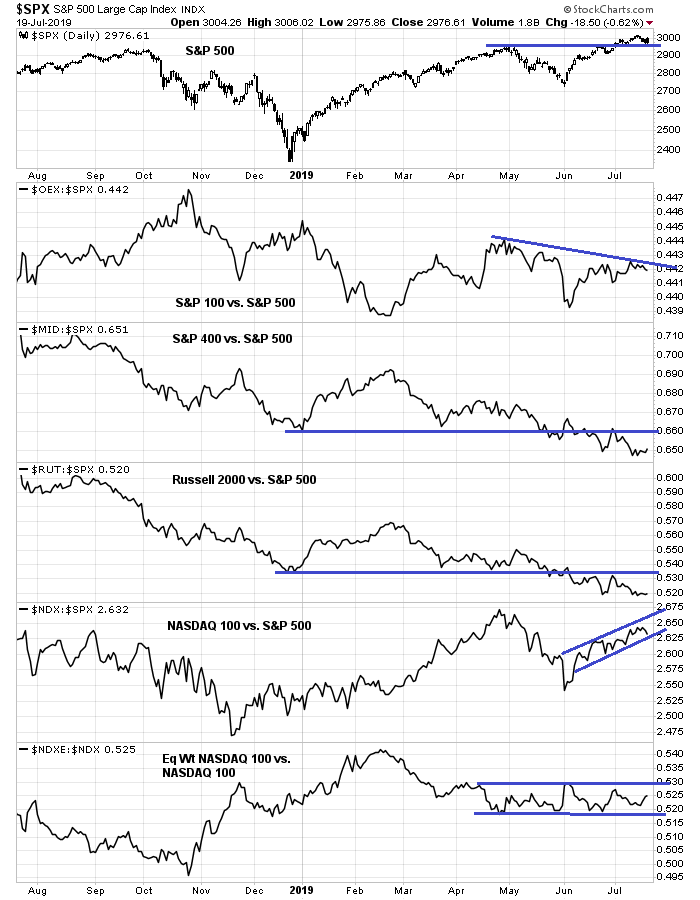
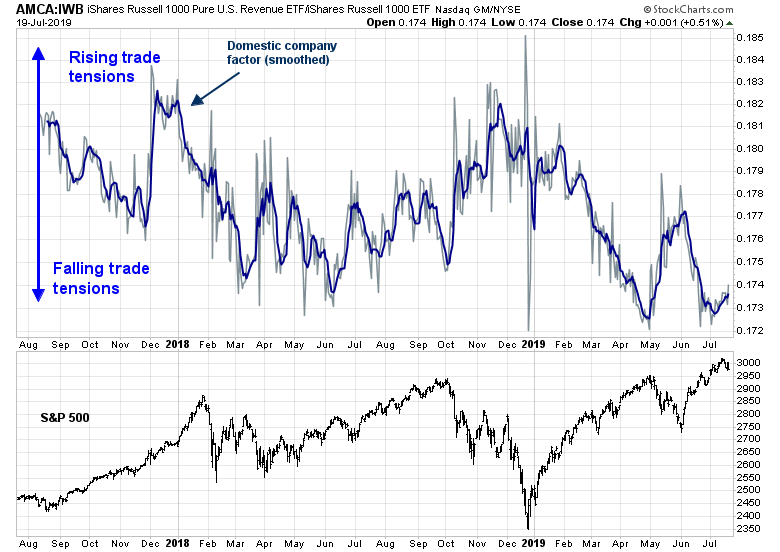
One way of mitigating the de-globalization effect is to tilt towards US equities with greater domestic exposure, by either holding a greater weight in mid and small caps, or underweight sectors with large foreign exposure, like the technology stocks.
The week ahead
Even though I am long-term bullish on US equities, I remain tactically cautious. Last week, I suggested that investors focus on the path of estimate revisions for clues the market outlook during Q2 earnings season (see Will stock prices surge on a Fed rate cut?).
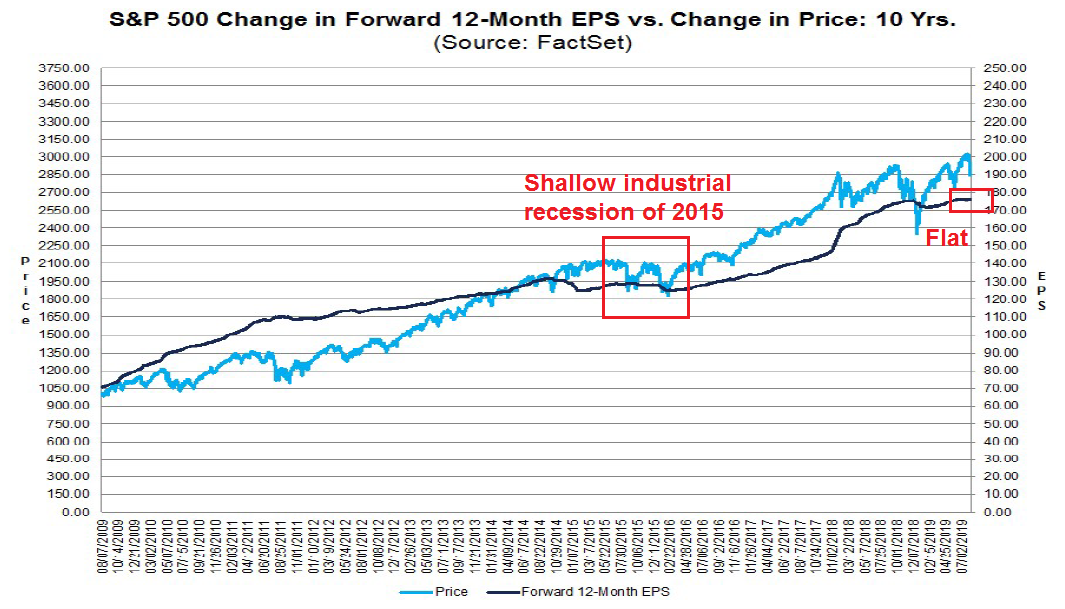
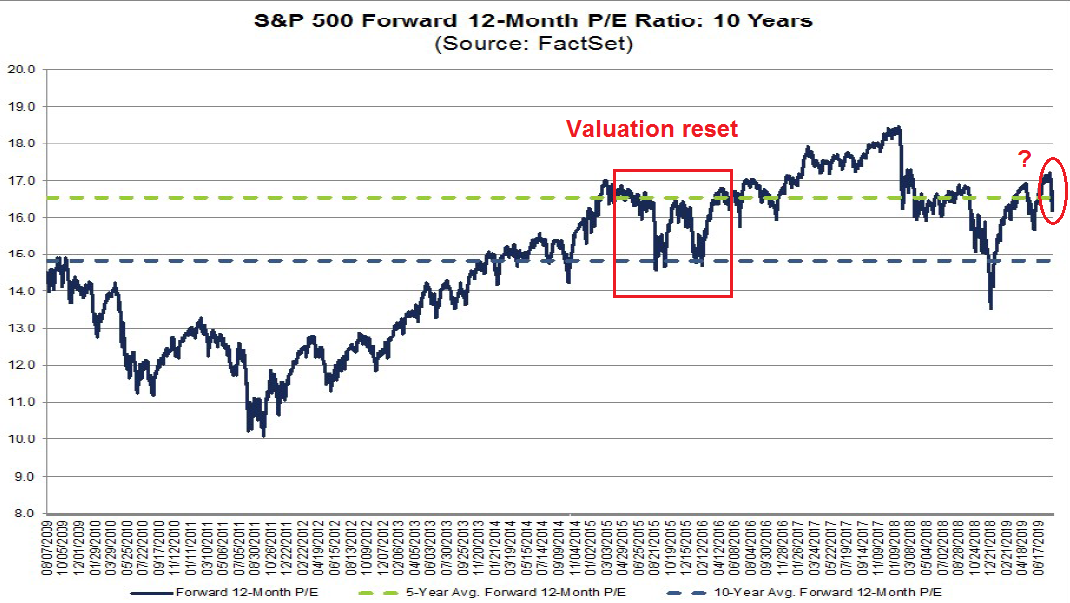
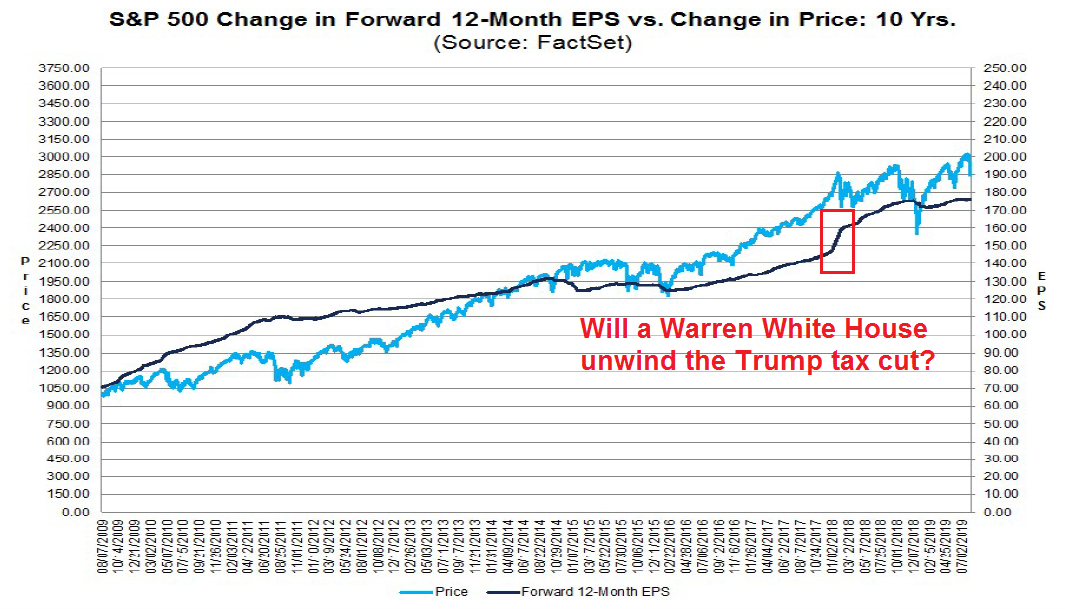
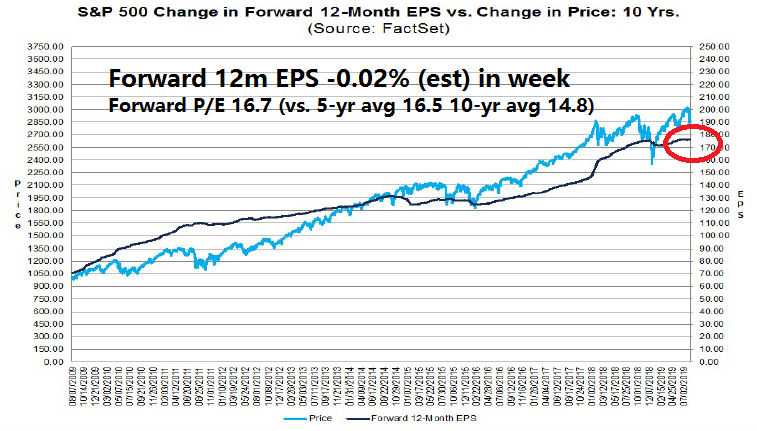
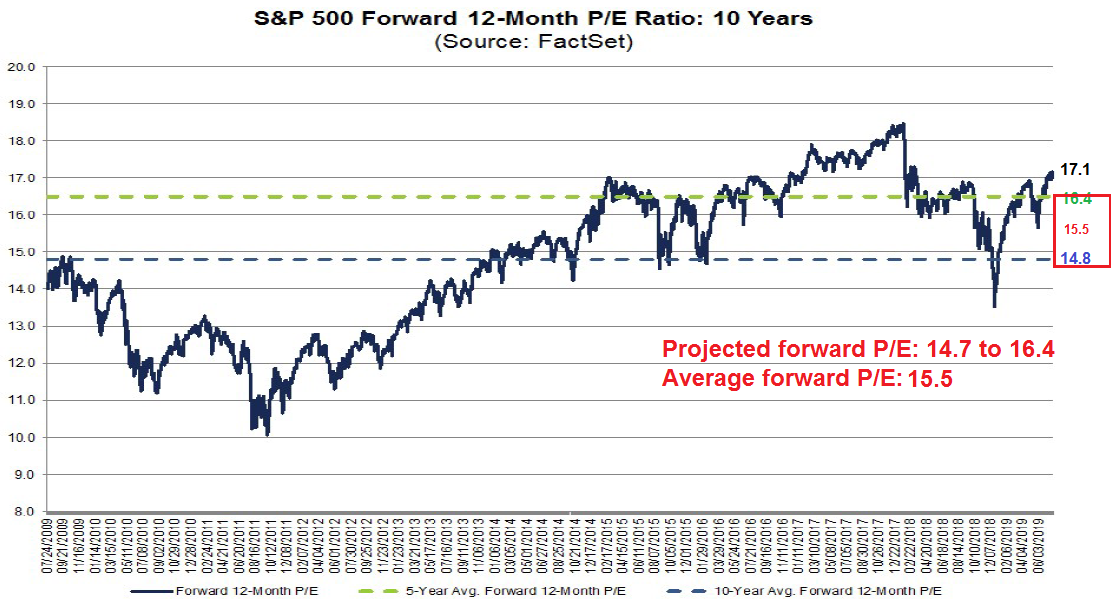
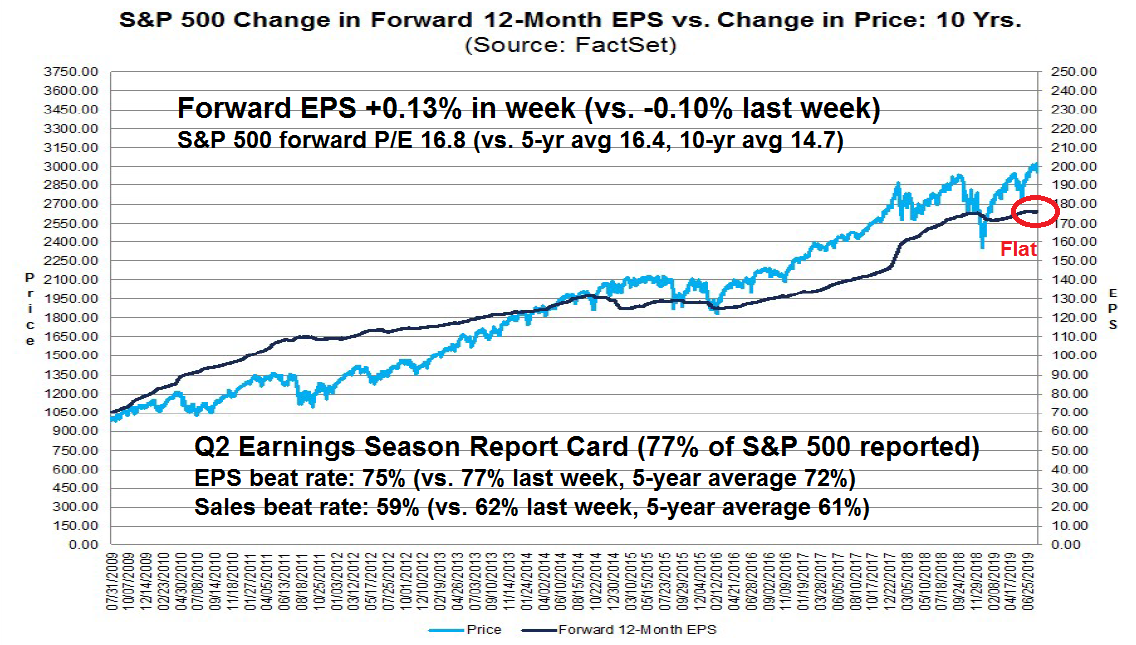
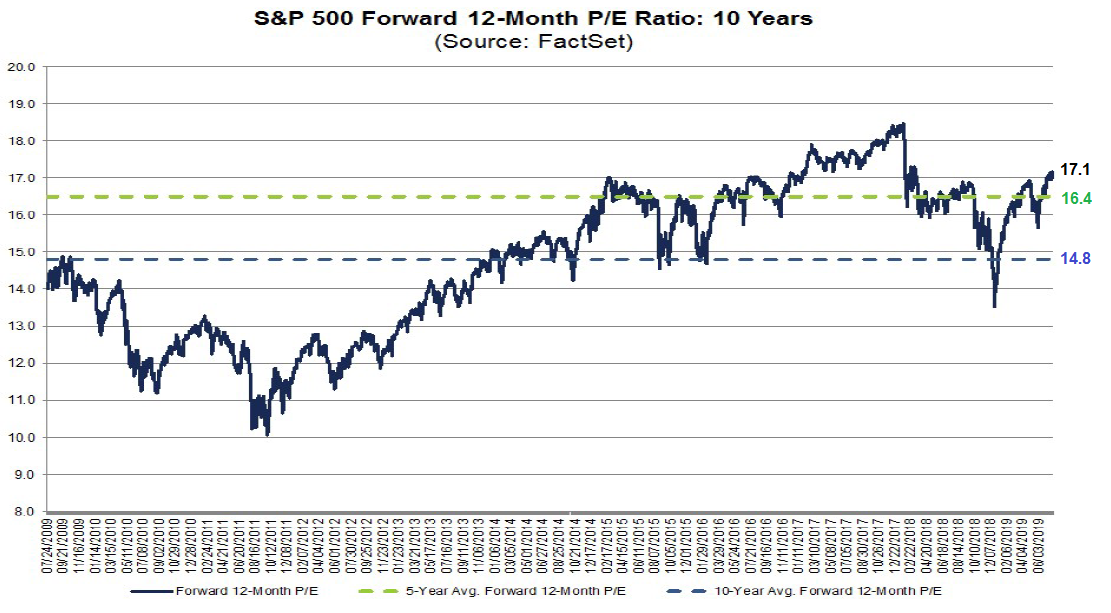
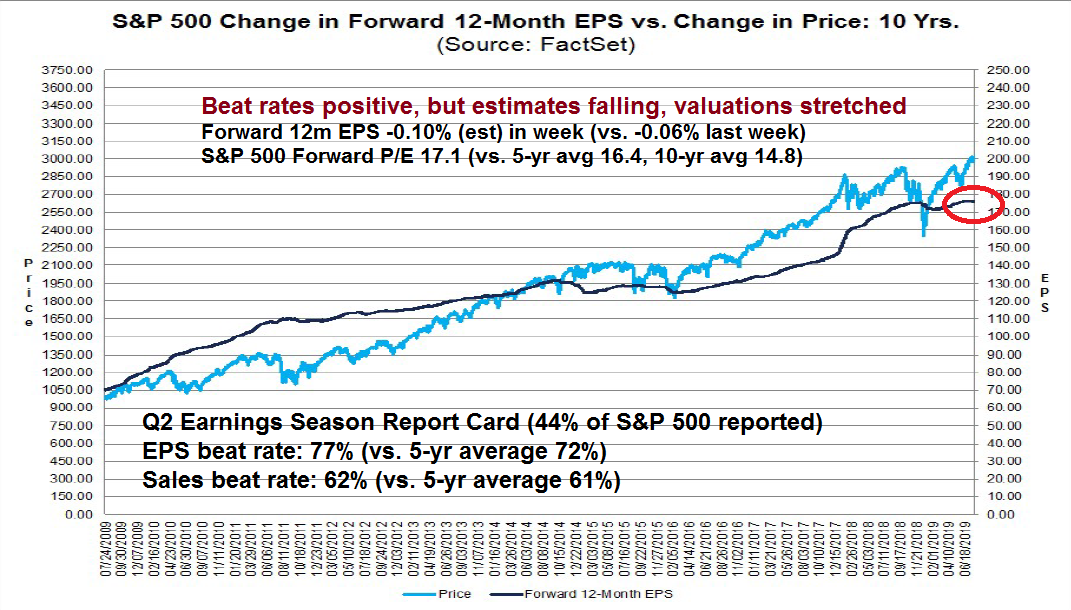
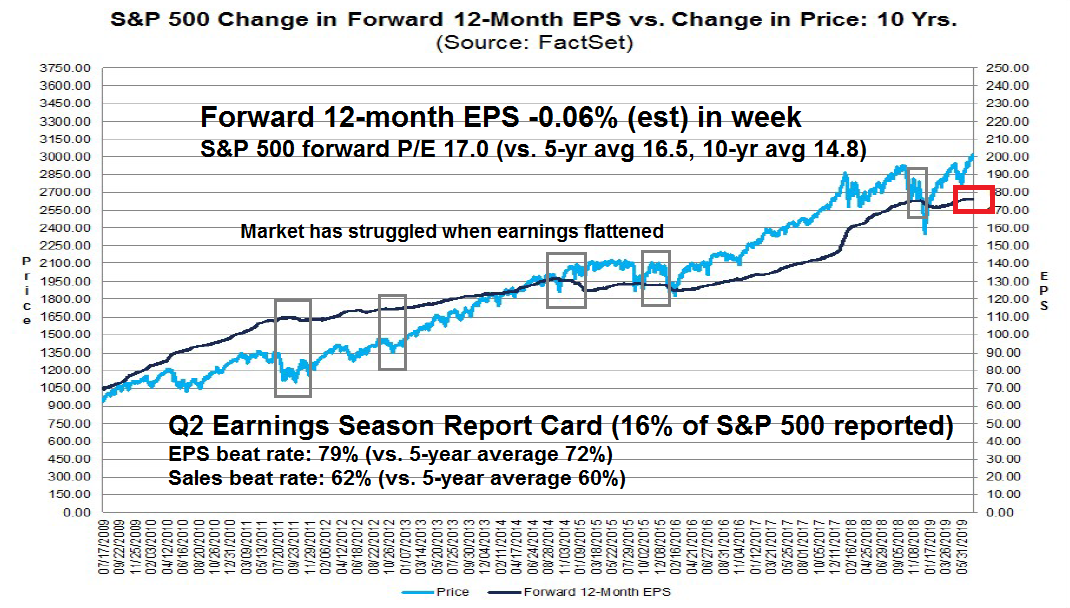
With 44% of the S&P 500 reported, the results are not encouraging. Even though the EPS and sales beat rates are above their historical averages, the latest update from FactSet shows forward EPS revisions are stalling. In addition, elevated forward P/E valuations leaves the market vulnerable to a pullback. As the chart below shows, price and forward EPS move together coincidentally, so the string of negative revisions is worrisome.
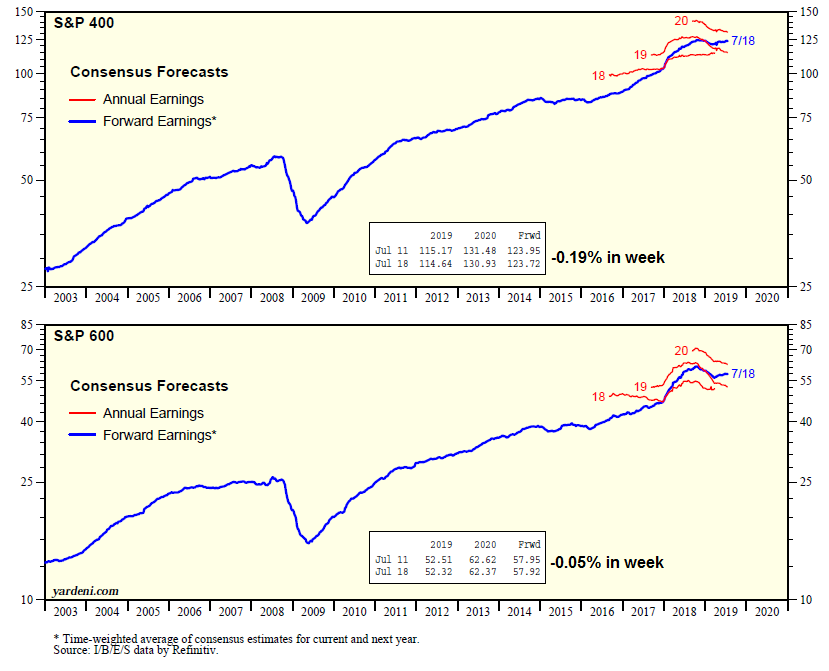
The softness in forward EPS revisions is evident across all market cap bands. Yardeni Research, Inc. found that mid and small cap estimates are also falling. Bear in mind, however, the Yardeni data lags the FactSet data (above) by one week, and therefore results are more preliminary as only 16% of the S&P 500 had reported.
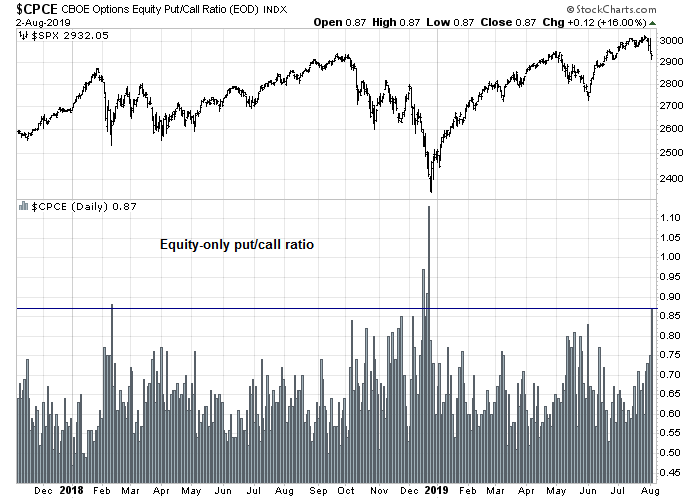
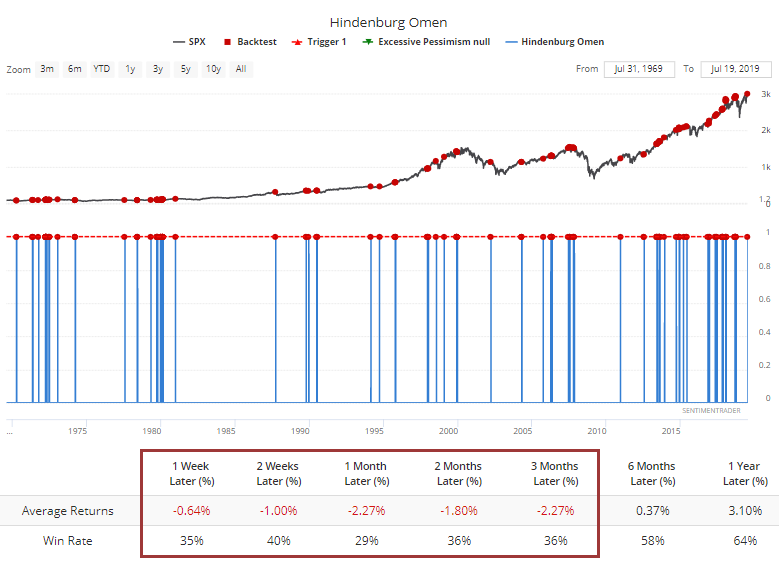
Helene Meisler, writing at Real Money, believes that the market is setting up for a volatility spike of unknown direction:
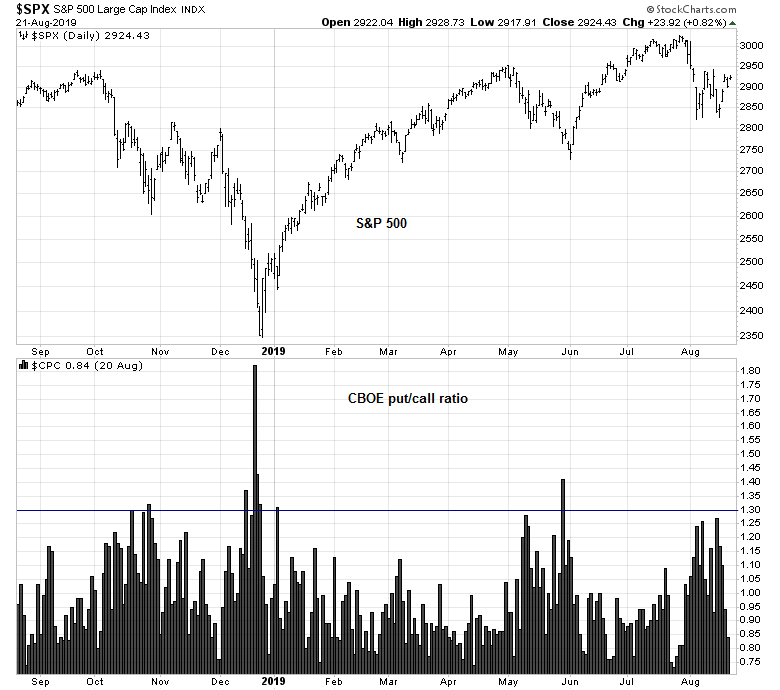
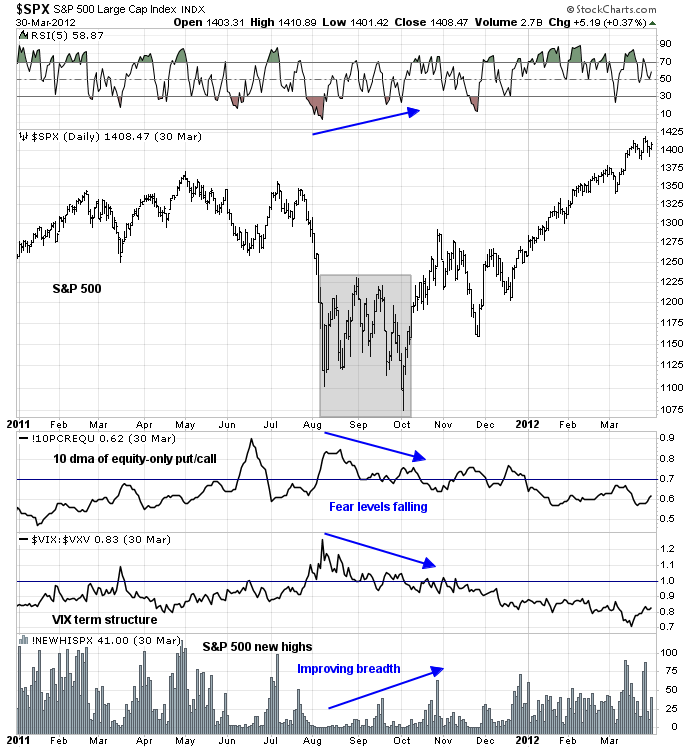
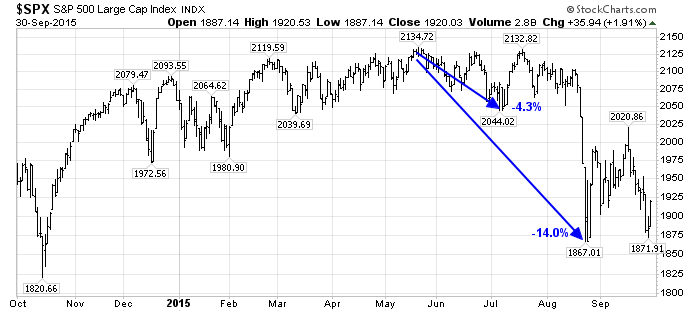
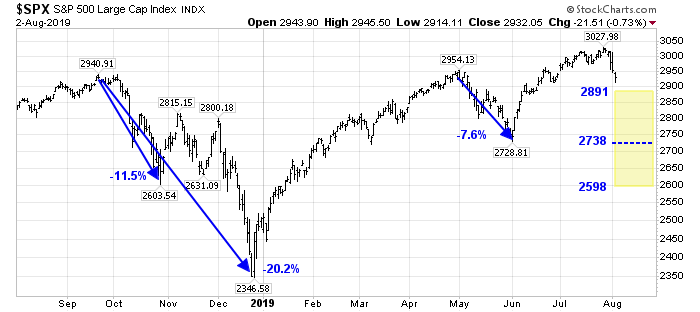
Speaking of volatility the put/call ratio for the Volatility Index was once again under 20%. Readings under 20% don’t come along very often, but back-to-back readings arrive even less frequently. In the last five years there have been six such instances, with three of them showing up since December of last year, so perhaps they are becoming more frequent.
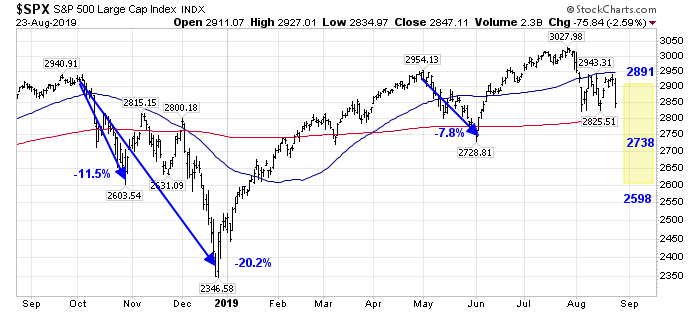
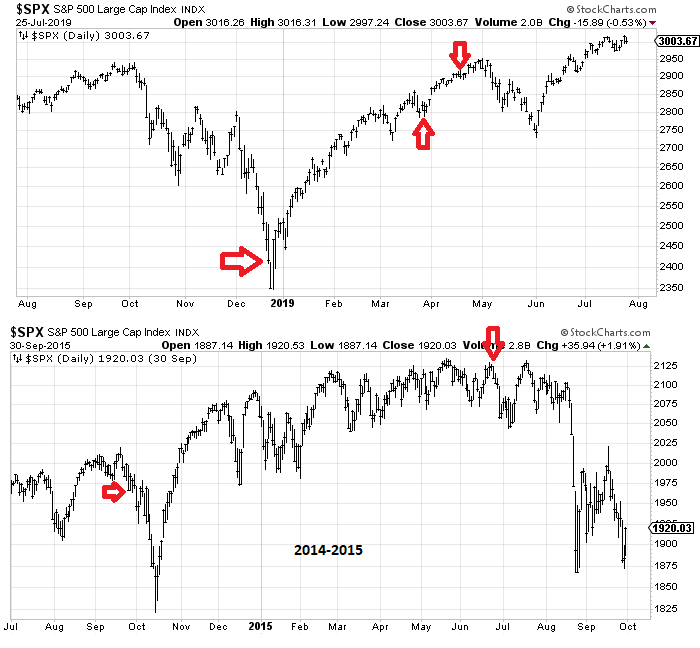
The takeaway is not that it’s bullish or bearish, but that we tend to get some sizable moves in the market in the ensuing month. Just look at the one year chart of the S&P with the three red arrows showing the times we had consecutive low readings for the VIX put/call ratio. Two were bullish and one was a precursor to a bearish move. But none produced small moves, did they?
Here are some examples she cited of past volatility episodes when the VIX put/call ratio fell this far.
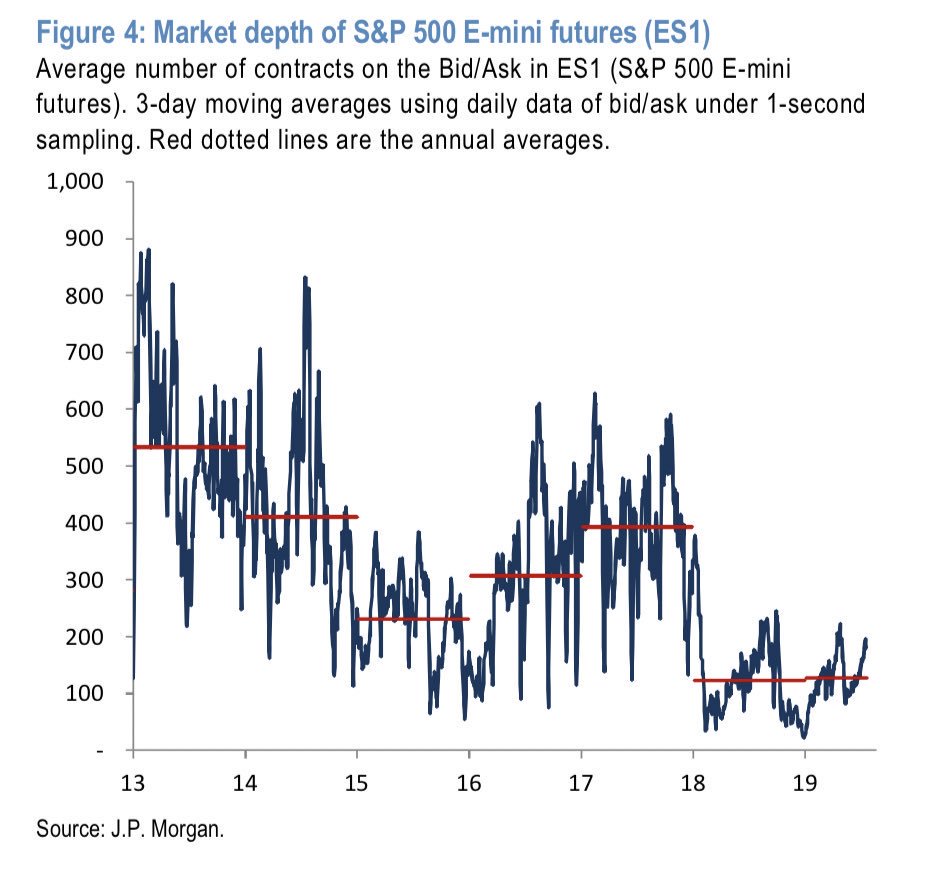
Should volatility spike, the short-term gyrations could be higher than in the past. CNBC highlighted analysis from JPM that the market depth of ES futures had declined, which could exacerbate the magnitude of unexpected price moves.
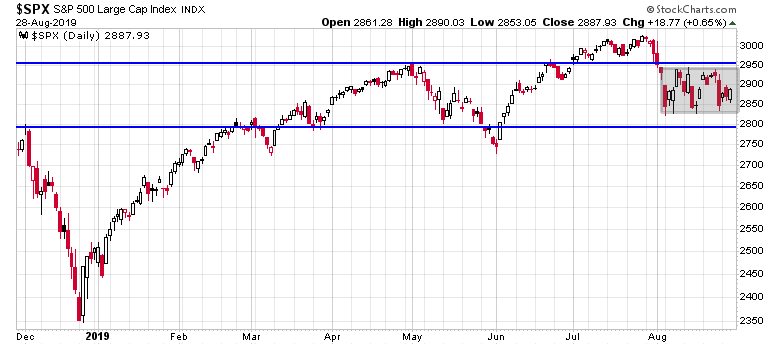
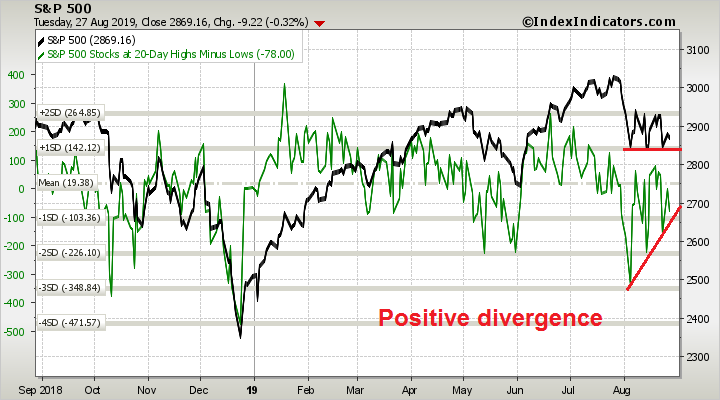
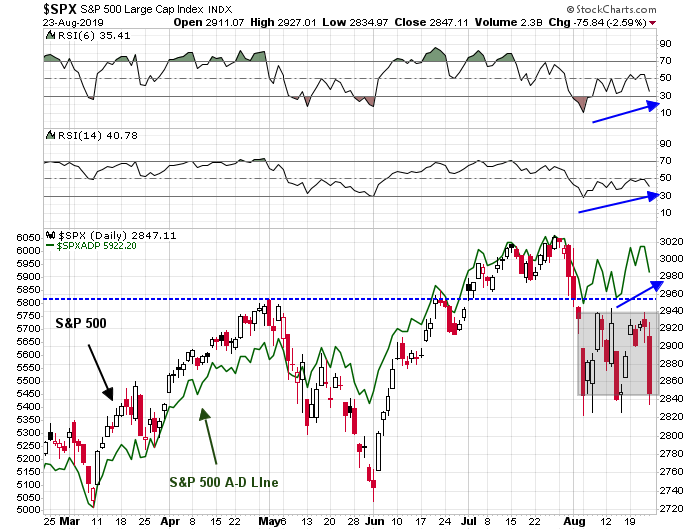
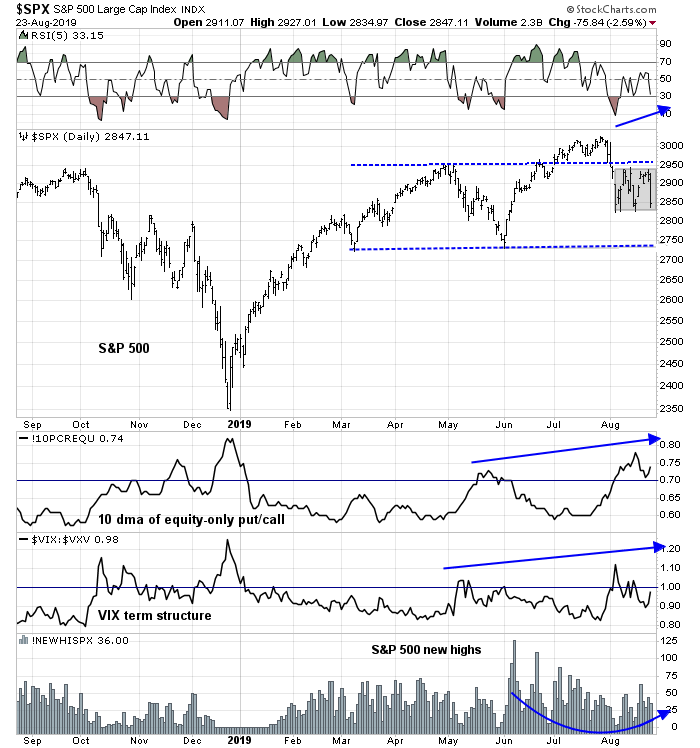
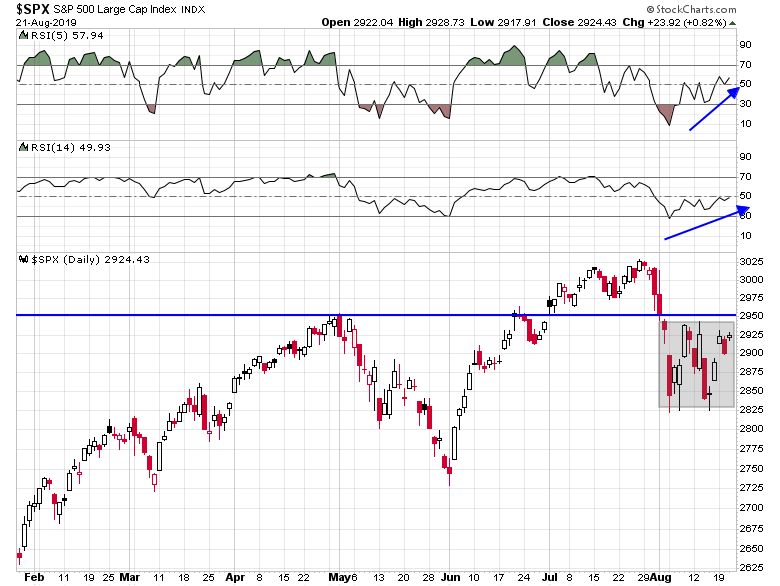
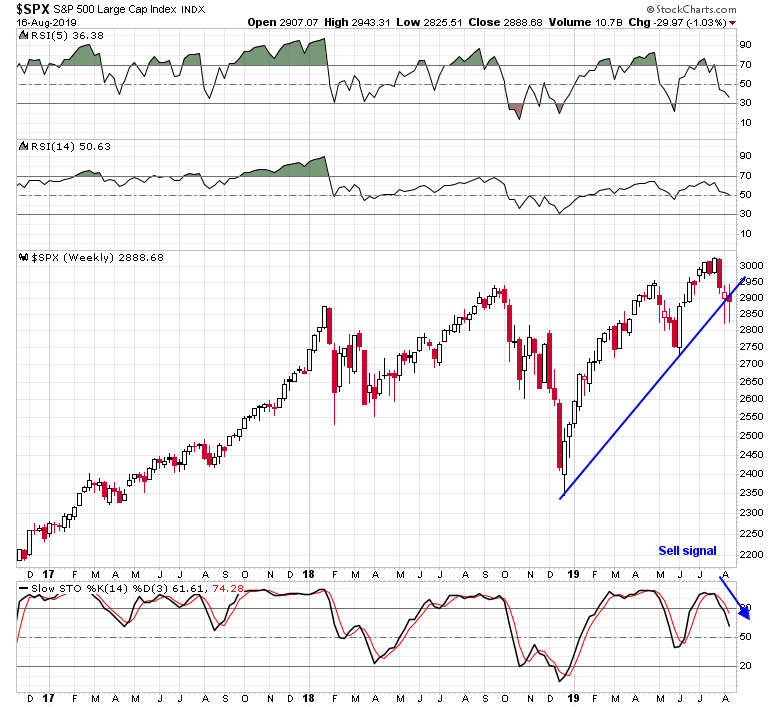
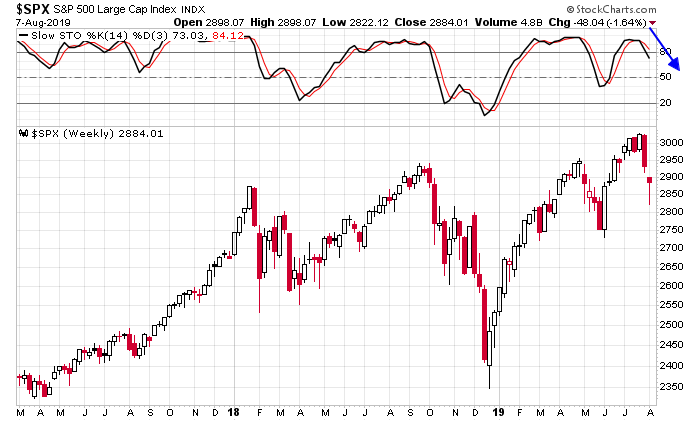
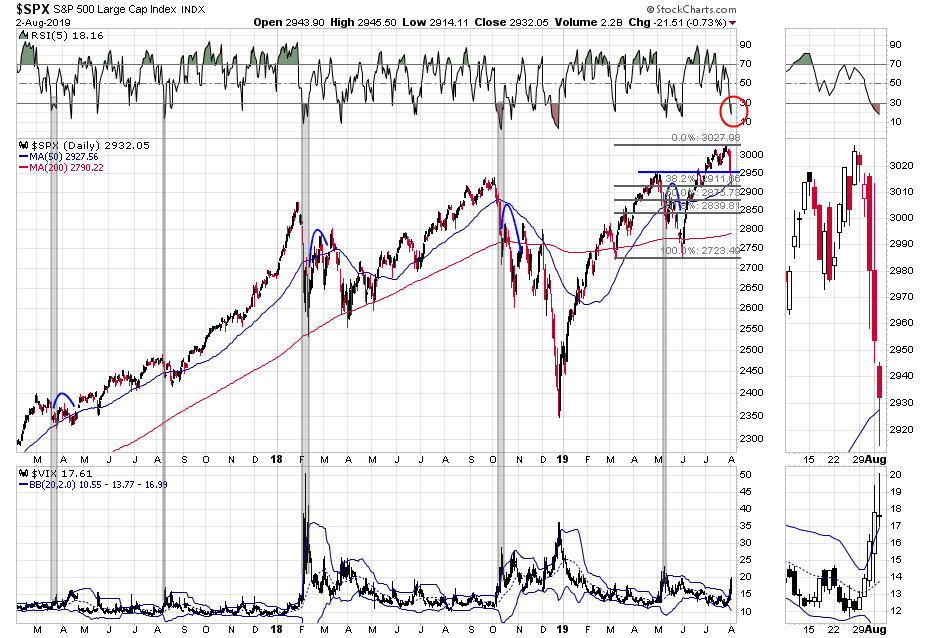
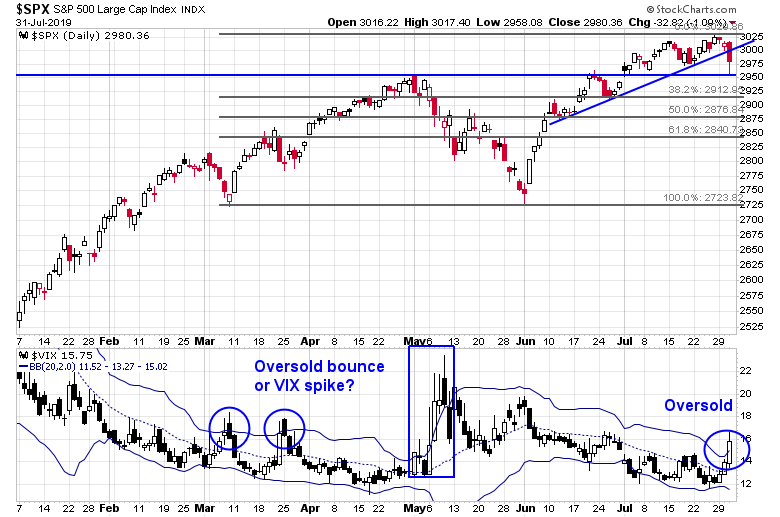
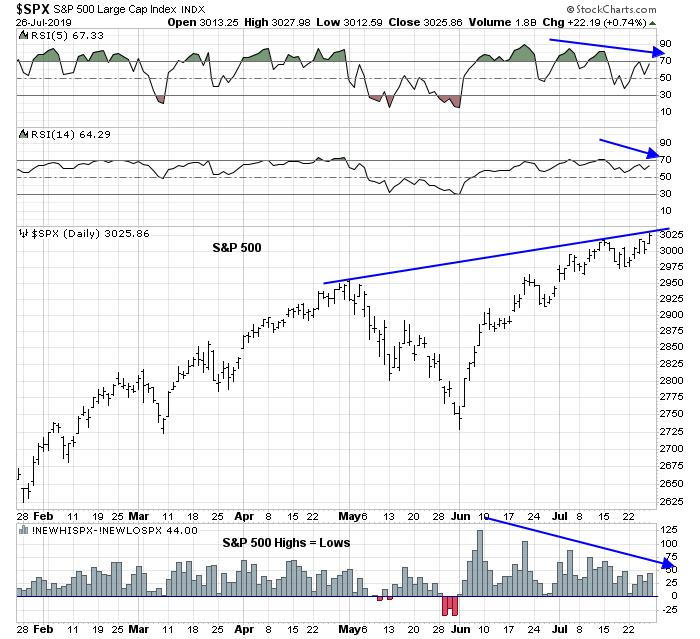
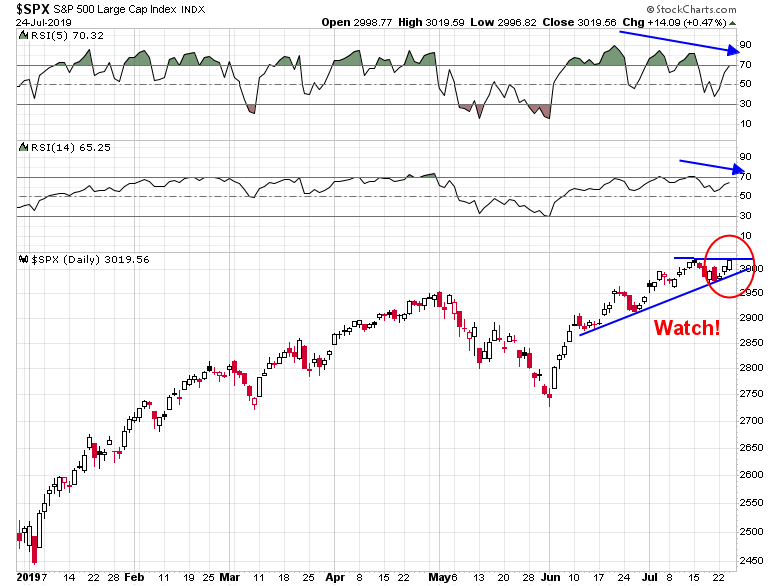
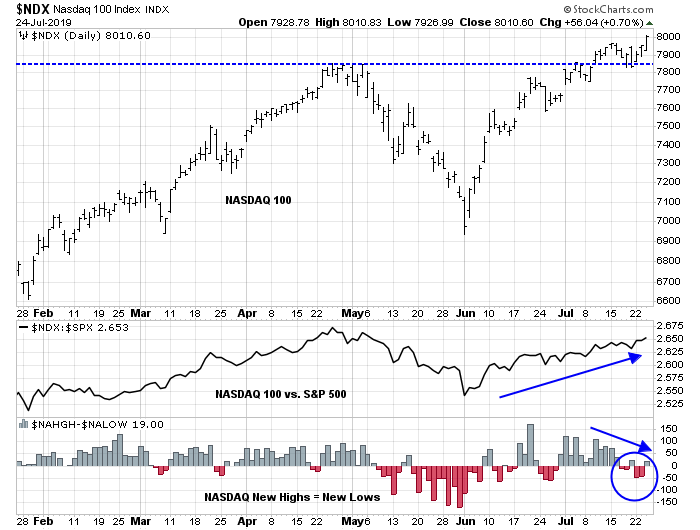
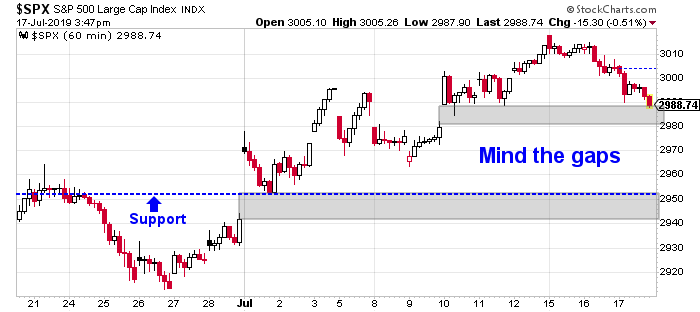
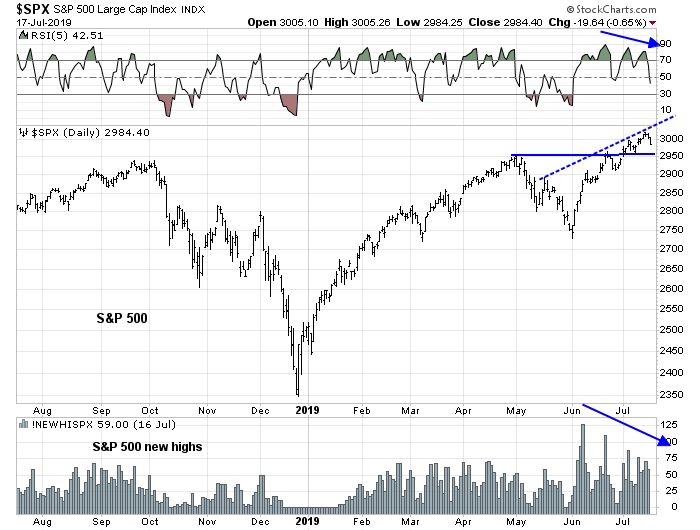
I continue to hold a tactical bearish bias because of the combination of negative estimate revisions and numerous technical warnings. Even as the S&P 500 tests an overhead resistance trend line, it is exhibiting negative RSI divergences, and diminishing momentum as measured by net highs-lows.
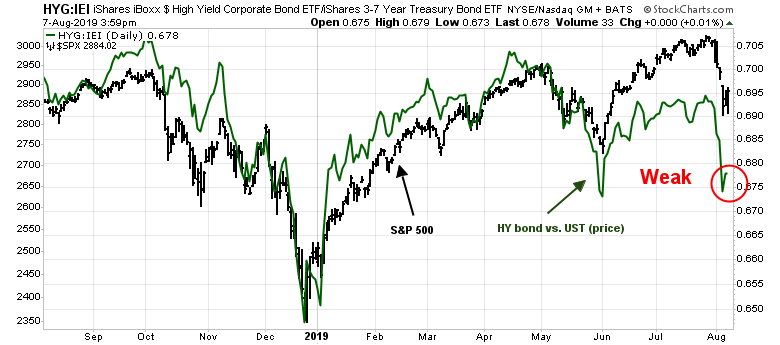
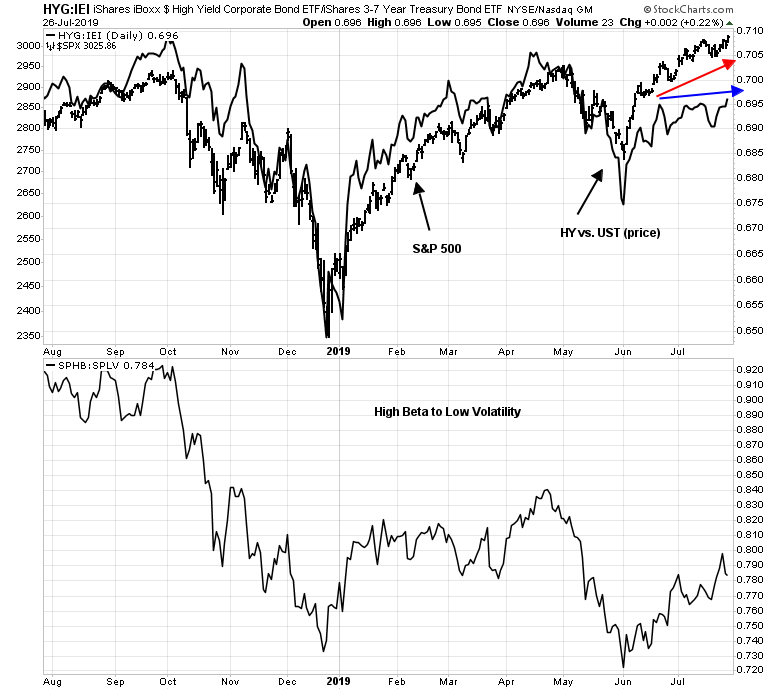
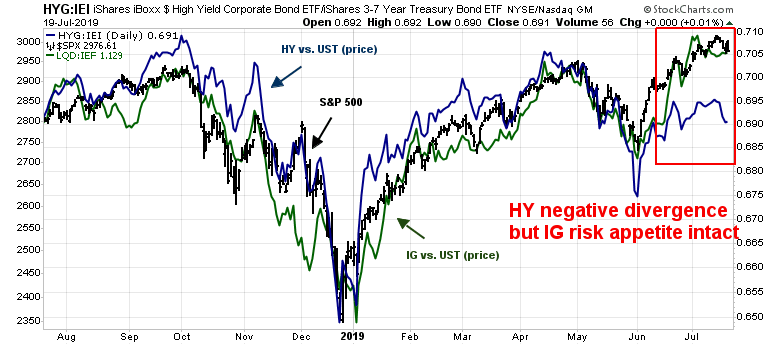
Risk appetite in both the credit and equity markets are not confirming the upside breakout to new highs. The relative price performance of junk (high yield) bonds to duration equivalent Treasuries is struggling (top panel). As well, the ratio of high beta to low volatility stocks are nowhere near the highs exhibited by the S&P 500 or the NASDAQ 100.
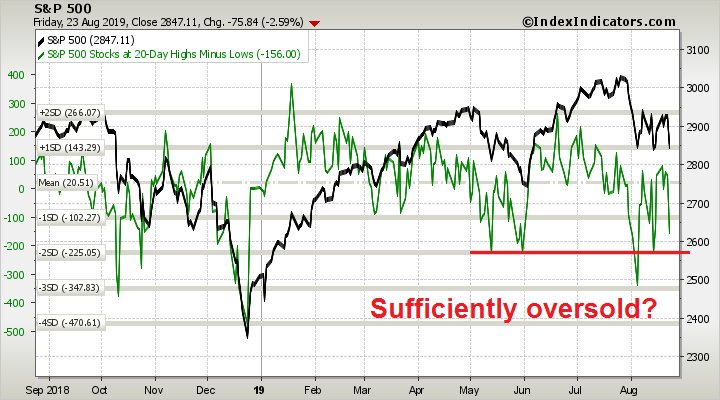
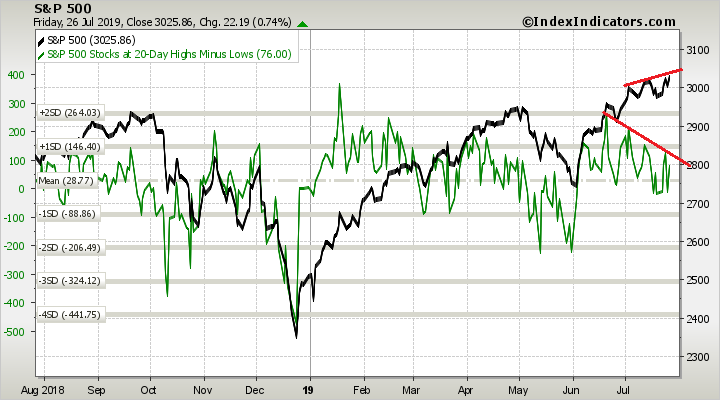
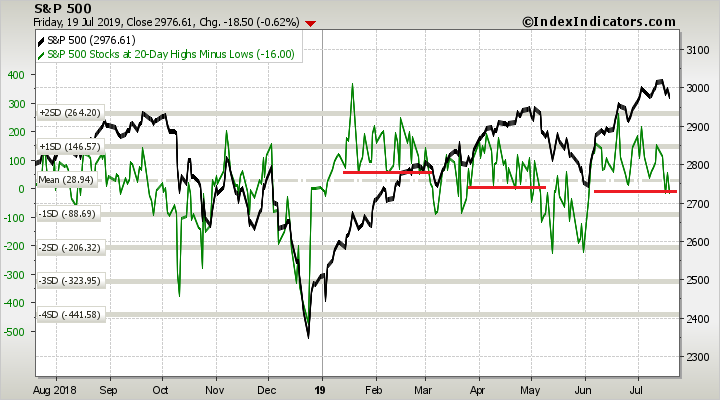
Other momentum indicators, such as net 20-day highs to lows, is in a downtrend.
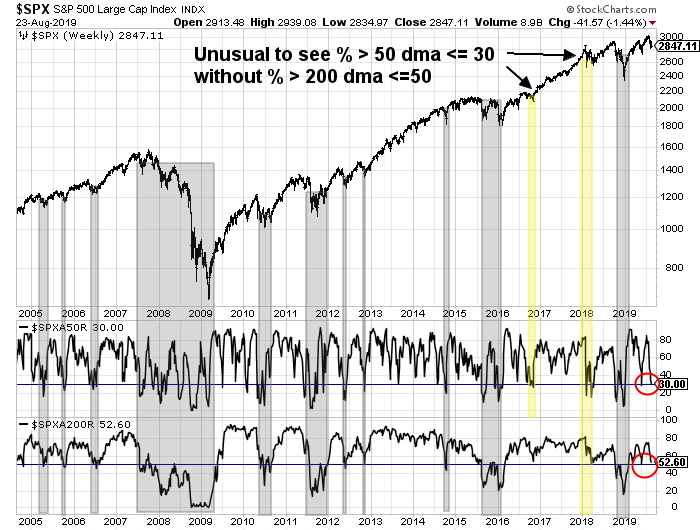
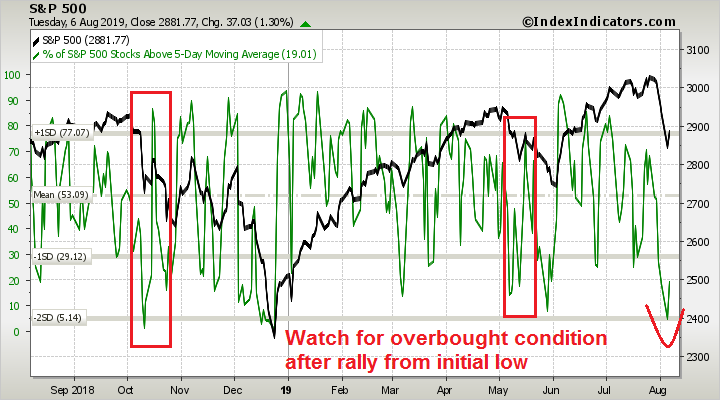
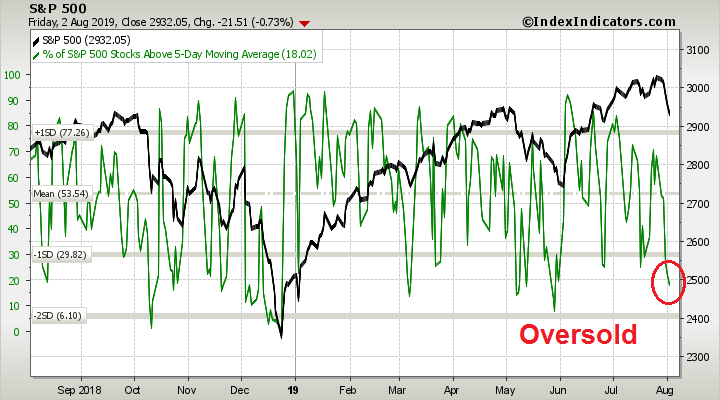
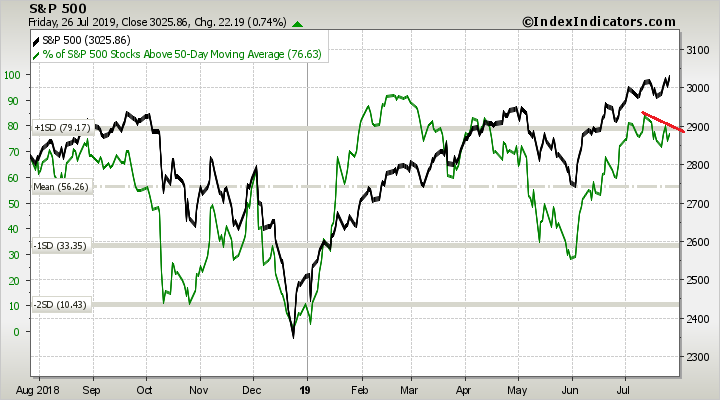
A similar pattern of lower lows and lower highs can be found in the % above the 50 dma for the S&P 500…
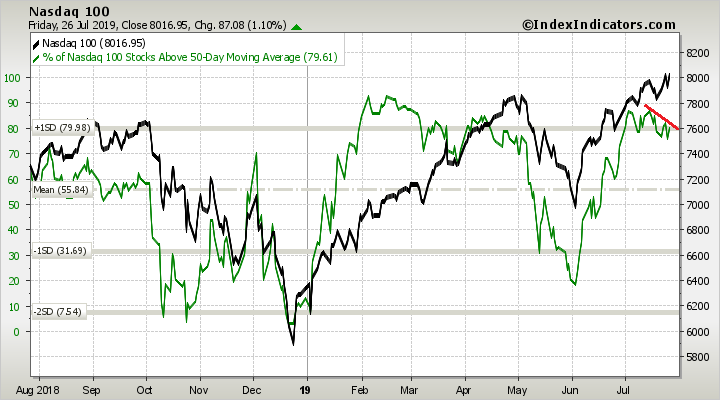
And for the NASDAQ 100, which has been the market leaders during this latest rally.
The charts of non-US markets are mostly unexciting. The rally in Europe has stalled.
The stock markets of China and her major Asian partners are not confirming US equity strength, with the exception of Australia, and Taiwan, which can be described as being in a constructive uptrend.
The strength of the Australian market appears to be an outlier. Industrial metal prices have pulled back after a brief rally. The stock markets of the other resource heavy economies are not confirming Australian market strength. The advance in Canada has stalled at resistance, and the other markets have pulled back.
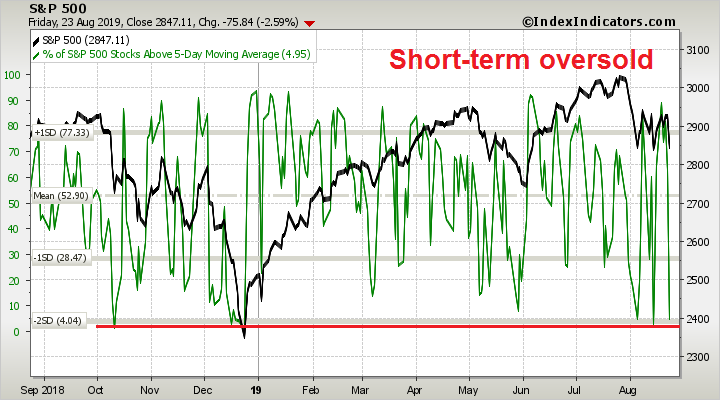
In short, both foreign markets and market internals are flashing warning signs on a variety of dimensions. This is not the time to be a hero. Upside potential remains limited. A volatility spike may be on the horizon. While stock prices could surge upwards, the odds favor the market hitting an air pocket.
My inner investor remains neutrally positioned. My inner trader is still short.
Disclosure: Long SPXU