Mid-week market update: Happy 2019 to everyone. The post-Christmas period started off with a bang. After bottom out on December 24, the stock market enjoyed four consecutive days of gains – until today when it was spooked overnight by a series of disappointing PMI prints.
The Caixin Manufacturing PMI fell to 49.7 from 50.2 (50.0 expected), indicating contraction. As a reminder, the Caixin PMI differs from China`s official PMI as the Caixin measures mostly the activity of smaller companies, while the official PMI measures the activity of larger SOEs.

Beijing has responded to past episodes of weakness with a stimulus program, but the stimulus announced so far has been underwhelming, as it has consisted mostly of targeted tax cuts. Anne Stevenson-Yang of J-Capital observed that China lacks the debt service ability for another round of shock-and-aw credit-driven stimulus.

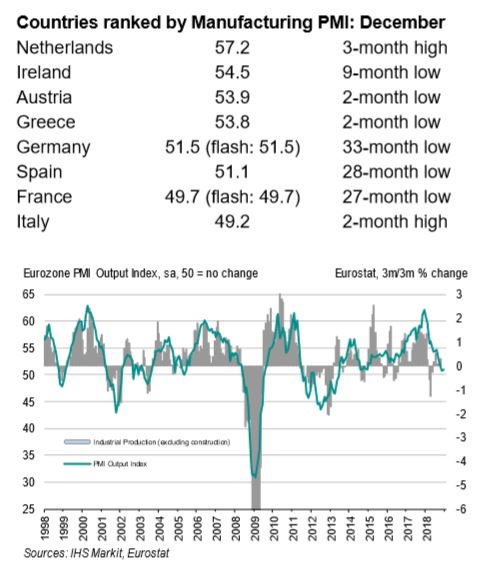
The market was further hit by the news of weakness in eurozone M-PMIs, indicating deteriorating European growth. The outlook for the core European countries of France and Germany stand out as particularly problematical.
While the disappointing PMI figures put stock prices under pressure at the open, the bulls must have been encouraged by the intra-day recovery to see the market close only slightly negative on the day.
Relief rally played out
The relief rally of the last few days appears to be playing itself out. The market had moved to a deeply oversold condition, and began to rebound on December 26. Subscribers received an email alert that I was selling all of my long positions and reversing to the short side in my trading account. Despite the market recovery during the day, the SPX has broken down out of a rising wedge on the hourly chart. The path of least resistance in the near-term is down.

Short-term breadth (1-2 day time horizon) had become overbought (readings are as of the close Monday).

Longer term (3-5 day horizon) had recovered to a near overbought level, and the 2:1 advance-decline breadth today will extend the reading closer into the overbought territory.

V-shaped bottoms are rare. A more likely scenario is a low, rally, and then a decline to re-test the previous low. The re-test may see an undercut of the old low, but the key indicator to watch will be whether momentum indicators such as RSI flash positive divergence signals.
The current news backdrop is extremely fickle, and the markets have been understandably jittery. Nothing goes up or down in a straight line. Prepare for some short-term downside volatility.
Disclosure: Long SPXU
What happened in July, 2018, when, in the short term
horizon chart, the breath got to almost 90%, but the
market DID NOT back off. Instead, it stated its steady
march to a new high?
That seems to be the “only” period in the charts, where
there was not “selloff.”
Your thoughts?
Thanks & Happy New year
You do incredibly good work. God Bless You!
I would characterize July 2018 as a correction/dip within an uptrend. It was not a climactic low in the manner of the February low or the April re-test.
Once again a good call by Cam on the short signal now that SPX futures is down about 1.4% after market with the Apple earnings guidance. Today the SPX was alone in breaking the uptrend line in the first hour as well as the last hour of trading while the DOW and Nas Comp stayed above. The first time that price broke the up trend line was by the Tuesday overnight gap down, the market $UVOL breadth quickly came in and pushed the indexes back up. It was only in the last hour of trading that the divergence between higher price and lower breadth revealed itself especially in the SPX breadth and that period was probably the better entry for shorts for the day. It will be interesting to see how long the SPX stayed below the up trend line for tomorrow’s session and if the 2465 level or even the 2437 VWAP line from 12/27 will be tested.
I fear that the earnings guide-downs will continue. First the semi is gone. Now if the final pillar of info tech, i.e. cloud-related issues, also sees same down trend, then the tech will be destroyed. These cloud-related stocks are the last group in info tech still up there. Most of them are very expensive and can fall a lot. Imagine a scenario when Amazon comes out with weak AWS numbers, and what that will do to Microsoft and Google share prices?
Another final strong sector, medical devices, is starting to really break down today.
I think Apple is an outlier in the grader scheme of things. Most commentators are saying this revenue miss is due to China’s growing weakness. My contention has been and continues to be that Apple is a casualty of Trump’s nationalistic policies turning into consumer nationalism. Huawei, a global cellphone leader and one of China’s most revered successes, is being attacked by the U.S. Why wouldn’t Chinese consumers react by not buying Apple’s products?
I’ve been saying all year that Trump’s trade war will lead to consumer nationalism that damages American brands overseas. Stocks of U.S. leading brand companies are significantly underperforming the market. Expect foreign Starbucks and MacDonald outlets to see protests as the trade war heats up.
Reagan said “America is a shining city upon a hill whose beacon light guides freedom-loving people everywhere.”
American brands basked in the glow of that global positive leadership. Trump has come right out and said, “We are only out for ourselves and you guys should be for yourselves too. We’ll build our wall and keep you out.” The negative effects on American global brands are the unintended consequences.
Well put Ken
Thank you Cam! I’m new and yesterday’s Trading Alert was great. Sold several positions early (including AAPL) to lighten up. Was so glad when I saw the news!
Ken, I think you make an insightful point about consumer nationalism. This will be a bigger and bigger problem for American multinationals.
Bert
What I was looking at was a cup and handle pattern…and if we are breaking out of it then the target is over 2700. This is the problem with TA, it is always more a question of potential, and when you look back the patterns work because then it is no longer about possibilities. I still do TA but it can be so misleading. Even now this could be a false breakout of a cup and handle.
Hi Cam, thank you very much for all your work. Can you please drop a comment in your weekly post in relation to Major Accumulation Day – there is second in very short time period since Xmass. I saw comments from Urban Carmel and some others that it is a big bullish sign. I have also checked i ZBT finally send a signal (thx for your link you provided couple years ago) and still not. For me it is sounding strange why people like W. Delwiche and U. Carmel turning relatively bullish.
As for me I see the problem with major accumulation days (nowadays): 1. low liquidity (Xmass + New Year vacation season); 2. reaction for tweets (promises from FED, stimulus from China, …). As for me it is all the same overreaction on bad news then overreaction to bad news. I have also retweeted you interesting chart from OddStats to the above topic.
Thank you very much in advance for your answers.
Have a nice day
Petr
The current price is still just outside the wedge lines drawn.
It raises more questions of whether some indicators are more relevant than others in this context? Else what we are seeing suggest further choppy movement until a decision is made.
Now considering whether to close out completely and wait, else ride this out.
What do people think of the SPX 1 hour, 4 hour, weekly and monthly charts as a whole?