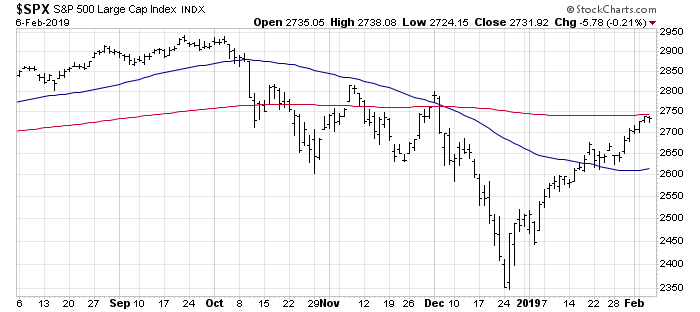
Mid-week market comment: The SPX has risen roughly 400 handles since the December 24 bottom, and it is approaching its 200 dma. Can the market stage a sustainable rally above this key hurdle?
Golden clues
For some clues, we can turn to the price of gold. The top panel of the chart below shows that gold prices tend to have an inverse correlation with stock prices, and that relationship is especially true now. When stocks rise, gold falls, and vice versa.

Here are some clues to the likely direction of stocks from gold prices. First, the long-term outlook for gold prices looks impressive. It is formed a multi–year saucer shaped base. The objective on an upside breakout is about 1560 based on point and figure charting.

In the short run, however, the golden rally looks exhausted and due for a pullback. Gold prices are testing the underside of uptrend resistance. Similarly, the inflation expectations ETF (RINF) is displaying a similar technical pattern of approaching trend line resistance.
When I turn to gold equities (GDX), the silver/gold ratio is exhibiting a negative divergence that is not supportive of further strength. Silver is the poor man’s gold, and it tends to have a higher beta than gold. The underperformance of the silver/gold ratio is therefore another short-term cautionary sign for gold bugs.

In addition, Mark Hulbert pointed out that the sentiment of short-term gold timers is an off-the-charts bullish reading, which is contrarian bearish.

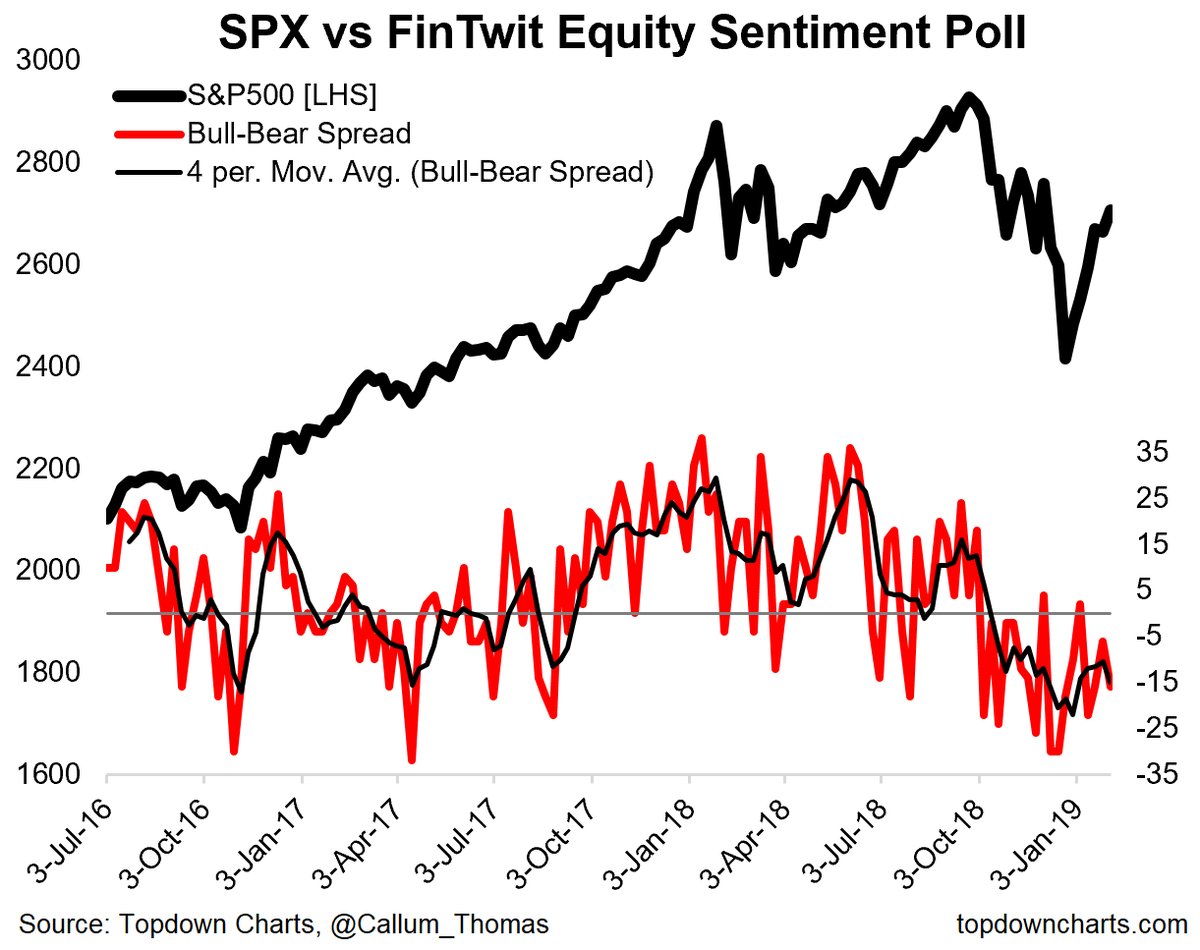
Contrast those sentiment readings with Callum Thomas’ weekly (unscientific) Twitter poll conducted on weekends, which still shows respondents to be net bearish even after last week’s advance. Stock prices are climbing the proverbial Wall of Worry.
In conclusion, while the longer term outlook for gold prices is bullish, this precious metal appears overextended in the short-term. The inverse relationship between gold and stock prices implies a bullish outlook for US equities.
Cautionary tripwires for equities
However, this does not mean that traders should pile into stocks with abandon. The stock market is highly overbought, and it can either consolidate or correct at any time. Here are a couple of cautionary signs that I am watching for.

- RSI-14: While the series of overbought readings flashed by the RSI-5 indicator could be signals of “good overbought” conditions, an overbought reading by the longer term RSI-14 indicator has historically been a cautionary sign of an extended market.
- VIX below lower BB: In the past, the VIX Index falling below its lower Bollinger Band has also been another cautionary signal for the stock market. Intra-day dips below the lower BB isn’t enough, it’s the closing price that raises the red flag. Watch for it.
My inner trader went long the market earlier this week. He is bullishly positioned, but he is watching these triggers as signals to exit his long positions.
Disclosure: Long SPXL
200 handles?
200 S&P points
400 points… handles…. clams… whatever then? From 2350 Dec 24 to about 2750 today?
You are correct. My mistake. I was fixated on the 200 dma.
lol, ok, sorry. I learn a lot here so I was ready for another round. I really enjoy and appreciate your work Cam.
See Mark Hulbert’s graph above. A retest of the 1200 $ per oz price of gold would be a very important bottom, if it were to happen. Even 50% Fibonacci retracement (1300-1200 = 100$) to 1250 $ per oz. would be a good entry for the next leg up in gold (to say 1600 give or take).
Cam or DV, what time frame do you in mind to achieve your target price for gold?
No upside breakout is assured, but if gold does break out, I would expect that it would achieve its upside point and figure target of 1560 in the next 3-4 years.
Thank you, Cam.
As I noted in the comment a week ago, my analysis said we were approaching a short term top for SPX and I was looking for max upside of 2735. This week’s high so far of 2739 intraday is close enough to call the ST high.
Next should be around a 2% pullback at minimum and then another leg up to 2800 or even possible double top test of 2950 before an intermediate-term top.
But there is a hitch… My E-wave count shows 3 wave up completing here. So the expectation is that a 4th wave pullback of 2% or so sets the stage for a 5th wave up to 2800 or even 2950. But that assumes this is an impulsive rally which would signal a the first leg of a new bull market underway… I do believe that is the case. But what if I’m wrong and this is a bear market rally?… Well then this week’s top forming here would be the start of the next leg down in the bear market… Yikes!
First warning sign for bulls of this doomsday scenario would be to close below 2700. Major red flag would be to close below 2650.
Also concerning for bulls is that my proprietary options sentiment indicator flashed a sell signal at the close. The last 3 sell signals from this indicator took place on: 10/5/18 (we all know what came next), 10/28/16 (right before the Trump election sell-off when futures went limit down overnight), and 6/20/16 (right Before the Brexit sell-off)… Does the smart money know some surprise bad news is coming? Trade talks breakdown on tap or new shutdown with maybe Trump declaring emergency powers?…
Hmmmm… “WHITE HOUSE ADVISER KUDLOW SAYS THERE IS A PRETTY SIZABLE DISTANCE TO GO IN U.S.-CHINA TRADE TALKS -FOX BUSINESS NETWORK INTERVIEW”
and there the predicted 2% pullback… If this is wave 4 pullback (bullish dip) could possibly still go as low as 2650ish, but also could be complete here… I covered my short and starting to nibbling long now…
Excellent Call!! wwshepler.