Preface: Explaining our market timing models
We maintain several market timing models, each with differing time horizons. The “Ultimate Market Timing Model” is a long-term market timing model based on the research outlined in our post, Building the ultimate market timing model. This model tends to generate only a handful of signals each decade.
The Trend Model is an asset allocation model which applies trend following principles based on the inputs of global stock and commodity price. This model has a shorter time horizon and tends to turn over about 4-6 times a year. In essence, it seeks to answer the question, “Is the trend in the global economy expansion (bullish) or contraction (bearish)?”

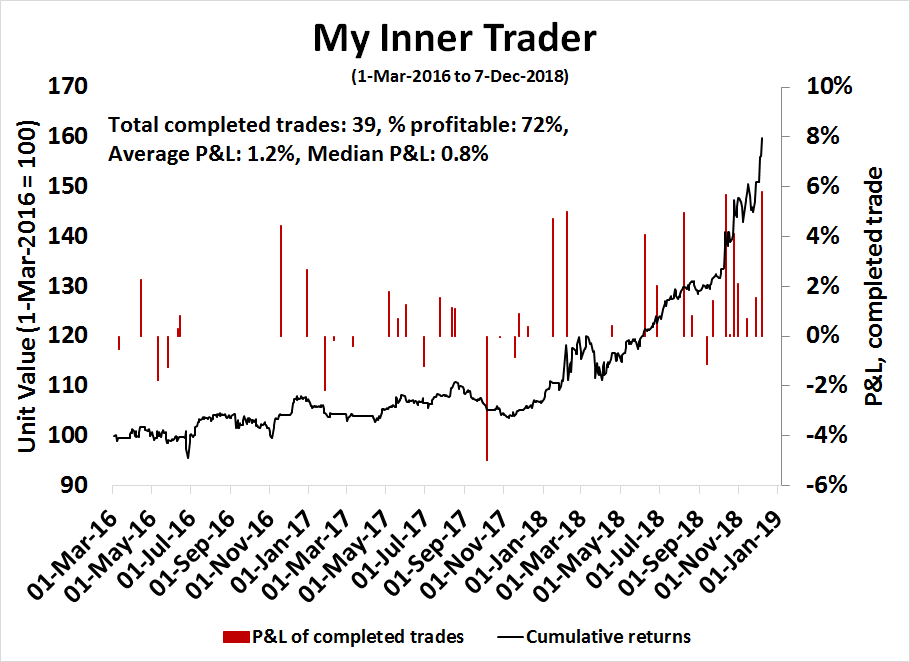
My inner trader uses the trading component of the Trend Model to look for changes in the direction of the main Trend Model signal. A bullish Trend Model signal that gets less bullish is a trading “sell” signal. Conversely, a bearish Trend Model signal that gets less bearish is a trading “buy” signal. The history of actual out-of-sample (not backtested) signals of the trading model are shown by the arrows in the chart below. The turnover rate of the trading model is high, and it has varied between 150% to 200% per month.
Subscribers receive real-time alerts of model changes, and a hypothetical trading record of the those email alerts are updated weekly here. The hypothetical trading record of the trading model of the real-time alerts that began in March 2016 is shown below.
The latest signals of each model are as follows:
- Ultimate market timing model: Sell equities
- Trend Model signal: Bearish
- Trading model: Bullish
Update schedule: I generally update model readings on my site on weekends and tweet mid-week observations at @humblestudent. Subscribers receive real-time alerts of trading model changes, and a hypothetical trading record of the those email alerts is shown here.
The Ultimate Timing Model flashes a sell signal
Over the years, I have struggled with the problem of integrating technical analysis into an investment process. Trend following systems that employ one or more moving averages work well longer term, but they have the disadvantages of being slow (by design), and they can produce false positives which whipsaw during trendless periods.
The chart below shows how a simple 200 dma as a buy and sell signal would have worked for the SPX in the last 20 years. The good news is it kept you out of major bear markets, but at the cost of numerous whipsaws, which are circled.
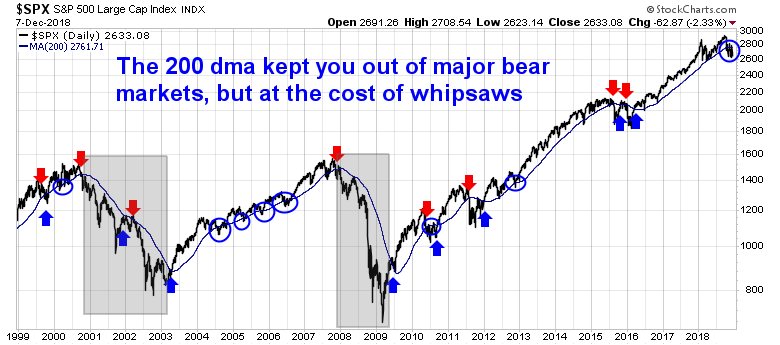
I am indebted to the blogger at Philosophical Economics who suggested a macro overlay to trend following systems (see Building the ultimate market timing model). Major bear markets generally occur under recessionary conditions. Why not ignore moving average signals until your macro model is forecasting a recession?
This “Ultimate Market Timing Model” is ultimately beneficial for long-term investors. If you could cut off the left tail of the return distribution and avoid the really ugly losses, you could run a slightly more aggressive asset mix and receive a higher expected return with lower risk. For example, if the standard risk-return analysis dictates a 60% stock and 40% bond asset mix, you could change it to a 70/30 mix with this model, and get downside risk similar to the 60/40 portfolio. To be sure, this system isn’t perfect, and anyone using such a model will have to incur “normal” equity risk, and it would not have kept you out of the market in the 1987 Crash.
Stock prices have been weak for several months. Today, any flavor of moving average system would produce at best a neutral signal, and at worst a sell signal. At the same time, I have been maintain a Recession Watch suite of long leading macro indicators designed by New Deal democrat to spot recessions a year in advance. My latest review (see 2019 preview: Winter is coming) shows that the macro models are flickering red, indicating a slowdown in 2019, but I am not ready to call a recession yet using conventional macro analysis.
However, good modelers also know the limitations of their models, and other factors that are not captured by the Recession Watch indicators are sufficiently negative for me to call for a recession to start in late 2019 or early 2020. The combination of weak stock prices and a recessionary call therefore changes my Ultimate Market Timing Model to a sell signal.
The current drawdown for the SPX from its peak is about 10%, which represents an acceptable level of equity risk for a long-term asset allocation model for patient money. Investment oriented accounts should move to a maximum defensive posture. Tactically, the market is very oversold and poised for a relief rally. Investors should take advantage of any strength to reduce equity risk. Traders may want to position themselves for the anticipated advance into year-end.
A Recession Watch review
The Recession Watch indicators are separated into three broad categories:
- Household sector
- Corporate sector
- Financial and monetary conditions
So far, the household sector has been weak, and the weakness can be especially seen in the cyclically sensitive housing sector. Monetary conditions are decelerating as the yield curve continues to flatten and real M1 growth has negative for two consecutive weeks. However, readings are noisy and not persistent enough to call for an outright recession,
The good news is the corporate sector has been relatively healthy. In particular, corporate profits are holding up well, the latest ISM Manufacturing and IHS Markit Manufacturing PMI releases have been strong. Moreover, recessions have always coincided with tightening credit, and credit conditions remain loose.
In conclusion, the economy is weakening, but not weak enough to make a definitive recession call.
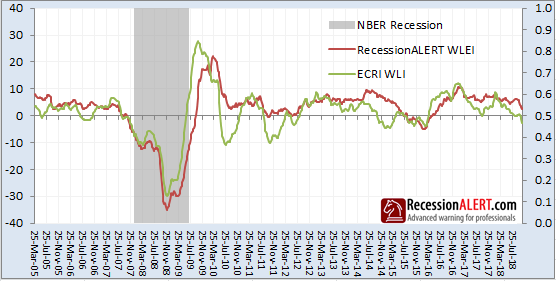
A separate recession model by Dwaine Van Vuuren of Recession Alert is also very near a full-blown recession signal. He compared his own model to the ECRI Weekly Leading Indicator (WLI) and found that WLI tends to be noisier, more responsive to changes to conditions, but at the price of more false positives:
The ECRI WLI can lead the WLEI on many occasions, as it is composed of some longer leading and/or more sensitive indicators than the WLEI.
When we constructed the WLEI our focus was less on longer leading characteristics and more on less “false positives”. As you can see from the chart the WLI has had 4 false positives so far this business cycle versus 1 for the WLEI. It’s a good pairing for high frequency leading data – you take the ECRI WLI as the 1st warning and the WLEI as second. If both are flagging recession, which looks increasingly likely in the next few weeks, you obviously need to take note and start consulting the more robust monthly models or the SuperIndex which is composed of many monthly models.
Notwithstanding the results of conventional economic analysis, here are the two reasons that made me make a recession call are:
- Global weakness and fragility
- The (almost) inevitability of a full-blown trade war
Global weakness
I recently had a discussion with a reader about my set of long leading indicators, and he pointed out the blind spot in my approach. The rest of the world has been slowing substantially, and the US has been the last bastion of growth. Focusing on just US-centric indicators will therefore result in a falsely rosy view.
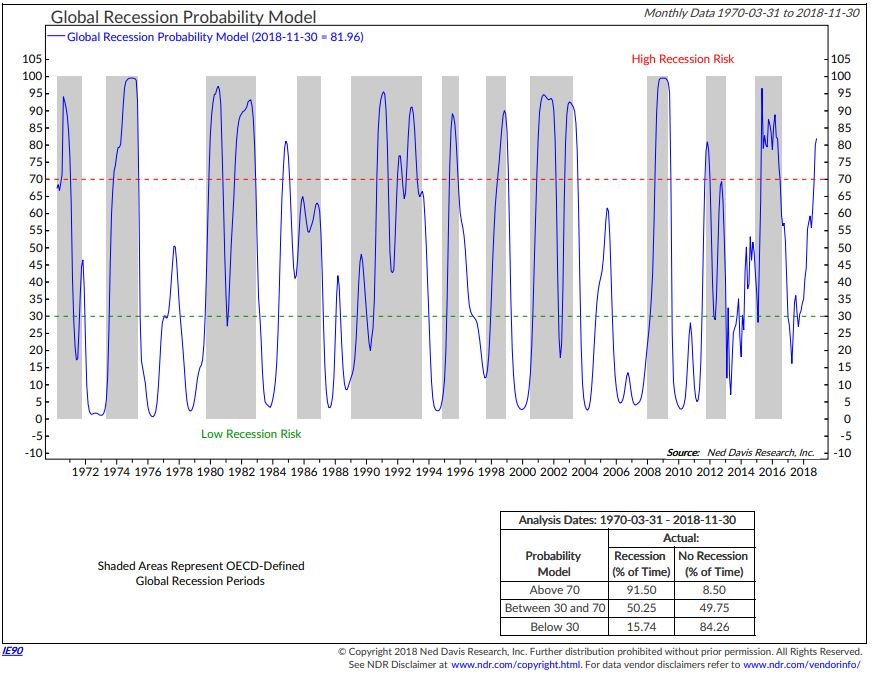
Indeed, the NDR global recession probability estimate now stands at 82%, while most US recession models are in the 30% range, which is much lower.
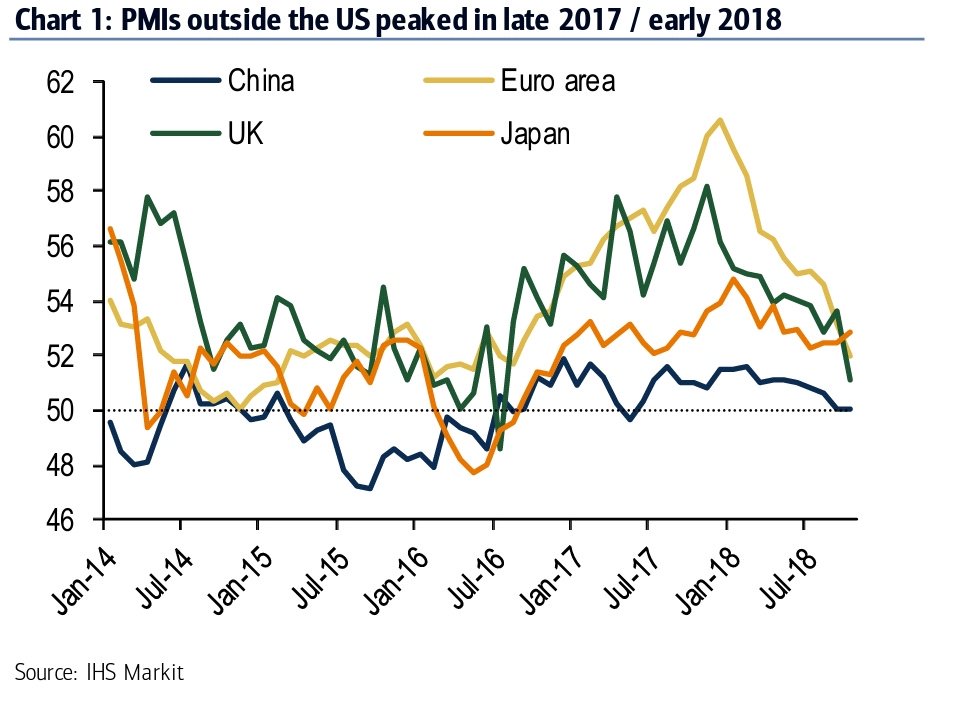
Similarly, Chris Williamson at IHS Markit recently pointed out that the US has been the last man standing when it comes to economic growth.
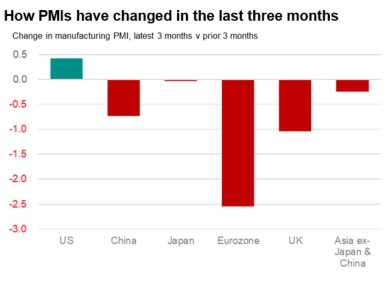
Non-US PMIs peaked in late 2017 or early 2018.
Germany, which has been the locomotive of eurozone growth, may already be in recession. German GDP shrank by -0.2% in Q3. The annual EPS growth rate of the DAX Index is now negative, and the last time this happened was the Greek Crisis of 2011.

The key risk for the eurozone is they never fixed their banking excesses from the last crisis. Bank assets to GDP remain outsized compared to the rest of the world. Financial contagion risk from Europe is high should the world slow into recession.

China: Running out of bullets
The other source of major global systemic is China. We have all heard about the debt buildup in China, and how it is unsustainable, etc. This time, China may be finally hitting the debt wall.
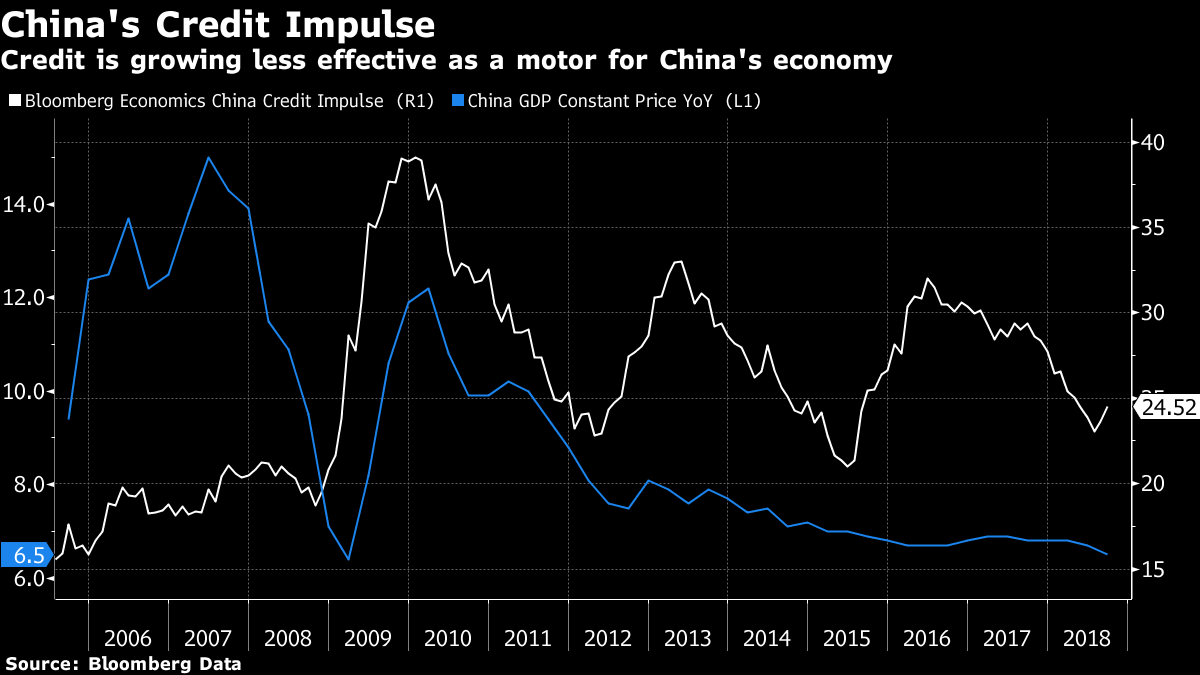
The Chinese economy was already slowing before the onset of the trade war. Much of the moderation in growth was engineered by Beijing in order to better control burgeoning debt. That said, John Authers recently pointed out that efforts at further credit driven stimulus is not having the expected response because of the law of diminishing returns.
China’s policy options are becoming more and more limited. Then we have the problem of the trade war becoming Cold War 2.0. I wrote about this problem back in January (see Sleepwalking towards a possible trade war), when America’s National Security Strategy 2017 designated China as a strategic competitor. Conflict was not just about trade, but in the geopolitical and military dimensions as well. This represents a major policy shift. These are not just Trump tweets that could be forgotten in a few days, but a major change in outlook by the Washington establishment. In other words, Cold War 2.0.
Then there is the problem of the trade war. The Trump-Xi meeting in Argentina produced a somewhat inconclusive he said-she said handshake truce. The terms were never put down in writing, and what was reported by each side sounded more and more like a wish list than an actual agreement. The markets staged a one-day relief rally on the news that the US tariffs scheduled for January 1 was to be delayed.
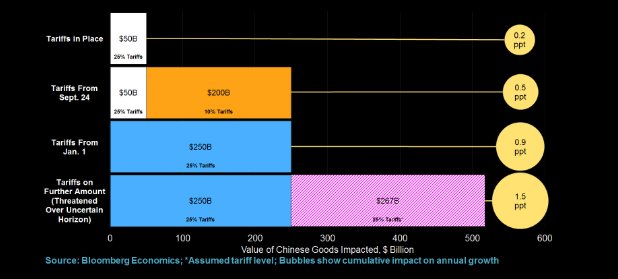
The effects of the scheduled January 1 tariffs are highly consequential for both countries. The chart below shows the project effects on Chinese GDP growth if the existing tariff rate rose from 10% to 25%, and the effects if Trump were to impose tariffs on all remaining imports from China. The IMF also projected that US GDP growth would decelerate by 1% in the event of a full-blown trade war.
It was never clear to the Chinese what Trump wanted from the negotiations, as the demands kept changing. It is becoming clear that, in addition to taking steps to reduce the trade deficit, the US wants China to stop its program of forced IP transfer from western companies. To China, this is viewed as a way of arresting their development, which is a non-starter. The appointment of Robert Lightizer as trade negotiator was undoubtedly a disappointment to China, as Lightizer is known as a trade hawk. An article in the Asia Nikkei Review indicates that Trump and Lightizer are demanding concessions that Xi simply cannot deliver.
Immediately after the 90-day period expires, China holds the most important political event of the year. This is the annual session of the National People’s Congress, China’s parliament, which gathers the great and the good of Chinese politics in Beijing for two weeks.
Trump has given Xi until then to make significant concessions in the trade negotiations. But the Chinese public was not informed of this ultimatum until Wednesday, when the Commerce Ministry finally touched on the 90-day time frame in a statement.For China, any negotiation involving the country’s number one, Xi, cannot go wrong, let alone collapse. It was thus a forgone conclusion that the Xi-Trump summit would reach an “important consensus,” regardless of the facts.
Xinhua News Agency added an odd spin to its reporting of the agreement. “As required by the 19th National Congress of the Communist Party of China, Beijing is committed to deepening reform and furthering opening-up,” the report said. “In the process, some economic and trade issues that are of Washington’s concern will be solved,” Xinhua added.
The sentences sum up Xi’s final offer, which has been formed through intraparty discussions.
To put it simply, the sentences tell us that Xi, who doubles as party chief, can only make concessions within the framework of the policies adopted at the quinquennial party congress of October 2017.
What were they?
“The Communist Party of China will lead the country to basically realize socialist modernization by 2035,” Xi said at the 2017 congress. Although his words were mild, his reference was to a grandiose plan calling for China’s economy to overtake the U.S. by 2035, some 15 years or so earlier than previously planned.
To do so, it calls for “stronger and bigger” state-run companies. And China will move closer to achieving the target if it acquires overseas companies with advanced technologies in accordance with “Made in China 2025,” a carefully designed blueprint for upgrading China’s strategic industries.
I don’t want to just blame the American side for this mess. The combination of the timing of the 90-day deadline and the institutional constraints of the Party’s policies also boxes Xi in from making any substantial concessions without losing face and making himself politically vulnerable. In short, both countries are locked into a struggle that increasingly looks like Cold War 2.0.
The latest news that Canadian authorities arrested the Huawei CFO at the request of the Americans because Huawei allegedly sold US equipment to Iran is another sign that the Buenos Aires truce is unlikely to last. Huawei’s CFO is the daughter of the company’s founder, and Huawei is one of China’s champions in the telecom equipment industry. This provocative action sends a chilling signal to China that the Americans are resolute in retarding China’s growth potential. The potential of tit-for-tat escalation is high unless cooler heads prevail. Numerous American executives live in China and they could also be taken into custody on charges. For example, the executive of any US company that sells weapons to Taiwan is in contravention of Chinese law and could be taken into detention.
At the same time, Trump tweets like this “tariff man” tweet doesn’t exactly help to calm tensions.
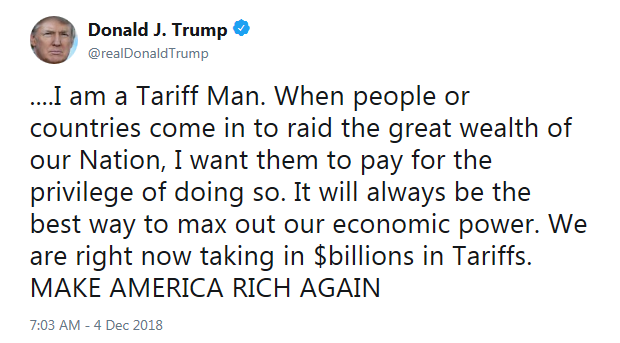
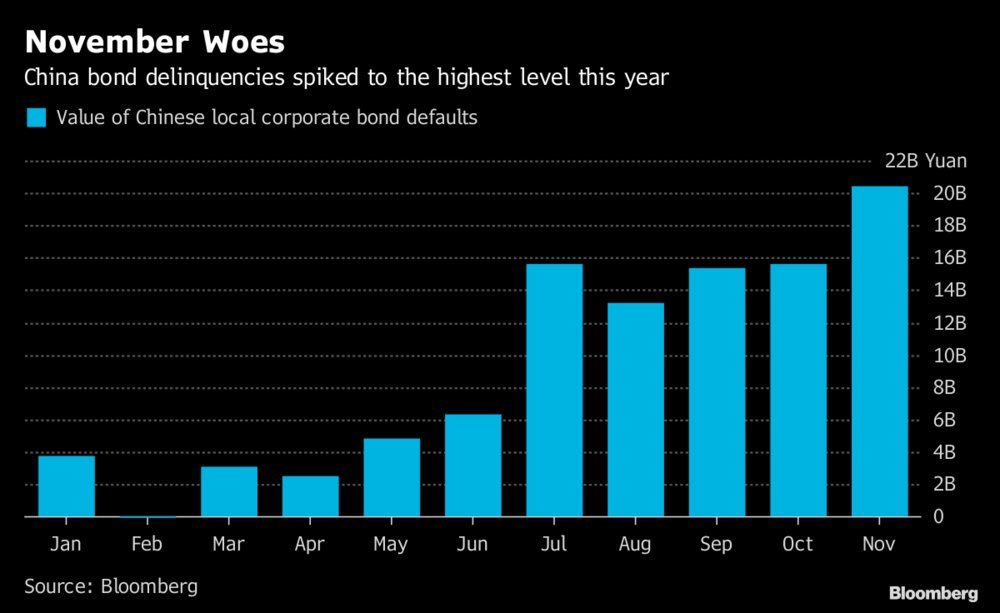
In the meantime, Chinese corporate defaults continue to rise.
In conclusion, conventional macro models indicate that readings are deteriorating and very close to a recession call, but not just yet. However, weakness in the non-US economies, economic weakness in China, even without a trade war, and the high likelihood of a trade war that is a byproduct of a new Cold War 2.0 are combining to push the US economy into recession in either late 2019 or early 2020.
The week ahead
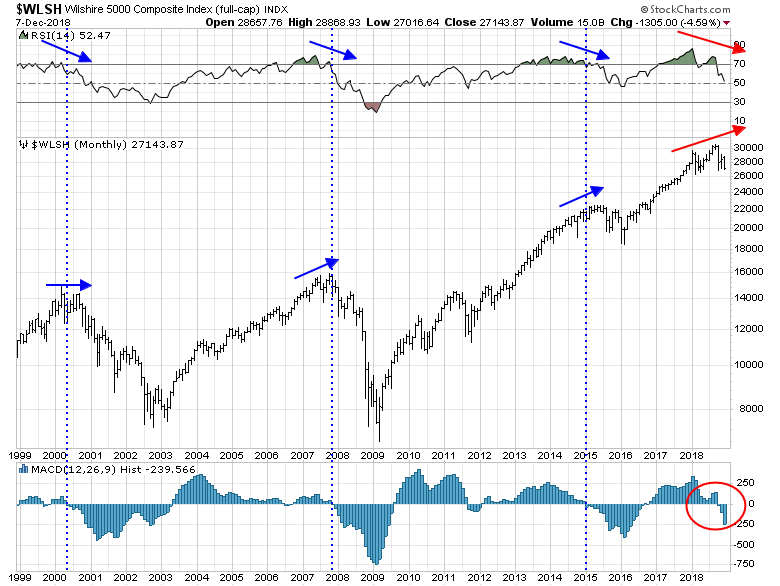
The recent volatile market action bears the signature of a bear market. Longer term, I have warned on multiple occasions about the negative RSI divergence and MACD sell signal on the monthly Wilshire 5000.
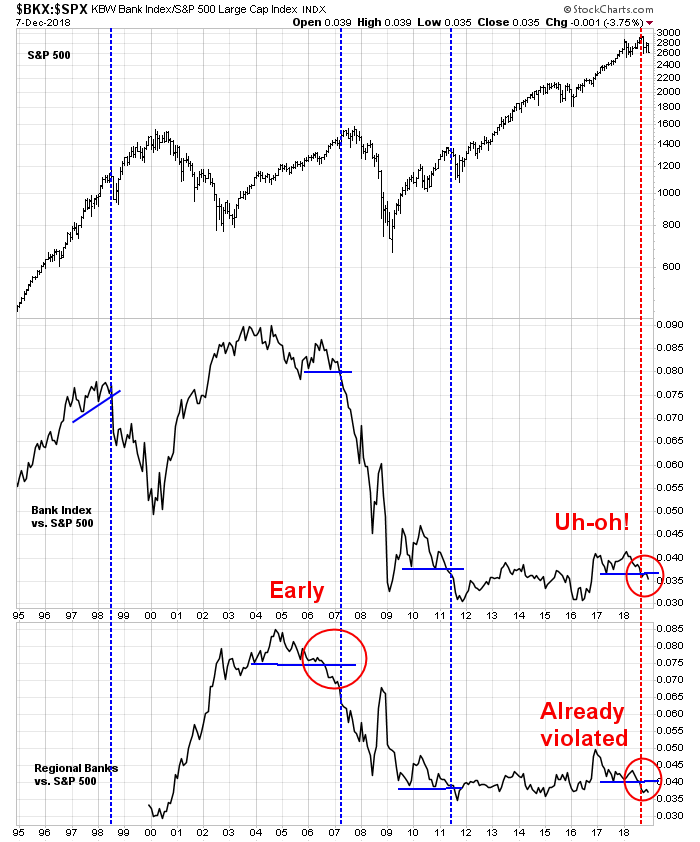
I have also pointed out before the relative breakdown of bank stocks have led to major market dislocations in the past.
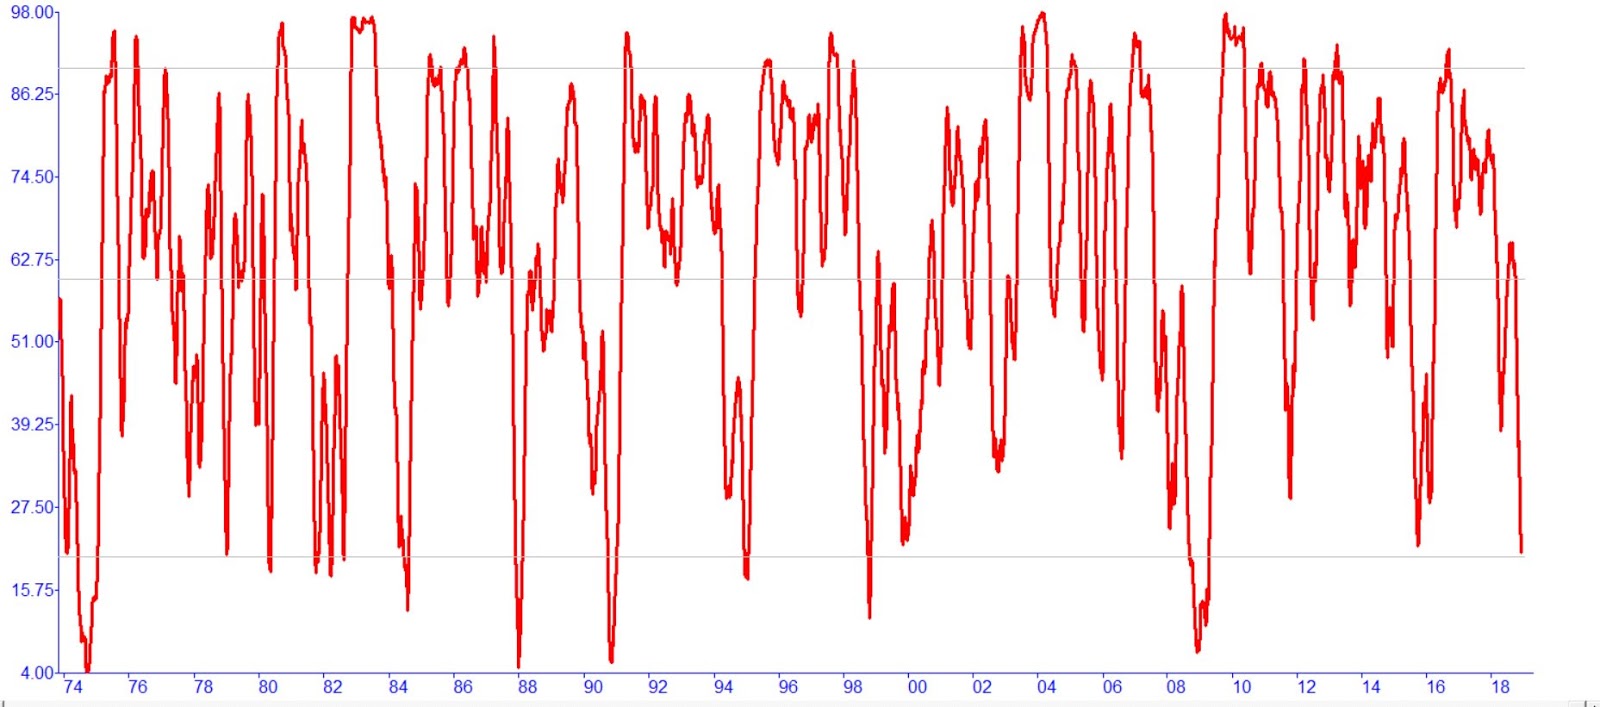
My former Merrill Lynch colleague Walter Murphy pointed out that market breadth readings are consistent with levels seen in past major bear markets:
The late Marty Zweig is well known for his breadth thrust indicator. Less well known is his high-low index measuring the 60-day ma of the ratio of NYSE 52-wk highs to 52-week lows. The attached chart shows that his index is now on a par with previous cyclical lows since 1974.
That said, last week’s -4.6% drop in the SPX moved readings to an oversold level, indicating that the market is poised for a relief rally. Counter-trend rallies during bear markets can be short and sharp, so traders should keep that in mind as part of their risk management.
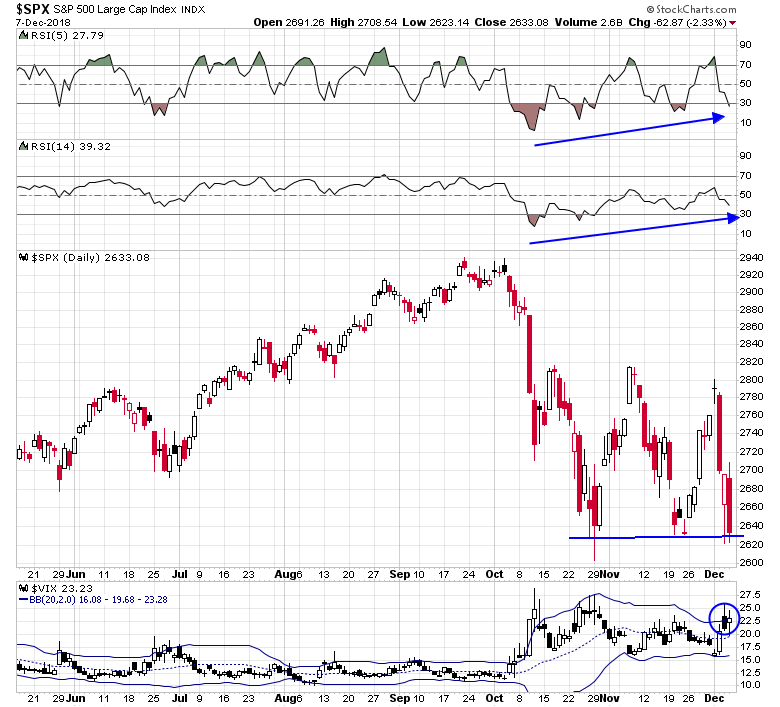
The SPX closed the week by testing its November lows while exhibiting positive RSI divergences. In addition, the VIX Index is within a hair of its upper Bollinger Band, which is indicative of an oversold condition.
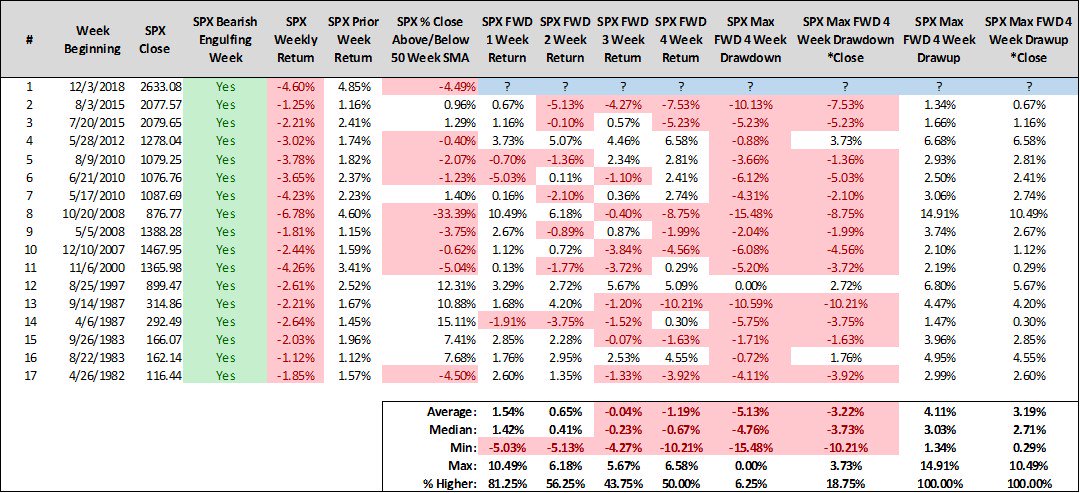
Steve Deppe observed that the bearish engulf pattern for the SPX on the weekly chart. Historical analysis shows that such patterns tend to be bullish in the short-run, though volatility can be vicious.
Short and long term breadth indicators from Index Indicators are supportive of short-term strength. The market is oversold on short-term breadth.

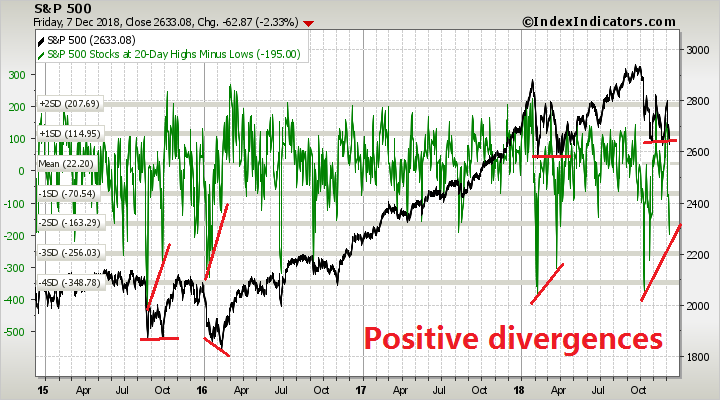
On the other hand, longer term breadth indicators are exhibiting positive divergences seen in past bottoms.
My inner investor has already reduced risk. Subscribers received an email alert on Friday that my inner trader had covered his very profitable short position that he entered into early last week and gone long in anticipation of a reflex rally.
Disclosure: Long SPXL
Is there a spot on the website that shows the dates of prior ultimate market timing model changes?
No there isn’t. I built that model in early 2016, and since then there has been no recession warning and therefore no changes.
Cam,
I agree with your bear market call. I have several proprietary sentiment based indicators that have now reached levels only seen in the 2000-2002 and 2007-2009 bear markets.
email alert Friday:
I did not get an email from you on Friday December 7th. Apparently I am not getting the email alerts. I get emails announcing the new subscriber posts, but not the alerts.
I’m now preparing for the bear market low. Seems early, yes. Maybe it’s just because my head is spinning from the daily twists and turns last week. But, Ken, the guy that’s been bearish since early this year is seeing a possible bear market low happening sooner that most people expect. I do a lot of work in identifying turning points in bull/bear market cycles.
On January 21, 2016, I called for the end of the bear market and said a new bull market had started. It bottomed January 20 and we’ve had the bull market I forecast.
The confusion then as it is now, is that investors in North America are extremely U.S.-centric. There was a clear global bear market from Mid-2015 to the low in January 2016. Being in Canada where our market was down 23% help me see what EVERY country in the world was experiencing outside of the S&P 500 and NASDAQ. We were in a classic bear market. Even the Russell 2000 was down a bear market, 26%.
When I said early this year that we were in a bear market, it’s turned out to be the case around the world outside the U.S. Now we are seeing downswings like we did twice in 2015 in the U.S. as the weakness hits there later.
Bull markets peak when stocks get expensive after a long upswing, investor sentiment gets extremely optimistic and central banks tighten. Early this year that was check, check, check. Bingo a peak.
From there a future bear market low occurs when stocks get cheap, investor sentiment gets extremely pessimistic and a central bank eases.
If this leg down in the U.S. market gets as ugly as I think it could (ETF liquidity panic or other nastiness of a political nature), we could see a major, lightning flash decline. That would give us a cheap stock market with extreme sentiment pessimism. Global markets don’t need a big decline to get to those levels since they are already down a lot.
What about Fed easing, the last of the three requirements I mentioned? Amazingly, it’s very possibly already happening. Take a look at this chart
https://product.datastream.com/dscharting/gateway.aspx?guid=b7ec9234-f31b-4931-89e1-1040262ad80a&action=REFRESH
It is the futures market for Fed Funds at the end of 2019 and 2020 that has dropped incredibly lately. We are close to seeing a projection in the futures of NO increases in 2019 and a DECLINE in 2020.
Futures traders have been very accurate on Central Bankers policy. The rest of us have been convinced that Powell is much more hawkish that Yellen and Bernanke. We have come to believe he will stay the course with the Dot Plot upward path. Recently he’s given two very dovish speeches as did Brainard who was considered a hawk. Note that they’ve decided not to give forward guidance anymore. It’s one thing to give upward forward guidance due a wonderful economy. It’s another when you project a decline in rates because you know the economy is on the rocks. That kind of projection, you like to keep in the meeting room.
The question I ask myself is, with the aid of the Fed futures market signal on future easing already built in, if the U.S. stock market takes a sharp tumble of say, 5-10%, and global markets do as well taking them into true bear market territory (down over 20%) should I step in and buy thinking a new bull market is being born? Very likely.
I should at least scale back in from my extreme underweight position. I will be watching high yield spreads to detect stress levels. Just like when stock markets turned up in early 2016, spreads should peak and fall when U.S. markets bottom. I’ll be watching emerging market bond spreads as well for a read on global economic stress. I need confidence in the economy to get truly bullish.
Fellow readers, I just wanted to give you a heads up in case event proceed quickly.
Good luck. We are in this together.
Ken – you are the man.
If one considers Elliott waves and you go to higher degree waves, how does this affect indicators? I don’t believe that Elliott waves can predict because you can always fit patterns into various corrective forms and impulses. But if you look at charts, whether they are 1 minute charts or 1 month charts one sees patterns that have a resemblance. Whether these are fractals or not does not matter. All of this is a preface to my question. There is the Kondratieff cycle and maybe from 1929 to now is one large degree wave. This would mean that indicators based on data even back to the 50s might be misleading. When there was the crash of 29 it took until what, 1954 for price to recover, so on a really long term view at some point there will be another lengthy decline. As far as the near term, we are due for a bear, which year I dunno but I will follow Cam’s thinking, and I don’t know if this one will show on a 500 year chart like 29 to 54 will, but one of these years it will happen because this kind of pattern keeps happening. In summary my question might be better phrased as ” Could it be that we are using the equivalent of 4 hour metrics on a daily chart?” Sorry to be so long winded.
Cam, 2 questions:
– Any relief rally should probably stop below the level of 3 previous failed rallies, right?
– in this Bearish outlook, witch could be the best assets for investors? Governative Bonds, gold, defensive equities or other?
Question: If you are calling for a bear market then what you are really saying is that the market will not make a new high?
The bear case is based on a recession call because of:
1) Recession, or near recession, conditions in the US. New Deal democrat, who is the inspiration for the Recession Watch indicators, is on the verge of calling a recession https://seekingalpha.com/article/4227104-weekly-high-frequency-indicators-long-leading-forecast-remains-negative
2) Weakness in Europe. German GDP -0.2% in Q3 and may be in recession already.
3) Weakness in China, even without the trade war. There are also indications that an over-leveraged China is hitting the debt wall.
4) The trade war, which could tip the world into a slower growth path.
Putting it all together, 2 and 3 may be enough to tip the US into recession. The trade war may seem like the tipping point, but the other factors matter as well.
In a bear market, we will no doubt get lower lows and lower highs.