Preface: Explaining our market timing models
We maintain several market timing models, each with differing time horizons. The “Ultimate Market Timing Model” is a long-term market timing model based on the research outlined in our post, Building the ultimate market timing model. This model tends to generate only a handful of signals each decade.
The Trend Model is an asset allocation model which applies trend following principles based on the inputs of global stock and commodity price. This model has a shorter time horizon and tends to turn over about 4-6 times a year. In essence, it seeks to answer the question, “Is the trend in the global economy expansion (bullish) or contraction (bearish)?”

My inner trader uses the trading component of the Trend Model to look for changes in the direction of the main Trend Model signal. A bullish Trend Model signal that gets less bullish is a trading “sell” signal. Conversely, a bearish Trend Model signal that gets less bearish is a trading “buy” signal. The history of actual out-of-sample (not backtested) signals of the trading model are shown by the arrows in the chart below. The turnover rate of the trading model is high, and it has varied between 150% to 200% per month.
Subscribers receive real-time alerts of model changes, and a hypothetical trading record of the those email alerts are updated weekly here. The hypothetical trading record of the trading model of the real-time alerts that began in March 2016 is shown below.

The latest signals of each model are as follows:
- Ultimate market timing model: Buy equities
- Trend Model signal: Bearish
- Trading model: Bullish
Update schedule: I generally update model readings on my site on weekends and tweet mid-week observations at @humblestudent. Subscribers receive real-time alerts of trading model changes, and a hypothetical trading record of the those email alerts is shown here.
Winter is coming
The market will undoubtedly react positively to the news from Buenos Aires at the market open on Monday. Both sides agreed to a 90-day ceasefire, where the US agreed to hold off on additional tariffs scheduled for January 1, and China agreed “to purchase a not yet agreed upon, but very substantial, amount of agricultural, energy, industrial, and other product from the United States to reduce the trade imbalance between our two countries”. The trade war will be back on if both sides don’t come to an agreement after 90 days.
Risk on!
Josh Brown had a terrific analogy for the stock market, though he could not claim to be the originator. He characterized the stock market as a untrained and hyperactive Jack Russell terrier leashed to its owner, the economy. Both move in the same general direction, but the dog`s movements are far more erratic and excitable. They don`t have the same temperament and tendencies, but over time, they move in the same direction.
Technical analysis can help with discerning the short-term movements of the dog, and fundamental and macroeconomic analysis gives us insights on the dog handler. Notwithstanding the results of the trade negotiations in Buenos Aires, our analysis of the handler (economy) provides ample evidence that winter is coming.

More ominous is the Morgan Stanley Leading Economic Indicator, which is pointing to a significant deceleration in earnings growth in 2019, even without a trade war.

The only question is whether it will be a mild or harsh winter.
Growth is decelerating
The signs of economic weakness are spreading, and don’t be surprised if the market take fright early next at the possibility of a recession. Calculated Risk reported that the Philly Fed Coincident Index is displaying signs of negative momentum.

In a separate post, Calculated Risk also reported that the Chemical Activity Barometer (CAB, red line) is also showing weakness. The CAB has shown itself to be a leading indicator of industrial production (blue line). While the deceleration in CAB is not signaling an actual contraction in industrial production, it does indicate decelerating growth ahead.

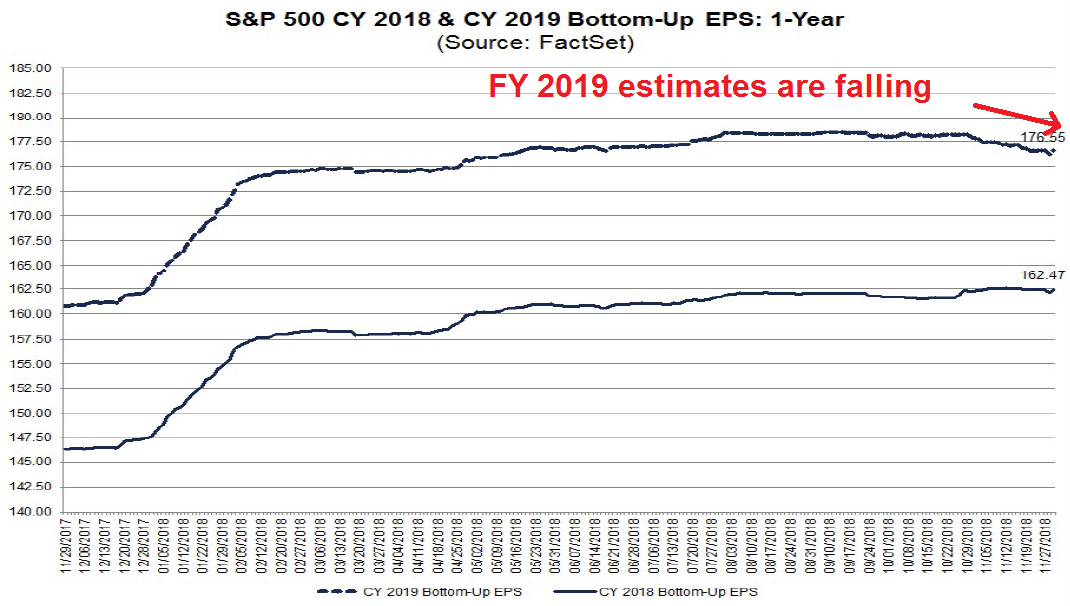
A more serious problem for equity investors is the evolution of EPS estimates. Analysis from John Butters of FactSet shows that earnings estimates revisions have flattened, indicating waning fundamental momentum.

FY 2019 estimates are now falling as analysts look ahead to next year.
Brace for disappointment in 2019
There are good reasons for the downward revisions to 2019 earnings estimates. First, the sugar high from the tax cut is wearing off.

In addition, the exchange rate will be another headwind for revenues.

Trade war or no trade war, economic activity is likely to slow in the first half of 2019. The prospect of rising tariffs pulled ahead some economic activity as companies stockpiled inputs. Moreover, management delayed capital investments because of trade policy uncertainty. Don’t forget wages. The Atlanta Fed’s wage growth tracker is showing upward wage pressure, and widespread signs of labor shortage will squeeze operating margins.
Put it all together, we have the picture of increasing pressure on earnings in 2019. The “E” in the forward P/E ratio is too high. Expect further downward revisions in the months ahead.
A mild or harsh winter?
Having established that a metaphorical winter is ahead, the only question left is whether it will be a mild or harsh winter. New Deal democrat, who has been monitoring the economy by splitting economic indicators into coincident, short and long leading indicators, stated that he was not ready to call a recession using conventional economic analysis. However, his conclusion comes with a caveat:
Between increased corporate profits and loose lending, as reflected in the Senior Loan Officer Survey several weeks ago, the producer side of the economy continued to do very well through September. Although several other long leading indicators, most importantly interest rates and housing turned negative by the end of September, this is enough to confirm that, left to its own devices, the economy should not roll over into recession in the first three quarters of next year.
The “left to its own devices” part in the above sentence, however, is an important qualifier right now, because it does not include the effect of Trump’s tariffs. This is an ongoing and generally haphazard public policy intervention into the market, and the early results, as measured by rail traffic in particular, have been negative. It is simply impossible for me to do anything more than guess how much that might change the conclusion. At the most, I would hazard that Trump will continue to add tariffs, and that it *could* take a weak economy, such as I already foresee for next summer, and tip it into contraction.
The caveat is the trade war. So far, the following chart shows that the effects have been mainly a trade skirmish than a full-blown war.

The IMF’s model projects that a full-blown trade war would reduce China`s GDP growth by 1.6% and US growth by about 1%. As well, most of Asia will caught in the crossfire.

In particular, a separate IMF study shows that the risk comes from the imposition of additional tariffs on approximately 260 billion in Chinese imports. While the Commerce Department’s initial tariff list focused mainly on finished goods from China, the tariffs imposed on the remaining imports are on intermediate goods, which are inputs to US production. As the chart below shows, the effects of input tariffs on output and productivity (top panels) are far worse than the effects on output tariffs (bottom panels).

The 90-day truce achieved at the G20 achieves very little. The long-term issues remain intractable, China is not going to change its development strategy. Expect the Trump administration to re-impose its planned tariffs in some time in 2019. The two countries are still headed toward a Cold War 2.0.
The case for a mild winter
However, there are signs for optimism. Callum Thomas of Topdown Charts pointed out that State Street’s custodial data shows North American institutional investors have already de-risked their portfolios. How much more selling could they do?

I conducted a similar (unscientific) Twitter poll, and the results showed a similar defensive orientation.

In addition, insiders have been buying the most recent dip. The latest readings show that this group of “smart investors” continue to buy their own stock.

The forward P/E ratio has seen considerable multiple compression. If the market were to sidestep a recession, the degree of de-rating is consistent with past market hiccups, such as the episodes in 1995, 2011, and 2015. Now imagine that estimates go down 10-15% for the reasons I cited. If stock prices were to remain unchanged from today’s levels, the forward P/E ratio rises to 18.4 if estimates fall 15%, which indicates minor downside risk, but no major decline.

If the economy avoids a recession under the “mild winter” scenario, I expect stock prices to weaken in 1H 2019, and that should provide the buying opportunity for investors. If the US and China can keep the trade tensions controlled, and the world sidesteps a recession, then the mild winter scenario is very much in play.
On the other hand, if either the trade conflict deteriorates into a full-blown trade war, or if the macro data in my set of long leading indicators weaken enough to signal a recession, then all bets are off.
The week ahead
Looking to the week ahead, it’s difficult to conduct much in the way of technical analysis ahead of an event with binary outcomes such as the Trump-Xi meeting in Buenos Aires. In all likelihood, news of a truce will be the spark for the long awaited year-end rally. That said, how the market reacts to such an event can be more revealing that the bullish or bearish result from the announcement.
Here is what I am watching. I wrote about the effects of the USD has on the market’s risk appetite (see A Dow Theory sell signal?). Despite last week’s equity risk-on rally, the greenback advanced to within a hair of the 97.50 mark, which was my line in the sand for a 5% year-over-year change in the USD Index. Watch the market reaction in the upcoming week.

Stock prices also rose late last week in anticipation of a US-China deal. Short-term breadth is already overbought. I would be cautious about jumping into the anticipated melt-up on Monday.

As the market rallies on the good news, keep an eye on equity risk appetite, as measured by price momentum and the high beta/low volatility ratio.

The credit markets did not participate in the risk-on rally that occurred late last week, which is a cautionary signal of risk appetite. I will also be monitoring how the credit markets respond to the news from the weekend.

My inner investor has already de-risked his portfolio because his belief that winter is coming. My inner trader stepped aside and moved to cash last week to avoid the event risk from Buenos Aires.
With regard to the $USD chart and commentary, you speak about being “within a hair of the 77.50 mark.” I’m wondering if you meant to say: “97.50 mark.”
Sorry for the typo. You are correct, and the correction has been made.
BREAKING: Don’t get too bullish, the Chinese and US versions of the meeting are quite different.
https://twitter.com/chigrl/status/1069183951867138049
Just curious, what if we gap up straight to 2800 and hold that gap till Dec, we could squeeze for a while, wondering what we do in that case?
Lack of bad news may be good enough for the markets to rally. There may be no real selling until shortly before the next Fed meeting (which is in opex week)
I will be more interested to see how the market behaves on Monday. How it opens, and how it closes.
It is possible that a sober second look at the press releases from both sides tempers bullish enthusiasm. What each side thinks was agreed upon is starting to look like that side`s wish list, e.g. there was no mention of the 90 days in China`s press release.
https://twitter.com/chigrl/status/1069183951867138049
What I find interesting is that Trump is only giving 90 days for these negotiations. I was expecting 180 days. I think he is pretty serious about raising tariffs to 25% (and may be even more restrictions) after the expiration of this period if nothing substantial emerges in the next 90 days.
Sentiment readings hit extreme pessimism for the second time in recent action, October 29 and November 23. This combined with new Fed dovishness and the normal year year end rally season leads me to expect tradable intermediate rally.
I’m watching Black Rock stock price as my proxy for market direction. If it makes a new low anytime, look out below. The environment for stocks will turn bleak.
Here is one year chart of S&P 500. There is stiff resistance here at the 2800-2820. There appears to be a Heads and Shoulders pattern being created with a neck line at 2600.
Time will tell if this pattern unfolds or not.
https://tinyurl.com/y9ds9aca
[Link shorted by Cam, as it was interfering with the formatting of post]
In my view today will be a time to fade the rally. I am waiting for the e-mail from Cam saying – I am starting to short. Thank you very much Cam for your work. Petr
“the Chinese and US versions of the meeting are quite different” – Different audiences. Hilarious when presented side-by-side, though. Maybe an entertaining 90 days.
Anyone paying attention to the near “death cross” on the S&P 500?
Thoughts on if that occurs.